

Abstract
The University of California Santa Cruz (UCSC) Genome Browser is a popular Web-based tool for quickly displaying a requested portion of a genome at any scale, accompanied by a series of aligned annotation “tracks.” The annotations generated by the UCSC Genome Bioinformatics Group and external collaborators include gene predictions, mRNA and expressed sequence tag alignments, simple nucleotide polymorphisms, expression and regulatory data, phenotype and variation data, and pairwise and multiple-species comparative genomics data. All information relevant to a region is presented in one window, facilitating biological analysis and interpretation. The database tables underlying the Genome Browser tracks can be viewed, downloaded, and manipulated using another Web-based application, the UCSC Table Browser. Users can upload personal datasets in a wide variety of formats as custom annotation tracks in both browsers for research or educational purposes.
Keywords: Genome Browser, Table Browser, human genome, genome analysis, comparative genomics, human variation, next-gen sequencing, human genetics analysis, biological databases, BAM
INTRODUCTION
The rapid pace of public sequencing and analysis efforts on vertebrate genomes, combined with the advent of next-generation sequencing, has escalated the demand for tools that offer quick and easy access to the data and annotations at many levels and facilitate comparative data analysis. The University of California Santa Cruz (UCSC) Genome Bioinformatics Web site at http://genome.ucsc.edu provides links to a variety of genome analysis tools, most notably the UCSC Genome Browser (Kent et al., 2002; Fujita et al., 2011), a graphical tool for viewing a specified region of a genome and a collection of aligned annotation “tracks.” Another tool on the Web site—the UCSC Table Browser—facilitates convenient access to the MySql database tables (Karolchik et al., 2003) underlying the Genome Browser annotations. Both browsers support a custom annotation tracks feature that enables users to upload their own data, including next-generation sequencing data, for display and comparison.
The main protocol of this unit (see Basic Protocol) describes how to display and navigate among the annotation tracks in selected region of the Genome Browser, configure the browser tracks image to focus on annotations of interest and optimize comparative analysis, link to external information, and download sequence or annotation data. Support Protocol 1 explains how to create and display a custom annotation track based on the user’s own data and set up a Genome Browser session to preserve a group of tracks and settings for later use. Support Protocol 2 provides a basic overview of the UCSC Table Browser, describing the most commonly used functions, how to set up a simple query, and some of the advanced features. The Genome Browser annotations and software continually evolve as new data and techniques become available; therefore, it is recommended that the user consult the UCSC Genome Browser Web site (http://genome.ucsc.edu) and the current version of the User’s Guide (http://genome.ucsc.edu/goldenPath/help/hgTracksHelp.html) for the latest information on new releases and features.
BASIC PROTOCOL USING THE UCSC GENOME BROWSER
The Genome Browser software and data may be accessed on the Internet from the UCSC Genome Bioinformatics Web site at http://genome.ucsc.edu.
Necessary Resources
Hardware
Unix, Windows, or Macintosh workstation with an Internet connection and a minimum display resolution of 800 × 600 dpi
Software
An up-to-date Internet browser that supports JavaScript, such as Firefox 3.0 and higher (http://www.mozilla.com/firefox); Internet Explorer 7.0 and higher (http://www.microsoft.com/ie); or Safari 3.0 and higher (http://www.apple.com/safari). The browser must have cookies enabled.
Files
None
Navigate to a specific genomic position in the Genome Browser window
-
1
Open the UCSC Genome Bioinformatics home page at http://genome.ucsc.edu in a Web browser.
The UCSC Genome Bioinformatics home page provides links to the Genome Browser application and a variety of other useful tools: BLAT (Kent et al., 2002), for quickly mapping sequences to a genome assembly; the Table Browser (Karolchik et al., 2004; Fujita et al., 2011), for viewing and manipulating the data underlying the Genome Browser; the Gene Sorter (Kent et al., 2005), for exploring relationships (expression, homology, etc.) among groups of genes; VisiGene, for browsing through a large collection of in situ mouse and frog images to examine expression patterns; the Proteome Browser (Hsu et al., 2005), for viewing information about a selected protein; an in silico PCR tool for rapidly searching a sequence database with a pair of PCR primers; and Genome Graphs, a tool for viewing quantities plotted along chromosomes.General information about the Genome Browser tool suite can be found in the User’s Guide—accessed via the Help link—and the FAQ. From the home page, the user can also download genomic sequence and annotation data, browse a collection of contributed custom tracks and older archived data, review a log of released data, and access helpful utilities, training materials, credits for contributors and collaborators, mirror information, and related publications. The home page provides direct links to portals for the Encyclopedia of DNA Elements (ENCODE) Project Consortium (The ENCODE Project Consortium et al., 2004, 2007; Raney et al., 2010) and the Neanderthal Genome Analysis Consortium data (Green et al., 2010). -
2
Click the Genome Browser link in the left-hand sidebar menu to open the Genome Browser Gateway page.
On the Gateway page (Fig. 18.6.1), the user can set the parameters that determine which region of a genome the Genome Browser will initially display. The bottom portion of the page provides information about the currently selected genome assembly and a list of sample position queries that can be used to open the Browser.Alternatively, the Genome Browser can be accessed by clicking on the BLAT link on the home page and then searching a DNA or protein sequence for regions of homology (step 17). -
3
Select the clade, genome, and assembly of interest, and then type one or more search terms or a set of genomic coordinates into the “position or search term” text box to specify the genome region to display. Alternatively, type the name of a gene into the “gene” text box. Click the “submit” button.
The position search supports direct positional queries such as chromosome bands or chromosome coordinate ranges, as well as queries related to genomic features such as gene symbols, mRNA or EST accession numbers, identifiers for single nucleotide polymorphisms (SNPs), author names, or other descriptive terms likely to occur in GenBank (Benson et al., 2011). The Gateway page shows examples of valid position requests applicable to the selected genome assembly.If the position query is resolved to a single location, the Genome Browser will display a page containing an annotation track image specific to the position query, accompanied by navigation controls and display controls (Fig. 18.6.2). Frequently, the position search returns a list of several matches in response to a query rather than immediately displaying the Genome Browser page. When this occurs, click on the item of interest and the Genome Browser will open to that location. Invalid position queries (e.g., withdrawn gene names, abandoned synonyms, misspelled identifiers, and data added after the last Genome Browser database update) will result in a warning message and the previous or default position will be retained.Personal data sets, in the form of custom annotation tracks, can be uploaded into the Genome Browser by clicking the “add custom tracks” button on the Gateway page. For more information on creating and uploading custom tracks, see Basic Protocol 1.To search for one or more specific terms in the entire set of track names, descriptions, and track groups for the current assembly, as well as ENCODE metadata (selected human and mouse assemblies only), click the “track search” button.To access an older genome assembly that is no longer available from the assembly menu, look in the Genome Browser archives at http://genome-archive.cse.ucsc.edu, accessible from the Archives link on the home page.Several aspects of the Genome Browser display can be customized by clicking the “configure tracks and display” button (step 9).
Figure 18.6.1.
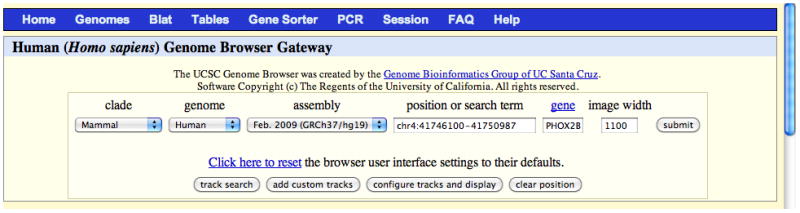
The Genome Browser Gateway page, set up to span the region of chromosome 4 (chr4:41746100–41750987) in the February 2009 hg19 human assembly (GRCh37) that corresponds to the location of the PHOX2B gene. The display range can be set to the position of a specific gene by typing the name into the “gene” text box. The user can generate a list of tracks containing certain attributes by clicking the “track search” button. Custom annotation tracks (Basic Protocol 1) can be uploaded by clicking the “add custom tracks” button. The initial Genome Browser display may be configured by clicking the “configure tracks and display” button. The lower portion of this page (not shown) displays a description of the selected assembly, relevant links, and examples of queries that may be entered in the “position or search term” box.
Figure 18.6.2.
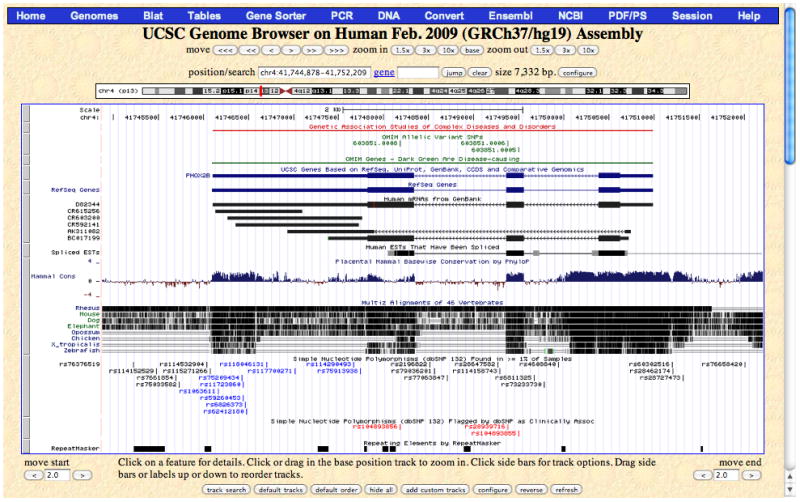
The Genome Browser annotation track page zoomed out to display the PHOX2B gene and its 5′ and 3′ flanking regions on human chromosome 4 (chr4:41,744,878–41,752,209) in the Feb. 2009 assembly (GRCh37/hg19). The navigation and configuration buttons are visible above and below the image. The red rectangle in the ideogram directly above the annotation tracks image indicates the location of the currently displayed region of the chromosome. The Common SNPs (132) track visibility has been changed from dense to pack to show individual SNPs, some of which are colored according to gene region (e.g., UTR or coding-nonsynonymous), and the Flagged SNPs (132), showing SNPs flagged as clinically associated in dbSNP, has been added by changing the display visibility to pack. The Phenotype and Disease Associations group has been opened, and three tracks from the group have been added to the display by changing their visibilities from hide to pack: GAD View, OMIM Genes, and OMIM AV SNPs. PHOX2B is a developmental gene that has also been associated with cancer; move the mouse over the PHOX2B item in the GAD View track in order to see a list of diseases associated with the gene. In the Vertebrate Multiz Alignment & Conservation track, note the areas of high conservation peaking in the upstream region (to the right because PHOX2B is on the antisense strand), UTRs, and most exons, as well as part of the first intron.
Browse and configure the annotation tracks display
-
4
Explore the Genome Browser annotation tracks page (Fig. 18.6.2).
This image displays a set of annotation tracks aligned beneath a Base Position track (the “ruler”) indicating genomic coordinate positions in a 5′ (left) to 3′ (right) orientation. Tracks are organized into groups reflecting the nature of their data. The first time the Genome Browser is opened, the application’s default values are used to configure this display. Any preferences and configurations set during the session will be retained for use in subsequent sessions on the same Web browser. To reset the display to the set of default tracks for the selected assembly, click the “default tracks” button.The complete set of available annotation tracks for the assembly is shown in the track groups section below the image, categorized by data type. Many of the tracks on the later human genome assemblies were contributed by the ENCODE Project; these are denoted by a double helix icon in the track label. Tracks generated by simply converting (“lifting”) the coordinates of the data from a previous assembly are marked by a black circle on which the UCSC version number of the originating assembly has been superimposed. See the Commentary section for more discussion of the annotation tracks available on the human genome.The annotation tracks image is accompanied by control buttons to configure the display and navigate through the sequence. For selected assemblies, a chromosome band ideogram directly above the image graphically indicates the location of the currently displayed region on the chromosome. Personal annotation data can be uploaded to the current assembly by clicking the “add custom tracks” button below the image (see Support Protocol 1 for more information).Figure 18.6.2 shows the annotation track image opened to the position of the gene PHOX2B on chromosome 4. To reach this position, enter PHOX2B in the gene text box, click “submit”, and then click the zoom out 1.5× button. (You can also reach this location by typing PHOX2B in the position/search box, clicking submit, and then selecting the first matching item -- the UCSC Genes PHOX2B.) Note that the Genome Browser automatically changes the text in the Position box to show the chromosomal position of the resulting display, in this case chr4:41,744,878–41,752,209. In most annotation tracks, the aligned regions are represented by vertical bars or blocks. In the Spliced ESTs track shown in this example, the degree of darkness of the block shading corresponds to the number of features aligning to the region. In the mRNA and gene prediction tracks, the thicker regions (usually coding exons) are connected by thin horizontal lines representing gaps (usually spliced-out introns). Thinner blocks on the leading and trailing ends of the aligning regions in gene tracks represent the 5′ and 3′ untranslated regions (UTRs). In full or pack display mode, arrowheads on the connecting lines indicate the direction of transcription.Note the comparative genomics annotations displayed in Figure 18.6.2. The Conservation track shows a measure of evolutionary conservation among multiple species, which tends to indicate functional regions of the genome. The lower section of the track shows pairwise alignments of each species to the reference sequence; the top section displays the evolutionary conservation scores assigned by the phyloP (Pollard et al., 2010) and phastCons (Siepel et al., 2005) methods (hidden by default) in the PHAST package (Siepel et al., 2005). In human assemblies, the display may be configured to show primates, placental mammals, or other vertebrates. When displayed in full or pack mode, the conservation track is a good example of wiggle (histogram) format in which the height reflects the magnitude of the score. At the level of detail shown in Figure 18.6.2, the scores highlight exons, untranslated regions (UTRs), and other regions that show signs of conservation across species.To generate a high-quality image of this annotation tracks image in PostScript or PDF format, click the PDF/PS link in the top menu bar. -
5
Change the display mode of an annotation track by right-clicking on it in the track image and selecting a display mode from the menu that displays, or by locating the track’s name in the track group section below the image, selecting a display mode from the track’s pull-down menu, and then clicking the “refresh” button.
Depending on individual display modes, annotation tracks may be hidden from view (hide mode), displayed with all features collapsed into a single line (dense mode), or fully expanded with each feature on a separate line (full mode). Many tracks feature two additional display modes: pack mode, in which each feature is displayed and labeled, but not necessarily on a separate line, and squish mode, which is similar to pack mode, but displays unlabeled features at half-height. To quickly toggle between dense and full (or pack) modes for a displayed track, click on the track’s label in the annotation track image. To hide all the tracks in the display, click the “hide all” button beneath the annotation tracks image.By adjusting the display modes of the tracks in the annotation track graphic, the user can restrict the display to data of interest, reduce clutter, and improve speed. Dense display mode is useful to get an overview of an annotation or to reduce the space used by a track when the individual feature details of an annotation track are not required. Squished and packed displays show individual feature details of densely populated tracks while conserving space. Use full mode sparingly: in some tracks, the number of features that may potentially align at a selected position can be quite large. When the feature count is excessive in full display mode, the Browser displays the track in pack mode if possible; if the track does not support pack mode, it displays the first 250 items individually, then groups the remaining items into a single line in dense mode at the bottom of the track. -
6
To move to a different genomic position, type a new set of search terms into the position/search box or a different gene name into the gene text box, then click the “jump” button.
Figure 18.6.3 illustrates a zoomed-in view of the genomic region displayed following a search on the SNP identifier “rs2108622” on the Feb. 2009 (GRCh37/hg19) human assembly. This is a common coding non-synonymous SNP in the human gene CYP4F2 that has been associated with warfarin dosage responsiveness by multiple studies in the NHGRI Catalog of Published Genome-wide Association Studies (GWAS) (Hindorff et al., 2009). Additional tracks in the Variation and Repeats group and the Phenotype and Disease Association group have been opened (step 5) to search for supplemental information.The SNP annotation tracks in the Genome Browser show mappings of single nucleotide polymorphisms and small insertions and deletions (indels) from the dbSNP database (Sayers et al., 2011). The dbSNP build 132 data have been separated into four distinct Genome Browser tracks to facilitate study. The Human Genome Diversity Project (HGDP, http://www.stanford.edu/group/morrinst/hgdp.html) and HapMap (The International HapMap Consortium, 2003; 2005, 2010) tracks show SNPs genotyped in several populations worldwide. The Genetic Association Database (GAD, Becker et al., 2004) and GWAS Catalog tracks show data from human genetic and genome-wide association studies. The Online Mendelian Inheritance in Man (OMIM; Amberger et al., 2009; UNIT 1.2) tracks show variants in the OMIM database that have been associated with dbSNP identifiers, the genomic positions of gene entries in the OMIM database, and regions known to be associated with a phenotype, but lacking a known causative gene. (See the Commentary section for a broader discussion of the annotation tracks in these two groups as well as cautions for using the data.)Figure 18.6.4 shows a larger region obtained by entering the query “22q13.32; 22q13.33” on the Feb. 2009 (GRCh37/hg19) human genome assembly. Several tracks that display best in large regions due to the sparseness of their annotations have been added to the display, and several tracks whose many items would saturate the display have been hidden. At this broad scale, the completeness of the assembly is indicated by the sparse gaps. It is easy to see regions of relative gene density or scarcity. Coarse measures such as population genetic statistics have more of a perceivable signal, while fine-scale measures such as the per-base Conservation scores have almost no signal due to averaging over large numbers of bases. -
7
Use the mouse drag-and-zoom feature or the “zoom” and “move” buttons to increase or decrease the breadth of the displayed coordinate range, or to shift one or both ends of the coordinate range to the left or right.
To quickly zoom in to an exact coordinate range, click on the desired leftmost coordinate in the Base Position track and drag the mouse to the right to highlight the region of interest. The navigation buttons are useful for generally focusing the display on a position. “Zoom” buttons increase or decrease the displayed coordinate range by 1.5-, 3-, or 10-fold. To zoom in by 3-fold on a particular coordinate, click the Base Position track at that location. To rapidly zoom in to the base composition of the sequence underlying the current annotation track image, click the zoom-in “base” button. “Move” buttons shift the displayed coordinates in the indicated direction by ~10%, 50%, or 95% of the displayed size. To scroll the coordinate position of one side of the track display while holding the position of the opposite end static, click the corresponding “move start” or “move end” arrow button. For example, to preserve the left-hand display coordinate but increase the right-hand coordinate, click the “move end” forward arrow. To increase or decrease the scroll interval, edit the number in the “move start” or “move end” text box. -
8
Use the drag-reorder feature to change the vertical ordering of the tracks.
To move a track up or down within the tracks image, click-and-hold the mouse button on the side label or gray button to the left of the track, then drag the highlighted track up or down within the image. Release the mouse button when the track is in the desired position.To restore the default ordering of the tracks, click the “default order” button below the tracks image. -
9
Click the “configure” button above or below the annotation tracks image to access a Web page for changing display characteristics (such as the image width and text size), hiding, showing, or reordering track groups, and displaying the chromosome ideogram, the track groups section, and image labels. Click the “submit” button on the configuration page to apply the changes and return to the annotation tracks image.
The “next/previous item navigation” and “next/previous exon navigation” features provide a quick way to move forward or backward among features or exons in a track. When these features are enabled, gray or white double-headed arrows will display on the 5′ and 3′ sides of tracks supporting the feature. Clicking on an arrow shifts the image view window toward that end of the chromosome so that the next item or exon in the track is displayed.The default display width of the annotation tracks graphic is optimized for smaller monitors with lower resolutions. Most displays are no longer subject to these limitations; in these situations, the visible portion of the genome can be increased by setting the image width to a larger number, thus reducing the need for screen redraws.Exercise caution when using the “show all” option in the track configuration section: if the group or assembly has a large amount of annotation data, the Web browser session may freeze or terminate before the datasets are loaded. -
10
Click the gray button to the left of a displayed track to view additional information about the annotation and (in many cases) to filter or configure the features displayed in the track.
The description page can also be displayed by clicking the track’s name in the track groups section.Click the button adjacent to the UCSC Genes track to view a typical description page. This page contains a configuration/filter section (when applicable) followed by a description of the annotation track, information about interpreting and configuring the track display, a discussion of the methods used to collect and compute the data, credits for authors and contributors, associated references, and in this case, restrictions on the use of the data. Additional credits can be found by clicking the Credits link on the home page.Most of the tracks in the Genome Browser have filter or configuration options that modify the graphical characteristics or restrict the display to features that match filtering criteria. Filters are useful for focusing attention on relevant features when a track contains large amounts of data. Some of the more complex graphical annotations, such as the continuous value graph (“wiggle”) display featured in the Conservation track, offer an extensive set of configuration options. In most cases, detailed configuration information can be found in the “Display Conventions and Configuration” section on the description page.Filter and configuration settings are persistent from session to session on the same Web browser. To revert to the original default settings for a track, manually restore the settings on the description page; to undo all changes that have been made to default settings for any track or tool, click the “Click here to reset” link on the Gateway page. -
11
Click on a feature name in a track shown in pack or full display mode to view detailed information about the feature and access links to additional information.
The types of information available vary by track. The RefSeq Genes track (Maglott et al., 2011) provides an example of a typical feature information page. Enter HOXA1 into the gene text box and click the jump button. In the track image, click on the HOXA1 gene label in the RefSeq Genes track to display the associated information page (you may have to adjust the track display mode first – step 5).By contrast, the UCSC Genes track has a more extensive collection of information about the gene, including the associated UniProt (The UniProt Consortium, 2011) and RefSeq descriptions, microarray expression data, links to associated information about this gene in several UCSC tools (such as the Gene Sorter and Table Browser), as well as links to related records in external databases, including Online Mendelian Inheritance in Man (OMIM; Amberger et al., 2009; UNIT 1.2), Entrez Gene (Sayers et al., 2011), Ensembl Genes (Flicek et al., 2011), GeneLynx (Lenhard et al., 2001), GeneCards (Safran et al., 2010), AceView, PubMed (Sayers et al., 2011; UNIT 1.3), the HUGO Gene Nomenclature Committee Database (HGNC; Seal et al., 2011), the Cancer Genome Anatomy Project (CGAP; Strausberg et al., 2001), PDB (Rose et al., 2011), ModBase (Pieper et al., 2011), InterPro (Hunter et al., 2011), Pfam (Finn et al., 2010), the Stanford SOURCE (Diehn et al., 2003), Mouse Genome Informatics at Jackson Laboratory (Blake et al., 2011), the Allen Brain Atlas (Lein et al., 2007) and more. The page also includes links that will display the corresponding protein, mRNA, and genomic sequences for HOXA1. These sequences are a useful source of input into the BLAT tool, which will be discussed in step 17.The Genome Browser also provides direct links to the Ensembl Browser (Flicek et al., 2011; UNIT 1.15) and NCBI’s Map Viewer (Sayers et al., 2011; UNIT 1.5), when available. To view the complementary annotation in one of these browsers, return to the annotation tracks page and click the Ensembl or NCBI link in the top menu bar.
Figure 18.6.3.
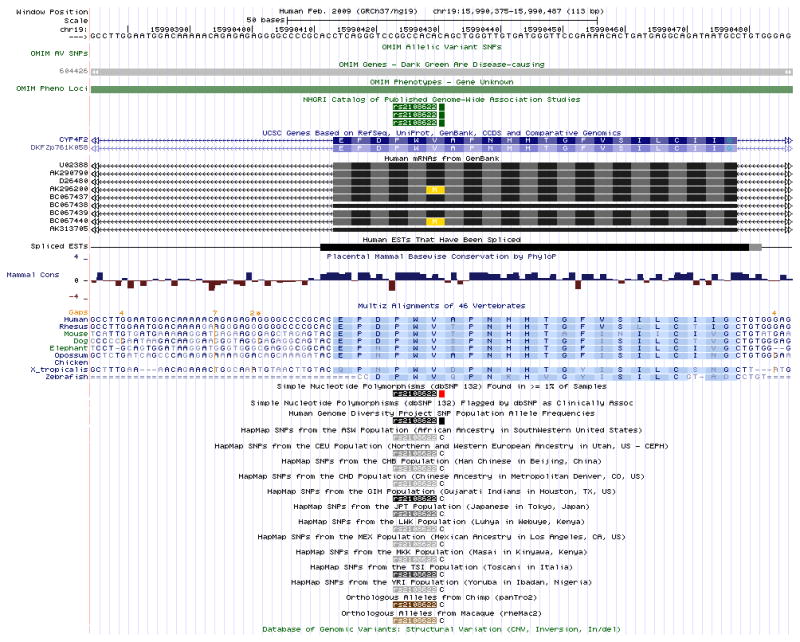
The Genome Browser view displaying the bases surrounding the SNP rs2108622 on chr19 (chr19:15,990,375–15,990,487) in the Feb. 2009 human assembly (GRCh37/hg19). To view this region, enter “rs2108622” in the position/search box, choose one of the three results in the GWAS Catalog track, and then click the “base” button on the annotation track page. This zooms in the display to a level where single nucleotide bases can be studied; note the bases (A, C, G, T) drawn in the Base Position track, Conservation track, and HapMap SNPs. The orange numbers above the multi-species alignment in the Conservation track give the number of bases present in the other species, but not in the human reference, where an orange tick mark appears below. In the HapMap SNPs track, the major allele in each population is displayed instead of the usual colored box.
Figure 18.6.4.
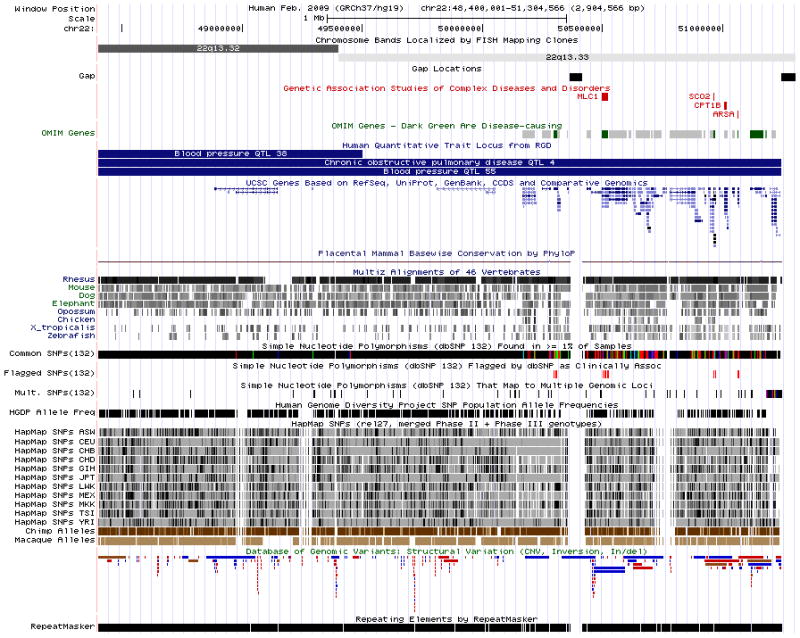
The Genome Browser annotation track page displaying chromosome bands 22q13.32 and 22q13.33 on chromosome 22 (chr22:48,400,001–51,304,566) in the Feb. 2009 human assembly (GRCh37/hg19). Several tracks useful for the display of large regions have been made visible: from the Mapping and Sequencing Tracks group, Chromosome Bands and Gap; from the Phenotype and Disease Associations, GAD View, OMIM Genes and RGD Human QTLs; and from the Variation group, Flagged SNPs (132), Mult. SNPs (132), HGDP Allele Freq, HapMap SNPs, and DGV Structural Variation. “Squish” display mode (Basic Protocol, step 5) has been set for UCSC Genes and DGV structural variation, in order to show the density of items in those tracks along the genome. Several tracks have been hidden because they have so many items in this large region that they would display as solid bars in dense mode, or take up large amounts of vertical space if displayed in pack or squish mode.
Examine the underlying data and download the sequence and annotation data tables
-
12
To view the DNA sequence underlying an item in the image, right click on the feature and select the “Get DNA for…” menu option. To view the DNA sequence of the region spanned by the image, click the DNA link on the annotation tracks page menu bar. This DNA utility allows the user to change the formatting and coloring of the text that represents the sequence to highlight features of interest.
The initial display window provides options for marking or masking repeats, changing the case of the letters that represent the DNA, showing the reverse complement of the sequence, and displaying additional sequence upstream or downstream of the selected sequence. Click the “extended case/color options” button to display additional font and color configuration options.The Extended DNA Case/Color Options page is useful for highlighting features within a genomic sequence, pointing out overlaps between two types of features, or masking out unwanted features. In Figure 18.6.5, the configuration has been set to display exons from the UCSC Genes track in uppercase letters. The Spliced EST track is configured to reflect the level of coverage by setting its color to RGB value (0, 64, 0). Common SNPs will display in a bold font, and Flagged SNPs will be underlined. When the Submit button is clicked, the Extended DNA Output window shown in Figure 18.6.6 is displayed.Note that only tracks currently visible in the Genome Browser tracks image are available for configuration on the Extended DNA Case/Color Options page. Be careful when requesting complex formatting for a large chromosomal region: when all the HTML tags have been added to the output page, the file size may exceed the limits that the Web browser, clipboard, and other software can display. -
13
Click on the Tables link on the annotation tracks page menu bar to access the database tables underlying the Genome Browser annotation tracks.
The Table Browser tool provides a graphical interface for viewing and manipulating Genome Browser data. Support Protocol 2 gives a brief introduction to using the Table Browser. Additional information can be found in the Table Browser User’s Guide accessible from the Help link in the Table Browser top menu bar. -
14
Click the Home link on the top menu bar to return to the UCSC Genome Bioinformatics home page, and then click the Downloads link on the side bar to display a listing of sequence files and database tables available for downloading.
The Downloads page contains links to all the Genome Browser assemblies, annotations, and source code available on the Genome Browser downloads server. To access older assembly versions, it may be necessary to look in the archives (http://genome-archive.cse.ucsc.edu). Data is also downloadable at the Genome Browser FTP site (ftp://hgdownload.cse.ucsc.edu/goldenPath/). FTP or rsync is recommended for large data downloads. All data in the Genome Browser are freely available, except where noted in the README.txt file specific to a particular downloads directory. The Genome Browser and BLAT source are freely available for academic, noncommercial, and personal use; commercial licensing information can be found via the Licenses link on the home page.
Figure 18.6.5.
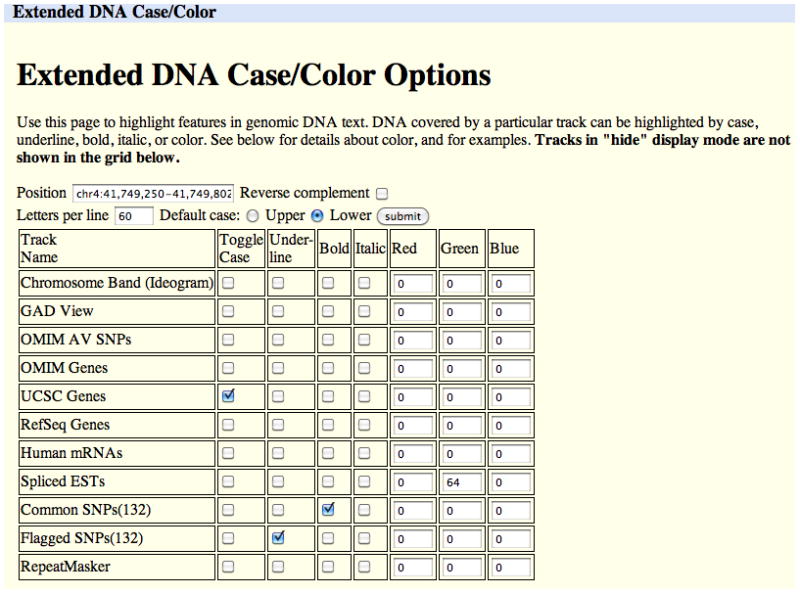
An extended DNA Case/Color Options request to display the DNA for the chr4:41,749,250–41,749,802 region of the Feb. 2009 (GRCh37/hg19) human assembly. This configuration sets up a display that will show UCSC Genes in uppercase, all other regions in lowercase, and Spliced ESTs in varying intensities of green, depending on the level of coverage. Common SNPs are shown in bold, and Flagged SNPs are displayed in bold and underlined.
Figure 18.6.6.
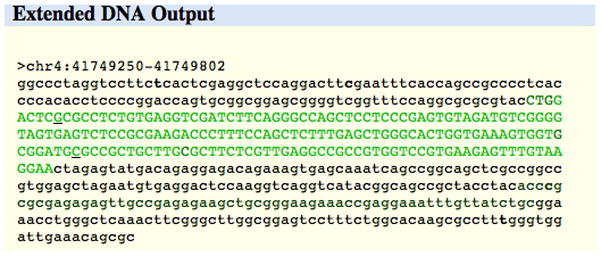
Output from the DNA display configurations set up in Figure 18.6.5. Exons are shown in uppercase. Nucleotides covered by a single EST appear darker green on the screen, while regions with more EST alignments appear progressively brighter, saturating at four ESTs. Common and Flagged SNPs are called out.
Convert coordinates in the displayed range to a different assembly using the Convert, LiftOver, or BLAT tools
-
15
Return to the annotation tracks page. Click the Convert link in the menu bar to convert the coordinates in the displayed range to those of a different assembly.
The coordinate conversion tool is useful for locating the position of a feature of interest in a different genome assembly. Coordinates of features frequently change from one assembly to the next as gaps are closed, strand orientations are corrected, and duplications are reduced. For example, to map the location of a sequence in the hg18 (Mar. 2006) human assembly to the hg19 (Feb. 2009) human assembly, open the hg18 Genome Browser to the desired position, click the Convert link, select the hg19 option in the New Assembly pull-down menu, then click the “Submit” button. If successful, the Convert tool displays one or more coordinate ranges in the hg19 assembly to which the hg18 sequence maps. -
16
To convert multiple sets of sequence coordinates between assemblies or to exert control over the parameters used in the conversion, use the LiftOver batch coordinate conversion tool.
The LiftOver tool can be accessed from the Utilities link on the Genome Bioinformatics home page. Enter the list of coordinate ranges in the large text box, one per line, or upload the list from a file. Detailed information about parameter settings can be found at the bottom of the page, as well as information about a Linux command-line version of the tool. -
17
Alternatively, use BLAT to map a sequence to a different assembly:
Obtain the DNA sequence for the region or feature using the methods outlined in step 12. Note that BLAT limits input to 25,000 bases.
Using the Web browser’s copy function, copy the entire sequence onto the clipboard. Return to the annotation tracks page and click the BLAT link in the top menu bar.
On the BLAT Web page, paste the sequence into the large text box (Figure 18.6.7). Select the genome and assembly to which to map the sequence, and then click the “submit” button. If successful, BLAT will display a list of search results sorted by score (Figure 18.6.8).
-
To view the details of the matching alignments, click the “details” link; to display the sequence in the Genome Browser, click the “browser” link.
This procedure demonstrates one use of the BLAT search tool. This tool, which can be accessed from the BLAT link on the top menu bar of most Genome Browser pages, is a very fast sequence alignment tool similar to BLAST (UNITS 3.3 & 3.4), but optimized for inputs with high similarity, e.g., sequences from the same species. For more information on BLAT, refer to the Genome Browser User’s Guide.
Figure 18.6.7.
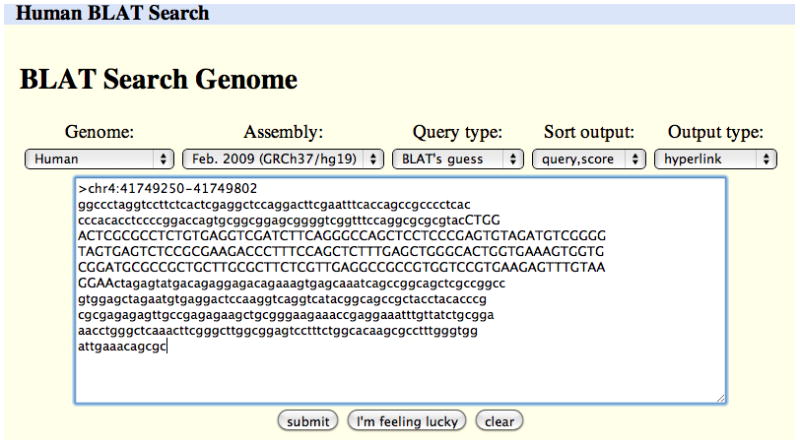
A BLAT search set up to align the FASTA sequence in the text box against the Feb. 2009 (GRCh37/hg19) human genome assembly. This sequence was obtained by copying and pasting the output from the Get DNA search illustrated in Figures 18.6.5 and 18.6.6.
Figure 18.6.8.
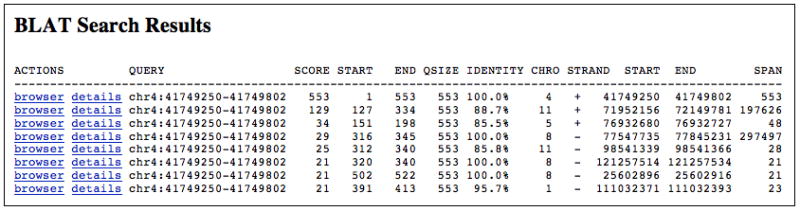
The results returned by the BLAT search shown in Figure 18.6.7. Clicking on the “browser” link for a given line will display the data in the Genome Browser; the “details” link will display a page showing a base-by-base of the alignment to the genome.
SUPPORT PROTOCOL 1 CREATING A CUSTOM ANNOTATION TRACK
Custom annotation tracks enable users to upload personal data for temporary use in the Genome Browser and Table Browser. Custom tracks are viewable only on the machine from which they are uploaded, and by default the data may be accessed only by the users on that machine. Optionally, users can make custom annotations viewable by others through the use of Genome Browser sessions or custom track URLs. Tracks are kept for 48 hr after the last time accessed unless they are saved in a Genome Browser session; no permanent archives are created.
The Genome Browser custom track feature accommodates user-generated data in a wide variety of formats. Smaller datasets may be structured using one of the formats developed during the early years of the Human Genome Project, such as general feature format (GFF), gene transfer format (GTF), pattern space layout (PSL), and browser extensible data (BED), or a format developed for special Browser display purposes, such as wiggle (WIG) and bedGraph formats for continuous-valued data, multiple alignment format (MAF), microarray (BED15) format, and personal genome SNP format for displaying variant base calls from personal genomes relative to the reference genome.
The larger datasets that have become more common with next-generation sequencing and whole-genome analysis usually require a compressed, indexed format to avoid potential performance issues and Internet timeout problems associated with large data file uploads. Formats supported by the Genome Browser include bigBed and bigWig (Kent et al., 2010), which are the indexed binary format versions of the BED and WIG formats, and Binary Alignment/Map format (BAM), the compressed binary version of the Sequence Alignment/Map (SAM) (Li et al., 2009) format used to represent the alignment of next-generation nucleotide sequencing reads to a reference genome.
Support is being added in 2011 for two variation data interchange formats. Variant Call Format (VCF; Danecek et al., 2011) was initially developed for the 1000 Genomes Project (1000 Genomes Project Consortium, 2010) to display SNPs, indels, copy number variations (CNVs) and structural rearrangements. The Genome Browser can display VCF files that have been compressed and indexed using tabix (Li et al., 2011). Genome Variation Format (GVF; Reese et al., 2010) is the format chosen by the Database of Genomic Structural Variation (dbVar; Sayers et al., 2011) to encode hierarchical structural variants. When custom tracks using the indexed binary formats are loaded into the Browser, both the track file and its associated index file remain on the user’s web-accessible server (http, https, or ftp), and only the portions of the files needed to display a particular genomic region are transferred to UCSC where they are temporarily cached.
Typically, custom annotation tracks are displayed under the corresponding genomic positions on the Base Position track. Each custom track has its own track control and persists even when not displayed in the Genome Browser window (e.g., if the position changes to a range that no longer includes the track). Once displayed, a custom track can be moved up or down in the tracks display just like standard Genome Browser tracks.
Custom tracks can be saved for later use through the Genome Browser Session tool, which allows a user to preserve a specific set of Browser track combinations and configuration options. Multiple sessions may be saved for future reference, for comparing different data sets, or for sharing with colleagues. Saved sessions persist for four months after the last access or until deleted.
Since space is limited in the annotation track graphic, many excellent genome-wide tracks must be excluded from the set provided with the Browser. A Web page with links to user-contributed custom tracks can be found by clicking the Custom Tracks link on the home page.
The information in this section provides an overview of the process for creating and displaying custom annotation tracks in the Genome Browser. For a more detailed discussion of formats, syntax, and utilities, refer to the Genome Browser custom annotation track documentation Web page at http://genome.ucsc.edu/goldenPath/help/customTrack.html.
Necessary Resources
Hardware
Unix, Windows, or Macintosh workstation with an Internet connection and a minimum display resolution of 800 × 600 dpi
Software
Text editor (APPENDIX 1C)
An up-to-date Internet browser that supports JavaScript, such as Firefox 3.0 and higher (http://www.mozilla.com/firefox); Internet Explorer 7.0 and higher (http://www.microsoft.com/ie); or Safari 3.0 and higher (http://www.apple.com/safari). The browser must have cookies enabled.
Files
None
Display a small dataset as a custom track
-
1
Format the dataset to be analyzed as a tab-separated file using one of the plain text formats supported by the UCSC Genome Browser: GFF, GTF, PSL, BED, WIG, bedGraph, MAF, BED15 or personal genome SNP.
Each data line in a plain text file provides display and positional information for an item within the displayed annotation track. The Browser ignores empty lines and lines starting with a pound sign (#).Data in PSL, GFF, and GTF files must be tab-delimited rather than space-delimited in order to display correctly. More than one dataset may be included in an annotation file, but all lines within a single annotation track must be in the same format. An easy way to create correctly formatted data for an annotation file is by collecting PSL output from BLAT or downloading data from the Table Browser. Figure 18.6.9 shows examples of data in BED, PSL, and GFF format.For detailed information on custom track data formats, refer to the Genome Browser’s custom annotation track documentation and file format FAQ (http://genome.ucsc.edu/FAQ/FAQformat). -
2
Add one or more optional browser lines to the beginning of the formatted data file to specify the configuration of the Genome Browser window in which the custom annotation track will be displayed.
Browser lines define the genome position to which the Browser will initially open, the width of the display, and the configuration of the other annotation tracks that are shown (or hidden) in the initial display. The Genome Browser custom annotation track documentation describes the browser line syntax and options.In the sample BED annotation track shown in Figure 18.6.9, the initial display position is set to chr22:10000000–10007500, and all tracks are hidden except the custom annotation track. If the browser position is not explicitly set in the annotation file, the initial display will default to the position setting most recently used by the user, which may not be an appropriate position for viewing the annotation track. -
3
Add a track line immediately above the formatted data in the file to define the display attributes for the annotation track.
The track line defines the track’s name, description, colors, initial display mode, associated URL, and other settings. The Genome Browser custom annotation track documentation contains a complete description of the track line syntax and options. If more than one dataset is included in the annotation file, insert a track line at the beginning of each new set of data.In Figure 18.6.9 the left-hand label of the BED annotation track is ‘BED track;’ the center label is ‘BED track example.’ The track labels will be displayed in green and the features will be fully displayed. Because the useScore attribute is set to 1, the level of shading of each feature will reflect its score value. -
4
Upload the annotation file into the Genome Browser by clicking the “add custom tracks” button on the Gateway page (Fig. 18.6.1) or the “add custom tracks” button on the annotation tracks page (Fig. 18.6.2).
If the file is located on your machine, enter the file name in the “upload” text box in the “URLs or data” section. To open an annotation through a URL or to manually enter the track data, type or paste the information into the large text box in this section. Multiple tracks may be uploaded simultaneously by including all the track data or URLs (on separate lines) in the text box or grouping the tracks into one uploaded file. Figure 18.6.10 shows the custom track that displays when the BED sample track in Figure 18.6.9 is uploaded into the Genome Browser. Optionally, associated track descriptive text may be uploaded or inserted in the “optional track documentation” section.To make the annotation file viewable on a different machine or at a different site, put a copy of the file on a Web server and create a custom annotation track URL that allows the file to be uploaded over the Internet. The URL must contain two pieces of information specific to the annotation data file: the UCSC genome assembly on which the annotation is based and the URL of the annotation file on the Web site. The Genome Browser FAQ (http://genome.ucsc.edu/FAQ/FAQreleases#release1) lists the UCSC genome assembly codes. The URL can also include the position within the genome to which the Genome Browser should initially open.For example, placing the BED track in Figure 18.6.9 in a file named test.bed on the genome-test.cse.ucsc.edu Web site enables it to be uploaded using the following custom annotation track URL: http://genome.ucsc.edu/cgi-bin/hgTracks?db=hg19&position=chr22&hgt.customText=http://genome-test.cse.ucsc.edu/test.bed.This URL sets the assembly database to the hg19 (Feb. 2009) assembly of the human genome, initializes the display position to chromosome 22, and loads the annotation track file http://genome-test.cse.ucsc.edu/test.bed. In this case, the position initialization in the URL is extraneous; it will be overwritten by the position defined in the custom track file.
Figure 18.6.9.
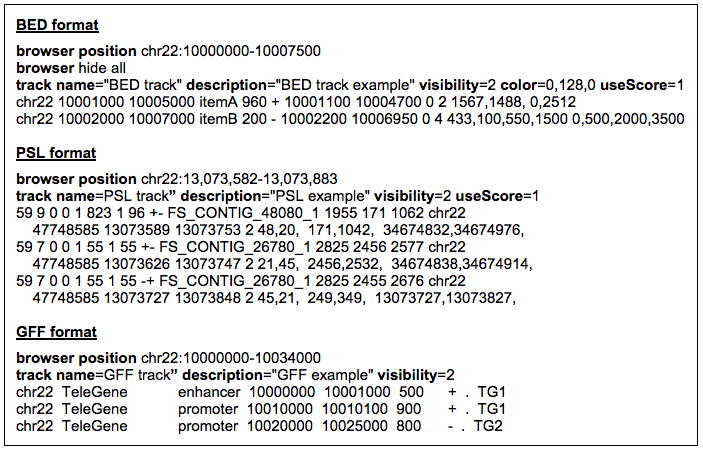
Sample custom annotation tracks containing BED, PSL, and GFF data formats. To load correctly, the track line data in the PSL and GFF examples must be tab-separated. Some of the line breaks shown in the BED and PSL examples are artificial (to make the text fit on the page); browser, track, and data lines may not contain internal line breaks.
Figure 18.6.10.

The annotation track that displays when the BED track example in Figure 18.6.9 is uploaded into the Genome Browser. Note that the lower score value in the ItemB data results in lighter shading of this feature.
Create a compressed, indexed custom track for a very large dataset
-
5
Convert a very large dataset to one of the compressed formats: bigBed, bigWig, BAM, or VCF.
Datasets in BED or WIG format can be converted to bigBed or bigWig format using the Genome Browser bedToBigBed or wigToBigWig utilities. Sequence alignments in SAM format can be converted to BAM format and indexed through the use of SAMtools (http://samtools.sourceforge.net/). Similarly, variant calls in VCF can be compressed and indexed using tabix (http://samtools.sourceforge.net). Consult the Genome Browser help pages on BAM format (http://genome.ucsc.edu/goldenPath/help/bam.html) and VCF (http://genome.ucsc.edu/goldenPath/help/vcf.html) for detailed instructions on using these tools. -
6
Move the converted data file and resulting index file to a Web-accessible http, https, or ftp location.
-
7
Construct a custom track file that defines attributes of the annotation track.
At a minimum, the file must contain a single track line that defines the “track type” attribute and specifies a “bigDataUrl” pointing at the Web location of the compressed data file, for example:track type=bam bigDataUrl=http://myorg.edu/mylab/my.bamSeveral other optional attribute settings may be defined for bigBed, bigWig, BAM, and VCF format custom tracks. Click on the link for the format of interest on the Genome Browser custom track help page (http://genome.ucsc.edu/goldenPath/help/hgTracksHelp.html#CustomTracks) for an in-depth description of the format attributes and examples of their use.One or more optional browser lines may be included before the track line to specify the configuration of the Genome Browser window in which the custom annotation track will be displayed (step 2).Figure 18.6.11 shows a custom track file that was constructed to load a small section of a large dataset from the 1000 Genomes Project. This project consortium, whose aim is to discover, genotype and provide accurate haplotype information on all forms of human DNA polymorphism in multiple human populations, has developed several tools for processing and displaying next-gen sequencing data. The BAM dataset in this example is from the chromosome 21 region of the hg18 human assembly and is available on the website specified by the bigDataUrl attribute. -
8
Load the custom track and display it in the Genome Browser.
Click the “add custom tracks” button on the Gateway page (Fig. 18.6.1) or the “add custom tracks” button on the annotation tracks page (Fig. 18.6.2) to display the custom track management page. Load the file containing the track line and optional browser lines, then click submit to display the track in the Genome Browser (Figure 18.6.12).
Figure 18.6.11.
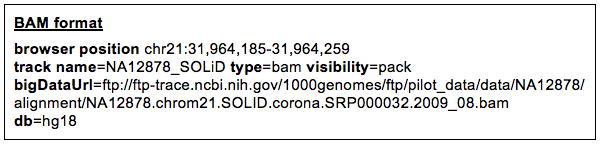
An example of a custom annotation track definition for an indexed BAM file that resides on the NCBI FTP server specified by the bigDataUrl attribute. The line breaks are artificial (to make the text fit on the page). No data lines follow the track definition line because the data are retrieved (as needed) from the remote BAM file named in the bigDataUrl setting. BigWig, BigBed and tabix-indexed VCF custom tracks have a similar structure.
Figure 18.6.12.
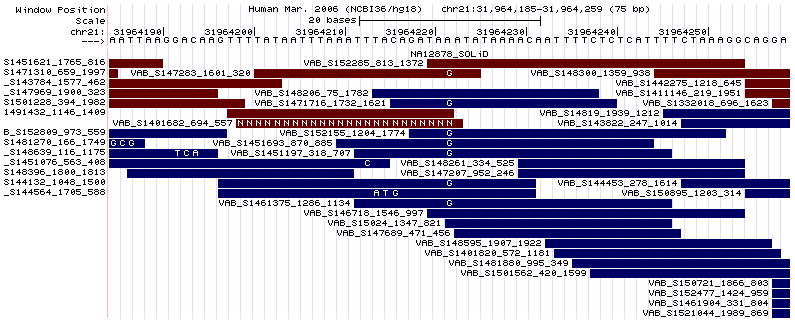
The track display of the uploaded BAM format custom track file shown in Figure 18.6.11.
Create a Genome Browser session
-
9
Create a Genome Browser session that preserves a snapshot of the custom track for future use and for sharing with colleagues.
The Session utility enables the saving and loading of customized views of specific genomic regions with selected tracks displayed, including both standard and custom annotation tracks, which can be shared as text files or URLs, or e-mailed to others (see the “Suggestions for Further Analysis” section for more information).To create a session containing a custom track, load the track into the Genome Browser, then click the Session link in the menu bar. A login to the genomeWiki system is required before a session may be created. Create a named session under the Save Settings section, specify if the session may be viewed by others, then click Submit to add the session to the My Sessions list. The session containing the custom track may then be loaded into the Browser or sent to colleagues. Refer to the Session User’s Guide (http://genome.ucsc.edu/goldenPath/help/hgSessionHelp.html) for more information about creating and using Genome Browser sessions.
SUPPORT PROTOCOL 2 USING THE UCSC TABLE BROWSER
The UCSC Table Browser provides a powerful and flexible graphical interface for querying and manipulating the data in the Genome Browser annotation database.
The Table Browser can be used to: (1) retrieve the annotation data or DNA sequence underlying Genome Browser tracks for the entire genome, a specific coordinate range, or a set of accessions; (2) view a list of the tables affiliated with a particular Genome Browser track; (3) view the schema of an annotation table; (4) organize table data into formats that can be used in other applications, spreadsheets, or databases; (5) combine data from multiple tables or custom tracks into a single set of output data; (6) filter out certain records in a table based on certain field values; (7) display basic statistics calculated over a selected range of table data; and (8) conduct structured or free-form SQL queries on the annotation data.
The information in this section provides an overview of the Table Browser, which can be accessed on the Internet from the UCSC Genome Bioinformatics home page at http://genome.ucsc.edu. For a more detailed discussion of Table Browser options, advanced queries, and several practical examples, refer to the Table Browser User’s Guide at http://genome.ucsc.edu/goldenPath/help/hgTablesHelp.html. For complex queries of Genome Browser data, you may want to use the Galaxy interactive genome analysis tool (http://galaxy.psu.edu/; Goecks et al., 2010).
Necessary Resources
Hardware
Unix, Windows, or Macintosh workstation with an Internet connection and a minimum display resolution of 800 × 600 dpi
Software
An up-to-date Internet browser that supports JavaScript, such as Firefox 3.0 and higher (http://www.mozilla.com/firefox); Internet Explorer 7.0 and higher (http://www.microsoft.com/ie); or Safari 3.0 and higher (http://www.apple.com/safari). The browser must have cookies enabled.
Files
None
Set up a simple Table Browser query
-
1
On the UCSC Genome Bioinformatics home page (Basic Protocol, step 1), click the Table Browser link in the left-hand sidebar menu to display the Table Browser Web page.
The Table Browser is also accessible from the Tables link in the top menu bar of most Genome Browser pages.The top section of the Table Browser Web page (Fig. 18.6.13) contains options for setting up a data query, many of which are optional when conducting simple queries. Each of the options is briefly described at the bottom of the Web page. To view the complete Table Browser User’s Guide, click the Help link in the top menu bar. -
2
Select the clade, genome, and assembly.
The clade, genome, and assembly pull-down menus correspond to those found on the Genome Browser Gateway page. The current Genome Browser settings are used when the Table Browser is started from the menu bar on a Genome Browser page.For this example, set the clade to “Mammal,” the genome to “Human,” and the assembly to “Feb. 2009 (GRCh37/hg19)”. -
3
Select the group, track, and table of interest.
The options in the group and track menus directly correspond to the annotation groups and tracks available in the Genome Browser for the currently selected genome assembly, including currently loaded custom tracks (Support Protocol 1). The track list—which shows all tracks contained in the selected group—automatically updates when a different group is selected.The table menu lists all the tables in the annotation database that are affiliated with the selected track. Many annotation tracks are based on data from multiple tables joined by common fields. By default, the primary table underlying the track’s display in the Genome Browser is listed first.Click the “describe table schema” button to view the SQL schema for the selected table. The schema page also lists other tables in the annotation database that are joined to the selected table by a particular field, as well as a description of the Genome Browser annotation track associated with the table (when applicable).The All Tracks and All Tables options in the group menu provide convenient shortcuts if the name of the desired track or table is already known.For this example, a subset of data in the UCSC Genes track will be examined. Select the “Genes and Gene Prediction Tracks” group, the “UCSC Genes” track, and the “knownGene” (default) table. -
4
Specify the query region.
Click the “genome” region setting to view annotation data for the entire genome. To limit the data output to a specific query region, click the “position” region setting and type a query into the adjacent text box. The Table Browser accepts the same types of queries that are valid for the Genome Browser (see Basic Protocol, step 3). Click the “lookup” button to convert a nonpositional query (e.g., an accession or keyword) to a coordinate range.On the hg17 and hg18 genome assemblies, which have annotations specific to the ENCODE pilot project, an additional “ENCODE Pilot regions” setting is available that restricts output to data located in the 44 ENCODE Pilot regions. There is no need to use this setting for the genome-wide production phase ENCODE data found on hg18 and later assemblies.For many tables, the query region can be further defined by restricting the output to a set of specific identifiers, such as UCSC Gene IDs, mRNA accession numbers, or dbSNP IDs. Upload the identifiers as a space- or line-separated list by clicking the “paste list” or “upload list” button. For this type of query to return successfully, the identifiers in the list must conform to the format specified for identifiers in the selected table.For this example, several UCSC Gene identifiers from chromosome 7 are included in the query. Select the “position” region setting, then type chr7 in the text box. Click the “paste list” button, and then type the following items in the large text box, one per line: NM_014390, NM_022143, D49487, NM_018077. -
5
Select an output format.
The help text at the bottom of the Table Browser page describes the output formats. Not all options may be available for a given query. The “all fields…” format displays the entire set of fields for each record in the output. The “selected fields…” format is useful when the user wishes to create output that contains only a subset of fields that will be used as input for further data processing or if the user desires to link in fields from an associated table (step 7). The “sequence” option returns the sequence underlying the annotation in FASTA format. The GTF, BED, and custom track options are useful for saving the output into a format that can be displayed as a custom track in the Genome Browser. The “data points” format, which is available only for “wiggle” and Conservation tracks, is useful for displaying the conservation scores associated with individual base locations; in contrast, the Conservation track’s “MAF” format displays the multiple species alignments underlying the conservation scores. To display a set of search results in the Galaxy genome analysis tool, check the “Send output to Galaxy” box.For this example, choose the “selected fields…” output format. -
6
Click the “get output” button to submit the query and display the results.
By default, the Table Browser displays the query output in the user’s Web browser. To save the data to a file on the local computer, type a file name in the “output file” text box, and select the plain or compressed file type option before clicking the “get output” button.Many output formats—including the “selected fields…” format used in the example—require an additional setup step before the output is displayed. On the setup page associated with our example, check the “name,” “chrom,” txStart,” and “txEnd” boxes in the section labeled “Select Fields from hg19.knownGene”, and then click the “get output” button. The Table Browser will display the output shown in Figure 18.6.14. -
7
Link in additional data from tables associated with the table being queried.
The linked tables feature included on the “selected fields…” output format setup page provides a convenient way to pull in data from additional tables without having to conduct multiple queries.It is easy to expand the query outlined in the previous step to display additional data associated with the selected genes by linking in the associated tables. The kgXref table, linked by default when the UCSC Genes track is selected, provides a convenient cross-reference among gene IDs and information from several different sources such as RefSeq, Swiss-Prot, HGNC, etc.For this example, return to the field selection setup page in Step 6. At the top of the page, check the “name,” “chrom,” txStart,” and “txEnd” boxes in the hg19.knownGene section as before. Move down to the hg19.kgXref section and check the “geneSymbol” and “refseq” fields to add this information to the output. Scroll down to the Linked Tables section; check the box on the “hg19 kgAlias” and then click the “Allow selection from checked tables” button at the bottom of the page to open the query to information in the kgAlias table. The Table Browser will redisplay the page with the hg19.kgAlias table added. Check the “alias” field in the hg19.kgAlias section, then click the “get output” button. The Table Browser will display a comma-separated list of aliases, followed by the HGNC gene symbol and the RefSeq accession associated with each UCSC Genes record in the output shown in step 6. -
8
Click the “summary/statistics” button to display a table of basic statistics about the current query.
The Summary Statistics page profiles data and query characteristics. This information can be useful in determining such information as the percent of bases in a query region that is covered by items returned from the query (or by their exons, if applicable).
Figure 18.6.13.
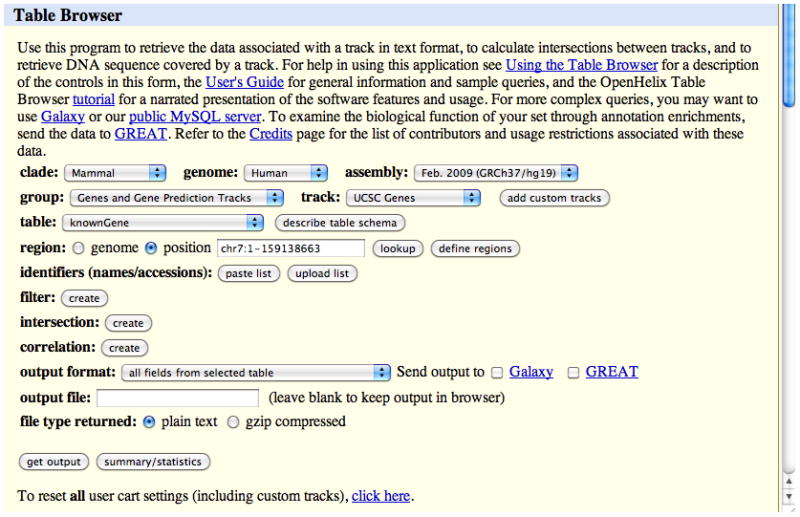
The Table Browser tool provides access to the database tables underlying the Genome Browser annotations; in this case, the chromosome 7 data in the knownGene table on the Feb. 2009 human genome assembly (GRCh37/hg19).
Figure 18.6.14.
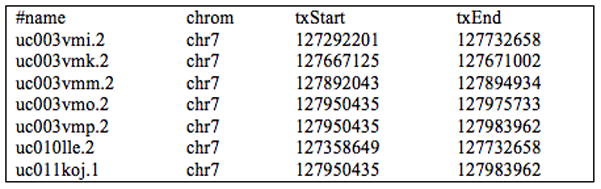
Output from the Table Browser query described in Support Protocol 2, steps 4–6, showing regions of chromosome 7 in the Feb. 2009 (GrCh37/hg19) human genome assembly associated with the identifiers NM_014390, NM_022143, D49487, and NM_018077.
Explore advanced query options
-
9
Create a custom track from a subset of table data using the “custom track” output format option.
The custom track output format allows the user to save query results into a custom annotation file that can be loaded into the Table Browser for further data manipulation or uploaded for display in the Genome Browser.For this example, repeat steps 1 to 3. Select the “genome” region setting. If you have not reset your session since trying the previous examples, click the “clear list” button. Select the “custom track” output format option, then click “get output.” On the custom track setup page, configure the header of the custom track (optional). Select the “Coding exons” option, and then click the “get custom track in table browser” button. The track is now loaded into the Table Browser. The data in the track can now be viewed and manipulated by selecting the “Custom Tracks” group option and setting the track list to the name of the user’s custom track. -
10
Click the filter “create” button to set up a filter on one or more fields in a data table.
The filter utility allows the user to fine-tune a query to produce a restricted dataset that meets a certain set of criteria, such as a minimum threshold or a specific set of IDs or keywords.For this example, set the clade, genome, and assembly as described in the example in step 2. Select the “Comparative Genomics” group, the “Conservation” track, and the “phyloPNwayGroup” table (where N represents the number of species present in the multiple alignment, and Group is a subset of species with a name like “Primate” or “Mammal,” such as phyloP44WayPrimate). Set the position to chr7. On the filter page, set dataValue >0.98, then click the “submit” button. Select the “data points” format, and then click “get output.”This query will return the first 100,000 bases in the Conservation track that are associated with the peaks where the multiple species conservation score exceeds 0.98 (i.e., regions with a high amount of evolutionary conservation). By default, the number of output data points from wiggle data is limited to 100,000. You can increase this limit on the filter page. To find out how many data points would be returned from the query without any limit, click the summary/statistics button. -
11
Click the intersection “create” button to combine the data from two different tables into a single output file using an intersection or union.
The intersection feature lets the user compare the positions of features in different annotations to identify points of overlap or nonoverlap, establish thresholds for the amount of overlap, and conduct feature-by-feature or base-wise comparisons.In this example, select the “Variation and Repeats” option in the group menu and “Simple Repeats” from the track menu. Select the “genome” region setting. Click the intersection “create” button. On the intersection setup page, select the “Custom Tracks” group option, and then set the track menu to the track created in step 9. Select “All Simple Repeats records that have at least [80%] overlap with tb_knownGene,” change “80%” to “100%,” and click “submit.” Back on the main Table Browser page, select the “hyperlinks” output format, and then click “get output.” The Table Browser will return a list of links to view simple repeats completely overlapped by coding exons of UCSC Genes in the Genome Browser.Note that the “all fields…” and “selected fields…” output format options are not available when an intersection is active in the current query. Although the intersection utility restricts combinations to two tables, additional tables can be included in an intersection by saving the initial intersection to a custom track, then performing subsequent intersections using the custom track.
GUIDELINES FOR UNDERSTANDING RESULTS
The Genome Browser can be used for genome analysis and interpretation at many different levels. With the annotation track image zoomed out to display several million bases or an entire chromosome, the tool provides a good overview of the coverage and completeness of the region. At a reduced display scale, the Genome Browser is useful for viewing splicing patterns or searching for evidence of previously unidentified genes. By presenting a large collection of annotation tracks in a single view, the Browser facilitates interpretations based on a visual correlation of features. However, care must be taken when drawing conclusions. Information presented in the Genome Browser is only as accurate as the underlying data. It is essential to gather supporting evidence when making an analysis, rather than basing judgments on a single track that may contain erroneous or misleading data.
It is important to consider the methods and criteria used to compute an annotation track. Consult the track’s description page (Basic Protocol, step 10) for a discussion of the sources and methods used to generate the track. In many cases, the page will provide links to additional information about the annotation (such as a seminal publication or related Web site), estimates of accuracy, and caveats for use.
The feature details pages (Basic Protocol, step 11) are another good source for supporting documentation. Many pages contain links to feature-specific information in external public databases. The OMIM database (UNIT 1.2), for example, contains hand-curated experimental literature summaries. Entrez, GeneLynx, GeneCards, AceView, and PubMed (UNIT 1.3) are other good sources for supplementary information.
Many regions–particularly in unfinished areas of a genome–may exhibit discrepancies among the various gene prediction tracks, EST evidence, and cross-species orthology tracks. Tracks generated by gene prediction methods vary considerably in their degrees of sensitivity and specificity. Kent (2002) illustrated some of these differences in a comparison of the correlation of EST, cross-species homology, and ab initio gene prediction tracks with the RefSeq Genes track across the entire genome, along with a similar comparison to annotations in other gene prediction tracks. It is better to use correlations among EST, cross-species homologies, and ab initio gene predictions to look for evidence of unidentified genes, rather than relying on the information in a single annotation track.
ESTs often exhibit sequencing errors due to the nature of the techniques used. EST databases contain contamination from mRNA and genomic sequence. Because of this, a single unspliced EST should be viewed with considerable skepticism, and alternate splicing predictions should be evaluated by examining the quality of the EST/genomic alignment. Cross-species BLAT alignments that match too perfectly may also be suspect. Those with >97% identity may simply reflect the contamination of one genome by the other.
In several of the annotation tracks generated at UCSC, attempts have been made to filter out data that might provide misleading results. For example, the mRNA and EST alignments on which several of the Browser tracks are based are filtered to reduce the presence of pseudogenes, paralogs, and assembly errors. Filtering removes a significant number of alignments in the tracks, particularly very short ones. The Spliced EST track applies additional splicing criteria that greatly reduce the level of contamination from EST databases, although at the expense of eliminating genuine ESTs. Since the maximum intron length allowed by BLAT is 500,000 bases, some ESTs with very long introns are eliminated that otherwise might align.
Conclusions drawn from data containing phenotype and disease association tracks (such as GAD View, DECIPHER, and OMIM) should be made with care. These datasets are intended for use primarily by medical scientists and other professionals concerned with genetic disorders, by genetics researchers, and by advanced students in science and medicine, and should not be used for casual diagnosis of a medical or genetic condition. The data in these tracks do not undergo additional curation or interpretation by UCSC.
In summary, good judgment should be used when using any genome-browsing tool. To work effectively in a bioinformatics area subject to errors, it is a good idea to seek supporting data for any unusual findings. Often, the ultimate supporting evidence for a conclusion must be generated in the laboratory.
For a general discussion of the advantages and potential pitfalls of genomic data analysis using genome browsers, see Cline and Kent (2009).
COMMENTARY
Background Information
History and development of the UCSC Genome Browser
The need for interactive software to search and display a genome at a variety of levels predates the inception of the UCSC Genome Browser. Research on the nematode C. elegans in the mid-1990s prompted the creation of A Caenorhabditis elegans Database (ACeDB; Eeckman and Durbin, 1995; UNIT 9.1) to track strains and genetic crosses. As ACeDB grew in functionality, the software was adopted by the C. elegans community, and over the years has been enhanced and extended to support a large number of organisms.
The UCSC Genome Browser was originally developed as an alternative to ACeDB to examine RNA splicing for gene predictions in C. elegans (Kent and Zahler, 2000a). This set of Web-based tools—initially called the Intronerator—displayed EST and full-length cDNA tracks from GenBank aligned to the C. elegans genomic sequence. The Intronerator was subsequently expanded to include tracks showing homology with C. briggsae (Kent and Zahler, 2000b). With the completion of the assembled human genome working draft on the horizon, the software underwent major revisions to accommodate the human genome assembly, which was 30× larger than that of C. elegans. The resulting UCSC Genome Browser retained the speed and performance of its predecessor while displaying the vastly larger datasets of vertebrate genomes. The initial mouse (Mus musculus) draft assembly (Waterston et al., 2002) was added to the Genome Browser in 2002, and the Browser has subsequently grown to include a large array of genomes and annotation data. In mid 2011, this included multiple assemblies of 53 species, primarily mammals (19 species) and other vertebrates (10 species), as well as selected insects, nematodes, deuterostomes, and yeast. Older assemblies are archived as newer versions are released; the UCSC Web site maintains complete assembly archives of the more popular genomes.
In the years since its public debut, the Genome Browser has become a vital scientific resource for the biomedical research community. The application set has grown to include several tools that analyze different aspects of the data: the BLAT alignment tool, Table Browser, Gene Sorter, Proteome Browser, VisiGene, in silico PCR tool, Genome Graphs, and Sessions. The Browser integrates data from hundreds of high-throughput scientific experiments; provides convenient access to the sequence and annotations associated with genetic loci; displays multiple alignments, conservation graphs, and other comparative genomics results based on dozens of vertebrate genomes; and offers a display platform where researchers can view the results of their own experiments alongside published annotations. The Browser is an essential complement to the primary genomics and biomedical data repositories: it integrates the data from multiple high-throughput sources to provide an informative view of any gene in the genome, including those that have not been the focus of scientific papers. By displaying a wide range of information useful to understanding the basic biology relevant to any base in the genome, the Genome Browser plays a fundamental role in the biomedical community’s efforts to understand the significance of human genetic variation and its relation to human disease and phenotype.
Of the alternative existing tools that provide a somewhat similar functionality to the Genome Browser, the Ensembl Genome Browser (http://www.ensembl.org/; UNIT 1.15) and the National Center for Biotechnology Information (NCBI) Entrez Map Viewer (http://www.ncbi.nlm.nih.gov/mapview/; UNIT 1.5) are perhaps the most widely known. The UCSC Browser provides links to both of these tools from the menu bar at the top of the annotation tracks page.
To facilitate the accessibility and display of the massive amounts of data resulting from next-gen sequencing and analysis, a new distributed data model called “track data hubs” will be available through the Genome Browser in late 2011, greatly expanding the Browser’s ability to showcase the work of external labs. The datasets underlying a track hub are formatted in one of the compressed, indexed formats supported by the Genome Browser (such as bigWig, bigBed, BAM, or VCF) and reside remotely from UCSC on the contributor’s server; only the portions needed for display in a user’s current Genome Browser view are transferred to the UCSC server. Data hub annotations can be organized into tracks and subtracks, and incorporate standard Browser track display options. The track data hub functionality will enable labs and research consortia to make large datasets available in the Genome Browser without the overhead entailed by full integration.
What types of annotation data are available?
The data sources integrated into the Genome Browser include human-curated and computed gene sets, data from high-throughput sequencing platforms, microarray-based expression data, in-situ imagery, chromatin immunoprecipitation, DNAse hypersensitivity assays, human and animal polymorphism data, the results of human gene association studies, model organism QTL studies, and a variety of data derived from comparative genomics. The Genome Browser annotation track set is constantly evolving as more comprehensive and accurate versions of these data are released, and new graphical display types are added as needed to accommodate the display demands of the increasingly large and complex datasets.
The Genome Browser annotation tracks are grouped by functionality into several categories: mapping and sequencing, phenotype and disease associations, genes and gene predictions, variations and repeats, mRNA and EST data, expression, regulation, comparative genomics, and (on selected human and chimpanzee Browsers) Neanderthal analysis data. The Browser offers a broad selection of annotations in each of these categories for the more highly studied genomes, such as the human and mouse; other assemblies feature only a subset of these annotations. Data generated by the ENCODE Project’s early pilot phase that targeted 1% of the human genome (2003–2007) are grouped separately in the hg16, hg17, and hg18 human Browsers. Data from the project’s genome-wide production phase is fully integrated into the general track groupings and denoted in the track label by a double helix icon.
This section highlights some of the tracks featured on the latest human genome assemblies. For an in-depth description of the tracks, see Kent et al. (2002), the Genome Browser updates in the annual Nucleic Acid Research database issue (e.g., Fujita et al., 2011), and the individual track description pages.
Gene prediction tracks within the UCSC Genome Browser vary in the evidence used for genes they report, their coverage of bases in known coding regions, and their specificity. The UCSC Genes track is generated by an automated process that combines evidence from RefSeq, GenBank (UNIT 1.3; APPENDIX 1B), the Consensus CDS (CCDS) Project (Pruitt et al., 2009), and UniProt. This is a moderately conservative set of predictions, requiring the support of one GenBank RNA sequence plus at least one additional line of evidence, with the exception of the RefSeq RNAs, which require no additional evidence. The track includes both protein-coding and putative noncoding transcripts. The UCSC Genes annotation is based on the earlier Known Genes track (Hsu et al., 2006), which was updated in 2005 to increase the quality and coverage through more stringent filtering and the inclusion of more supporting evidence (refer to the UCSC Genes description page for more details). Other gene prediction tracks of note include the RefSeq Genes track, based on human RefSeq mRNAs in GenBank that have been aligned against the genome with BLAT and stringently filtered; the CCDS Genes track, which shows a high-quality, consistently annotated core set of human protein-coding genes obtained from the CCDS project and identified by consensus among the Ensembl, Vega (Wilming et al., 2008), and RefSeq gene annotation sets; and the GENCODE Genes track, showing high-quality manual annotations merged with evidence-based automated annotations generated by the GENCODE Project Consortium (Harrow et al., 2006).
The Browser displays several tracks based on mRNA alignments. The mRNA and EST sequences are extracted from databases in GenBank, and are aligned against the genome using the BLAT search tool (see Basic Protocol). The set of alignments undergoes several filtering steps (detailed on the individual track description pages) prior to its presentation in the Genome Browser. As mentioned in the Guidelines for Understanding Results section, these filtering methods reduce the occurrence of misleading and erroneous data in the tracks at the expense of eliminating some genuine data. The mRNA data in the Genome Browser are incrementally updated from GenBank nightly; EST data are updated weekly.
To augment the Genome Browser’s role as an analytical tool in the study of human genetic variation and disease, the Phenotype and Disease Associations track group incorporates extensive annotations from several external databases. The Online Mendelian Inheritance in Man dataset (OMIM; UNIT 1.2) has been divided into three separate track views to facilitate study: OMIM Allelic Variant SNPs, which shows allelic variants that have been associated with dbSNP identifiers; OMIM Genes, which shows the genomic positions of gene entries colored to indicate the associated OMIM phenotype class; and OMIM Phenotypes Loci, which shows the cytogenic locations of phenotype entries for which the causative gene is unknown, as well as multi-gene syndromes. The GAD View track shows data from the Genetic Association Database (GAD; Becker et al., 2004), an archive of human genetic association studies of complex diseases and disorders that allows the rapid identification of medically relevant polymorphism from the large volume of polymorphism and mutational data. The DECIPHER track shows the genomic regions of reported clinical cases and associated phenotype information from the DECIPHER (Firth et al., 2009) database of submicroscopic chromosomal imbalance, which collects clinical information about chromosomal microdeletions, duplications and insertions; translocations; and inversions. This track group also features a track displaying SNPs identified by published GWAS data collected in the NHGRI Catalog of Published Genome-Wide Association Studies (www.genome.gov/gwastudies; Hindorff et al., 2009). Several Quantitative Trait Loci (QTLs) tracks are available on selected human Browsers: Human QTLs collected by the Rat Genome Database (RGD; Dwinell et al., 2009), as well as Rat QTLs from RGD and Mouse QTLs from Mouse Genome Informatics (Blake et al., 2011) that are mapped to the human assembly using whole-genome alignments. The cross-species mappings of QTLs are extremely coarse and should be critically evaluated using the cross-species Net tracks and other relevant data.
Complementing the Phenotype and Disease Associations group, the Variation and Repeats track group provides a variety of annotations of polymorphisms, measures of selection and population variance, probe locations of common assay platforms and repetitive sequences for genetics-based exploration of the genome. The group prominently features several tracks derived from dbSNP data (Sayers et al., 2011). The Common SNPs track shows uniquely mapped variants with a known minor allele frequency of at least 1% of the population, with the goal of identifying variants that appear to be reasonably common in the general population and thus providing a filter for identifying potentially causative SNPs in individual genome samples. The Flagged SNPs track contains uniquely mapped variants, excluding Common SNPs, that have been deposited by locus-specific databases or referenced in OMIM and are flagged by dbSNP as “clinically associated”. The Mult. (multiply mapped) SNPs track identifies variants that have been mapped to more than one genomic location, flagging sites that may not exhibit true variation, but merely strong similarity to the variant. The Genome Browser also provides orthologous alleles from chimp, orangutan and macaque genome assemblies, and human genome sequence masked with ambiguous base characters for uniquely mapped SNPs. The SNP data are also available in bulk to facilitate user-driven filtering.
The Variation and Repeats group features many other tracks in addition to the dbSNP-based tracks. The HapMap track displays genotype counts and allele frequencies of millions of SNPs in individuals from several worldwide populations assayed in multiple phases by the International HapMap Project (HapMap; The International HapMap Consortium, 2003; 2005; 2010). The Human Genome Diversity Project (HGDP, http://www.stanford.edu/group/morrinst/hgdp.html) track displays millions of SNPs genotyped in 53 populations worldwide with allele frequencies plotted on a world map. The Genome Variants track contains single nucleotide differences from several published personal genome sequences. The Database of Genomic Variants (DGV) track shows CNVs, indels, inversions and inversion breakpoints from a curated collection of published structural variations. The Personal Variants track displays variant calls from several personal genomes that have been made publicly available, including data from the 1000 Genome Project. The Segmental Dups track shows reference genome regions of at least 1000 bases that have at least a 90% similarity to other regions. Probe mappings from several commonly used SNP assaying platforms are shown in the SNP Arrays track. On the hg18 human genome assembly (Mar. 2006, NCBI36), the HapMap LD Phased track shows linkage disequilibrium (LD) scores computed from HapMap genotypes that have been phased. Other measures of population variance on the hg18 assembly include Tajima’s D and several per-continent measures from HGDP: FST, Heterozygosity, iHS, and XP-EHH. Repetitive sequences are annotated in the RepeatMasker (Smit, 1999), Interrupted Repeats, Simple Repeats (Benson, 1999), Microsatellite, and Self Chain tracks on all recent human assemblies.
The Genome Browser provides a wealth of comparative genomics annotations. In addition to the cross-species homology mRNA and EST tracks found in the mRNA and EST group, the Comparative Genomics group contains a wide variety of pairwise chain and net alignment tracks (Kent et al., 2003; Schwartz et al., 2003) that can be used to look for orthologous regions between organisms, large-scale rearrangements, duplications and deletions, and processed pseudogenes. The chain tracks can also be used to identify paralogs. The Conservation track is based on multi-species alignments generated by Multiz (Blanchette et al., 2004) from a set of pairwise net alignments. Pairwise net alignments from a subset of the species are displayed in a condensed form. Above the alignments is a graph of estimated basewise probability of evolutionary conservation computed on the alignments by the phyloP and phastCons programs using a phylogenetic hidden Markov model. This track is highly customizable, allowing the user to adjust the display to the species of interest and vary several of the graph characteristics. The Most Conserved subtrack provides an alternative simplified view of the Conservation track that highlights the parts of the genome that are most likely conserved by purifying selection.
Regulation is a rapidly growing area of genomic analysis, supported in part by the genome-wide scale-up of the ENCODE project. The Regulation track group in the Genome Browser contains a variety of annotations relevant to transcription regulation, including transcription factor binding sites; transcription start sites; transcription levels; transcription enhancers, promoters and silencers; microRNA regulatory target sites; evidence of open chromatin and more. The integrated ENCODE Regulation “super-track” aggregates several individual complementary tracks into one setting: a Transcription track showing transcription levels assayed by sequencing polyadenylated RNA from a variety of cell types; Layered H3K4Me1 and Layered H3K27Ac tracks showing instances where the modification of histone proteins is suggestive of enhancer and possibly other regulatory activity; a Layered H3K4Me3 track showing a histone mark associated with promoters; a DNase Clusters track showing regions where the chromatin is hypersensitive to cutting by the DNase enzyme, indicating possible regulatory regions and promoter regions; and a Transcription Factor ChIP track showing DNA binding regions for transcription factors, which are proteins responsible for modulating gene transcription. The ENCODE Regulation super-track uses a transparent overlay display method that allows several cell lines to be superimposed in a single track.
The Expression track group features tracks showing expression data from the GNF Gene Expression Atlas 2 (Su et al., 2004), the location of consensus and exemplar sequences used for probe selection for several Affymetrix and Illumina chips, the genomic locations of probes from the Affymetrix Exon array, transcription of different RNA extracts from different sub-cellular localizations in different cell lines, RNA sequencing (RNAseq) data, Allen Brain Atlas Probes (Lein et al., 2007) and Sestan Lab Brain Atlas microarray expression data.
Several high-level map tracks are included in the Mapping and Sequencing tracks section: FISH clones, which shows the locations of FISH-mapped BAC clones from the BAC Resource Consortium (Cheung et al., 2001) along the draft assembly sequence; the Chromosome Bands, which uses the locations of FISH-mapped clones on the cytogenetic map and the assembly to approximate the Giemsa-stained chromosome bands at an 800-band resolution; the Sequence-Tagged Site (STS) Markers track, which displays the positions of markers used in constructing several genetic, radiation hybridization (RH), and yeast artificial chromosome (YAC) maps, as well as markers from the UniSTS database; and the BAC End and Fosmid End Pairs tracks, which show mappings of paired BAC and fosmid end reads.
The UCSC Genome Bioinformatics Group hosts a portal for accessing sequence data and alignments produced by the Neandertal Genome Analysis Consortium. Several annotation based on the Neandertal data are available in the Neandertal Assembly and Analysis track group on later human genome assemblies. In addition to a track showing Neandertal sequence reads and mitochondrial sequence mapped to the human reference assembly (also available on the chimpanzee genome), this group includes a track showing Neandertal alleles for human-chimp protein-coding differences on the human lineage using orangutan as the outgroup to determine which allele is more likely to be ancestral, several annotations based on selective sweep scan (S score) of Neandertal vs. human polymorphisms, a track showing candidate regions for gene flow from Neandertal to non-African modern humans, and a track showing Neandertal consensus contigs called from overlapping, non-redundant reads that passed mapping and base quality criteria.
Critical Parameters and Troubleshooting
Use caution when interpreting the information displayed in the UCSC Genome Browser, particularly if the chromosomal region under scrutiny is incompletely assembled. The Genome Browser annotation tracks are generated from publicly available data, and therefore are only as accurate as the data on which they are based. Assembly errors and sequence gaps may occur well into the genome sequencing process due to regions that are intrinsically difficult to sequence, and incorrect data may be propagated into the public databases. The Browser cannot fill in sequencing gaps or correctly assign strand information in the absence of good coverage data. Artifactual duplications arise as unavoidable compromises during a genome assembly build, causing misleading matches in genome coordinates found by alignment.
A common source of confusion among users is the positional differences that result when genome assembly versions are interchanged. New genome versions are added to the UCSC Genome Browser on a regular basis. Unless a feature lies on a completely sequenced and unrevised chromosome, its coordinates are likely to change between one assembly and the next. Often the position of a genomic feature cited in the literature will not coincide with the location displayed in the Browser. When faced with such a discrepancy, compare the assembly date of the genome in the reference with that of the genome displayed in the Browser. In most cases, the newer assembly will have the most accurate information. When feasible, it is usually best to work with the most current assembly, even if it lacks a complete set of annotation tracks. Two procedures are described (see Basic Protocol, steps 15, 16, and 17) that can be used to map the position of genomic sequence in one assembly version to that of a newer version.
Aligned sequences can be incomplete, especially in untranslated (UTR) regions; variation in UTR lengths might not indicate transcript variation. Conclusions about the data should never be made based on the information available in a single track. Instead, gather supporting evidence and identify problematic areas from other tracks aligned to the same region and ideally generated by independent methods. Cross-check information in the public databases such as Entrez Gene and OMIM (UNIT 1.2).
Gene prediction tracks are based on different standards of experimental evidence, and it is sometimes unclear whether an unusual feature indicates a transcript or simply an error. Curated tracks based on specific full-length transcripts, such as RefSeq, tend to have higher accuracy, but lower genomic coverage. Tracks generated from the analysis of mRNA, EST, and protein sequence alignment, such as the UCSC Genes track, also have fairly high confidence levels.
UCSC makes a concerted effort to provide uninterrupted Browser and BLAT service to the research community. In the event of the occasional power or equipment failure, there are multiple mirror sites that replicate the UCSC Genome Browser environment. To view a list of actively maintained mirror sites, click the Mirrors link on the UCSC Genome Bioinformatics home page.
Troubleshooting custom annotation track problems
Custom annotation track display problems usually stem from syntax or formatting errors in the annotation track file. A spurious line break in one of the browser, track, or data lines is a frequent source of errors. Another common cause of problems is data separated by spaces rather than tabs. Custom tracks based on very large datasets may exceed the Internet connection or Internet browser bandwidth during the upload process. These datasets should be displayed using one of the supported compressed formats to avoid these problems. Refer to the troubleshooting section in the Custom Annotation Track section of the User’s Guide (http://genome.ucsc.edu/goldenPath/help/customTrack.html) for more information.
Suggestions for Further Analysis
The UCSC Genome Bioinformatics home page offers links to several tools that facilitate analysis of the genomic and annotation data underlying the Browser’s graphical presentation. The Table Browser and BLAT tools were introduced in the main part of the unit (see Basic Protocol). The BLAT tool can be used for a large number of functions, such as finding the genomic coordinates of an mRNA or protein in an assembly, determining the exon structure of a gene, displaying a coding region within a full-length gene, searching for gene family members, or finding homologs of a query from another species. The output of a BLAT or Table Browser search can be saved in a custom track format for direct upload into the Browser, or can be downloaded into a spreadsheet or text editor (APPENDIX 1C) for further manipulation.
The Gene Sorter
The Gene Sorter is accessible from the top menu bar on most of the Browser Web pages. It provides a simple interface for studying the relationship among a group of genes based on protein-level homology, the similarity of gene expression profiles, genomic proximity, or other parameters, which in turn facilitates the study of the evolution of genes and their functions. This tool can be used to gather a collection of genes that share similar properties for statistical analysis or to filter a large group of genes into a small subset of interesting features, based on specific properties.
The VisiGene image browser
The VisiGene image browser is available from a link on the Genome Bioinformatics Group home page. It can be used to browse images from in situ RNA hybridization, reporter genes, and other techniques that show where a gene, enhancer, or promoter is active in an organism. In 2011, the VisiGene image database contained nearly 100,000 images from several high-throughput gene projects, as well as images from literature curated by the model organism databases.
The Proteome Browser
The Proteome Browser can be accessed from the home page or Genome Browser UCSC Genes track details pages for selected assemblies. It provides a large variety of information about individual protein characteristics such as polarity, hydrophobicity, amino acid anomalies, domains, exons, and much more, displayed as a series of tracks and histograms. This browser is tightly integrated with the UCSC Genes track and it in turn links to several external databases and Web sites containing related information.
The in silico PCR utility
The in silico PCR utility is available from the menu bar on most of the Genome Browser Web pages. It provides a means to quickly search genomic sequences or (on human and mouse assemblies) transcribed sequences with a pair of PCR primers, returning a FASTA output file that contains all sequence in the database that lie between and include the primer pair.
Genome Graphs
The Genome Graphs utility, which is available from a link on the left sidebar of the home page, displays data plotted along all chromosomes in a single image. This tool is particularly well suited for linkage and association study analysis. Users can upload their own data (such as GWAS results) using a very simple text format or import Genome Browser tracks that will be condensed into density plots. The display is configurable. Clicking on a region in the image leads to a Genome Browser view of that region. Other functions provided include finding the correlation (Pearson’s R) coefficient of two tracks, browsing regions that have scores above a given threshold, and jumping to the Gene Sorter with a list of genes in regions scoring above the threshold. For an example of Genome Graphs usage see Wang and Furey (2009), which describes a step-by-step method for using the Genome Graphs tool to prioritize a small number of meaningful candidate genes from a large number of genes within regions of disease association in a large-scale association study.
Genome Browser Sessions
The Session utility is available from the menu bar on most of the Genome Browser Web pages. It enables the saving, loading, and sharing of user session information (i.e., all configuration choices, track visibility changes, filter settings, etc.) that have been set by the user since the session was last reset or loaded. Through the use of Genome Browser sessions, the user can save or load highly tailored views of specific genomic regions with selected tracks enabled, which can be shared as text files or URLs, or e-mailed to colleagues. Use of many of the session management features requires a valid login at genomewiki.ucsc.edu (see below). UCSC makes its best attempt to preserve sessions stored on the UCSC server, but users are advised to back up their sessions locally, especially any custom track data that may be deleted if they have not been accessed in 48 hr. Support Protocol 1 (step 9) describes how to preserve a user-generated custom annotation track in a session.
The UCSC Cancer Genomics Browser
The UCSC Cancer Genomics Browser (https://genome-cancer.ucsc.edu; Zhu et al., 2009; Sanborn et al., 2011) is a set of web-based tools for the integration, visualization and analysis of cancer genomics and clinical data. The Browser, which displays whole-genome views of genome-wide experimental measurements for multiple samples alongside associated clinical information, hosts a growing body of publicly available cancer genomics data from a variety of cancer types, including data generated from the Cancer Genome Atlas (TCGA) project. The Cancer Genomics Browser is integrated with the UCSC Genome Browser, and thus inherits the Genome Browser’s rich set of human biology and genetics data for enhanced interpretation of the cancer genomics data.
genomewiki.ucsc.edu
The Web site genomewiki.ucsc.edu is a user-editable forum for sharing information about the Genome Browser and associated tools and data. Both the Genome Browser staff and users have contributed technical articles and how-to examples. Registration is not required to search and view the contents, but users are encouraged to register so that they can edit and add content, and use the UCSC storage feature of the Sessions utility described above.
Additional resources for Genome Browser information
In addition to the analytical tools available through the Genome Browser, the track description and details pages provide links to many external resources that present a wealth of related information. For a demonstration of the use of the Genome Browser in comparative genomics analysis, see Bejerano et al. (2005). For a general primer on using genome browsers for data analysis, see Cline and Kent (2009).
Three active mailing lists provide sources for Genome Browser information. The genome@soe.ucsc.edu mailing list provides a moderated discussion forum about the Genome Browser software, databases, genome assemblies, and related tools. The genome-mirror@soe.ucsc.edu mailing list offers a moderated discussion forum for Genome Browser mirror sites. The genome-announce@soe.ucsc.edu mailing list posts announcements of data and software releases, and system maintenance.
Online training materials and tutorials on the Genome Browser are available via the “Training” link on the home page.
Acknowledgments
The Genome Browser project is funded by grants from the National Human Genome Research Institute (NHGRI), the Howard Hughes Medical Institute (HHMI), and the National Cancer Institute (NCI). The authors would like to acknowledge the faculty, staff, students, and systems administrators listed at http://genome.ucsc.edu/staff.html who have contributed to the UCSC Genome Browser project, as well as the collaborators listed at http://genome.ucsc.edu/goldenPath/credits.html. The authors would also like to thank their many users for their feedback and support.
Footnotes
Key References
Kent et al., 2002. See above.
A description of the UCSC Genome Browser tool and the underlying conceptual and technical framework.
Fujita et al., 2011. See above.
The 2011 update of Kent et al. (2002) that includes software enhancements and additions, new genome assemblies, and new annotations.
Internet Resources
The UCSC Genome Bioinformatics and Genome Browser home page.
http://hgdownload.cse.ucsc.edu/downloads.html
The UCSC Genome Browser downloads server.
http://genome-mysql.cse.ucsc.edu
The Genome Browser public MySql server.
http://genome.ucsc.edu/goldenPath/help/hgTracksHelp.html
The UCSC Genome Browser User’s Guide.
http://genome.ucsc.edu/goldenPath/help/hgTablesHelp.html
The UCSC Table Browser User’s Guide.
http://genome.ucsc.edu/goldenPath/help/customTrack.html
Information for constructing and uploading a custom annotation track.
http://genome.ucsc.edu/ENCODE/
UCSC Genome Browser ENCODE portal.
User-editable Website for sharing information related to the browser.
genome@soe.ucsc.edu
Mailing list for questions and discussions about the browser software, database, and genome assemblies.
genome-announce@soe.ucsc.edu
Mailing list for announcements about releases of browser software and data, server maintenance, etc.
genome-mirror@soe.ucsc.edu
Mailing list for questions and discussion about mirroring the UCSC Genome Browser.
Literature Cited
- 1000 Genomes Project Consortium. A map of human genome variation from population-scale sequencing. Nature. 2010;467(7319):1061–73. doi: 10.1038/nature09534. [DOI] [PMC free article] [PubMed] [Google Scholar]
- Amberger JS, Bocchini CA, Scott AF, Hamosh A. McKusick’s Online Mendelian Inheritance in Man (OMIM) Nucleic Acids Res. 2009;37:D793–D796. doi: 10.1093/nar/gkn665. [DOI] [PMC free article] [PubMed] [Google Scholar]
- Becker KG, Barnes KC, Bright TJ, Wang SA. The genetic association database. Nat Genet. 2004;36:431–432. doi: 10.1038/ng0504-431. [DOI] [PubMed] [Google Scholar]
- Bejerano G, Siepel AC, Kent WJ, Haussler D. Computational screening of conserved genomic DNA in search of functional noncoding elements. Nat Methods. 2005;2:535–545. doi: 10.1038/nmeth0705-535. [DOI] [PubMed] [Google Scholar]
- Benson DA, Karsch-Mizrachi I, Lipman DJ, Ostell J, Sayers EW. GenBank. Nucleic Acids Res. 2011;39(Database issue):D32–7. doi: 10.1093/nar/gkq1079. [DOI] [PMC free article] [PubMed] [Google Scholar]
- Benson G. Tandem repeats finder: A program to analyze DNA sequences. Nucleic Acids Res. 1999;27:12–17. doi: 10.1093/nar/27.2.573. [DOI] [PMC free article] [PubMed] [Google Scholar]
- Blake JA, Bult CJ, Kadin JA, Richardson JE, Eppig JT the Mouse Genome Database Group. The Mouse Genome Database (MGD): premier model organism resource for mammalian genomics and genetics. Nucleic Acids Res. 2011;39(Database issue):D842–8. doi: 10.1093/nar/gkq1008. [DOI] [PMC free article] [PubMed] [Google Scholar]
- Blanchette M, Kent WJ, Riemer C, Elnitski L, Smit AFA, Roskin KM, Baertsch R, Rosenbloom K, Clawson H, Green ED, Haussler D, Miller W. Aligning multiple genomic sequences with the threaded blockset aligner. Genome Res. 2004;14:708–715. doi: 10.1101/gr.1933104. [DOI] [PMC free article] [PubMed] [Google Scholar]
- Blankenberg D, Von Kuster G, Coraor N, Ananda G, Lazarus R, Mangan M, Nekrutenko A, Taylor J. Galaxy: a web-based genome analysis tool for experimentalists. Current Protocols in Molecular Biology. 2010;Chapter 19(Unit 19):10.1–21. doi: 10.1002/0471142727.mb1910s89. [DOI] [PMC free article] [PubMed] [Google Scholar]
- Cheung VG, Nowak N, Jang W, Kirsch IR, Zhao S, Chen XN, Furey TS, Kim UJ, Kuo WL, Livier M. Integration of cytogenetic landmarks into the draft sequence of the human genome. Nature. 2001;409:953–958. doi: 10.1038/35057192. [DOI] [PMC free article] [PubMed] [Google Scholar]
- Cline MS, Kent WJ. Understanding genome browsing. Nat Biotechnol. 2009;27:153–155. doi: 10.1038/nbt0209-153. [DOI] [PubMed] [Google Scholar]
- Danecek P, Auton A, Abecasis G, Albers CA, Banks E, Depristo MA, Handsaker R, Lunter G, Marth G, Sherry ST, McVean G, Durbin R 1000 Genomes Project Analysis Group. The Variant Call Format and VCFtools. Bioinformatics. 2011 doi: 10.1093/bioinformatics/btr330. [Epub ahead of print] [DOI] [PMC free article] [PubMed] [Google Scholar]
- Diehn M, Sherlock G, Binkley G, Jin H, Matese JC, Hernandez-Boussard T, Rees CA, Cherry JM, Botstein D, Brown PO, Alizadeh AA. Nucleic Acids Res. 2003;31(1):219–23. doi: 10.1093/nar/gkg014. [DOI] [PMC free article] [PubMed] [Google Scholar]
- Eeckman FH, Durbin R. ACeDB and Macace. Methods Cell Biol. 1995;48:583–605. [PubMed] [Google Scholar]
- The ENCODE Project Consortium. The ENCODE (ENCyclopedia Of DNA Elements) Project. Science. 2004;306:636–640. doi: 10.1126/science.1105136. [DOI] [PubMed] [Google Scholar]
- The ENCODE Project Consortium. Identification and analysis of functional elements in 1% of the human genome by the ENCODE pilot project. Nature. 2007;447(7146):799–816. doi: 10.1038/nature05874. [DOI] [PMC free article] [PubMed] [Google Scholar]
- Finn RD, Mistry J, Tate J, Coggill PC, Heger A, Pollington JE, Gavin OL, Gunasekaran P, Ceric G, Forslund K, Holm L, Sonnhammer EL, Eddy SR, Bateman A. The Pfam protein families database. Nucleic Acids Res. 2010;38:D211–22. doi: 10.1093/nar/gkp985. [DOI] [PMC free article] [PubMed] [Google Scholar]
- Firth HV, Richards SM, Bevan AP, Clayton S, Corpas M, Rajan D, Van Vooren S, Moreau Y, Pettett RM, Carter NP. DECIPHER: Database of Chromosomal Imbalance and Phenotype in Humans Using Ensembl Resources. Am J Hum Genet. 2009;84(4):524–33. doi: 10.1016/j.ajhg.2009.03.010. [DOI] [PMC free article] [PubMed] [Google Scholar]
- Flicek P, Amode MR, Barrell D, Beal K, Brent S, Chen Y, Clapham P, Coates G, Fairley S, Fitzgerald S, Gordon L, Hendrix M, Hourlier T, Johnson N, Kähäri A, Keefe D, Keenan S, Kinsella R, Kokocinski F, Kulesha E, Larsson P, Longden I, McLaren W, Overduin B, Pritchard B, Riat HS, Rios D, Ritchie GR, Ruffier M, Schuster M, Sobral D, Spudich G, Tang YA, Trevanion S, Vandrovcova J, Vilella AJ, White S, Wilder SP, Zadissa A, Zamora J, Aken BL, Birney E, Cunningham F, Dunham I, Durbin R, Fernández-Suarez XM, Herrero J, Hubbard TJ, Parker A, Proctor G, Vogel J, Searle SM. Ensembl 2011. Nucleic Acids Res. 2011;39(Database issue):D800–6. doi: 10.1093/nar/gkq1064. [DOI] [PMC free article] [PubMed] [Google Scholar]
- Fujita PA, Rhead B, Zweig AS, Hinrichs AS, Karolchik D, Cline MS, Goldman M, Barber GP, Clawson H, Coelho A, Diekhans M, Dreszer TR, Giardine BM, Harte RA, Hillman-Jackson J, Hsu F, Kirkup V, Kuhn RM, Learned K, Li CH, Meyer LR, Pohl A, Raney BJ, Rosenbloom KR, Smith KE, Haussler D, Kent WJ. The UCSC Genome Browser database: update 2011. Nucleic Acids Res. 2011;39(Database issue):D876–82. doi: 10.1093/nar/gkq963. [DOI] [PMC free article] [PubMed] [Google Scholar]
- Goecks J, Nekrutenko A, Taylor J The Galaxy Team. Galaxy: a comprehensive approach for supporting accessible, reproducible, and transparent computational research in the life sciences. Genome Biol. 2010;11(8):R86. doi: 10.1186/gb-2010-11-8-r86. [DOI] [PMC free article] [PubMed] [Google Scholar]
- Green RE, Krause J, Briggs AW, Maricic T, Stenzel U, Kircher M, Patterson N, Li H, Zhai W, Fritz MH, Hansen NF, Durand EY, Malaspinas AS, Jensen JD, Marques-Bonet T, Alkan C, Prüfer K, Meyer M, Burbano HA, Good JM, Schultz R, Aximu-Petri A, Butthof A, Höber B, Höffner B, Siegemund M, Weihmann A, Nusbaum C, Lander ES, Russ C, Novod N, Affourtit J, Egholm M, Verna C, Rudan P, Brajkovic D, Kucan Z, Gusic I, Doronichev VB, Golovanova LV, Lalueza-Fox C, de la Rasilla M, Fortea J, Rosas A, Schmitz RW, Johnson PL, Eichler EE, Falush D, Birney E, Mullikin JC, Slatkin M, Nielsen R, Kelso J, Lachmann M, Reich D, Pääbo S. A draft sequence of the Neandertal genome. Science. 2010;328(5979):710–22. doi: 10.1126/science.1188021. [DOI] [PMC free article] [PubMed] [Google Scholar]
- Harrow J, Denoeud F, Frankish A, Reymond A, Chen CK, Chrast J, Lagarde J, Gilbert JG, Storey R, Swarbreck D, Rossier C, Hubbard T, Antonarakis SE, Guigo R. GENCODE: producing a reference annotation for ENCODE. Genome Biol. 2006;7(Suppl 1):S4.1–9. doi: 10.1186/gb-2006-7-s1-s4. [DOI] [PMC free article] [PubMed] [Google Scholar]
- Hindorff LA, Sethupathy P, Junkins HA, Ramos EM, Mehta JP, Collins FS, Manolio TA. Potential etiologic and functional implications of genome-wide association loci for human diseases and traits. Proc Natl Acad Sci USA. 2009;106(23):9362–7. doi: 10.1073/pnas.0903103106. [DOI] [PMC free article] [PubMed] [Google Scholar]
- Hsu F, Kent WJ, Clawson H, Kuhn RM, Diekhans M, Haussler D. The UCSC known genes. Bioinformatics. 2006;22:1036–1046. doi: 10.1093/bioinformatics/btl048. [DOI] [PubMed] [Google Scholar]
- Hsu F, Pringle TH, Kuhn RM, Karolchik D, Diekhans M, Haussler D, Kent WJ. The UCSC Proteome Browser. Nucleic Acids Res. 2005;33:D454–D458. doi: 10.1093/nar/gki100. [DOI] [PMC free article] [PubMed] [Google Scholar]
- Hunter S, Apweiler R, Attwood TK, Bairoch A, Bateman A, Binns D, Bork P, Das U, Daugherty L, Duquenne L, Finn RD, Gough J, Haft D, Hulo N, Kahn D, Kelly E, Laugraud A, Letunic I, Lonsdale D, Lopez R, Madera M, Maslen J, McAnulla C, McDowall J, Mistry J, Mitchell A, Mulder N, Natale D, Orengo C, Quinn AF, Selengut JD, Sigrist CJ, Thimma M, Thomas PD, Valentin F, Wilson D, Wu CH, Yeats C. InterPro: The integrative protein signature database (2009) Nucleic Acids Res. 2009;37:D224–D228. doi: 10.1093/nar/gkn785. [DOI] [PMC free article] [PubMed] [Google Scholar]
- The International HapMap 3 Consortium. Integrating common and rare genetic variation in diverse human populations. Nature. 2010;467(7311):52–8. doi: 10.1038/nature09298. [DOI] [PMC free article] [PubMed] [Google Scholar]
- The International HapMap Consortium. The International HapMap Project. Nature. 2003;426:789–796. doi: 10.1038/nature02168. [DOI] [PubMed] [Google Scholar]
- The International HapMap Consortium. A haplotype map of the human genome. Nature. 2005;437:1299–1320. doi: 10.1038/nature04226. [DOI] [PMC free article] [PubMed] [Google Scholar]
- Karolchik D, Baertsch R, Diekhans M, Furey TS, Hinrichs A, Lu YT, Roskin KM, Schwartz M, Sugnet CW, Thomas DJ, Weber RJ, Haussler D, Kent WJ. The UCSC Genome Browser database. Nucleic Acids Res. 2003;31:51–54. doi: 10.1093/nar/gkg129. [DOI] [PMC free article] [PubMed] [Google Scholar]
- Karolchik D, Hinrichs AS, Furey TS, Roskin KM, Sugnet CW, Haussler D, Kent WJ. The UCSC Table Browser data retrieval tool. Nucleic Acids Res. 2004;32:D493–D496. doi: 10.1093/nar/gkh103. [DOI] [PMC free article] [PubMed] [Google Scholar]
- Kent WJ. BLAT - the BLAST-like alignment tool. Genome Res. 2002;12:656–664. doi: 10.1101/gr.229202. [DOI] [PMC free article] [PubMed] [Google Scholar]
- Kent WJ, Baertsch R, Hinrichs A, Miller W, Haussler D. Evolution’s cauldron: Duplication, deletion, and rearrangement in the mouse and human genomes. Proc Natl Acad Sci USA. 2003;100:11484–11489. doi: 10.1073/pnas.1932072100. [DOI] [PMC free article] [PubMed] [Google Scholar]
- Kent WJ, Hsu F, Karolchik D, Kuhn RM, Clawson H, Trumbower H, Haussler D. Exploring relationships and mining data with the UCSC Gene Sorter. Genome Res. 2005;15:737–741. doi: 10.1101/gr.3694705. [DOI] [PMC free article] [PubMed] [Google Scholar]
- Kent WJ, Sugnet CW, Furey TS, Roskin KM, Pringle TH, Zahler AM, Haussler D. The human genome browser at UCSC. Genome Res. 2002;12:996–1006. doi: 10.1101/gr.229102. [DOI] [PMC free article] [PubMed] [Google Scholar]
- Kent WJ, Zahler AM. The intronerator: Exploring introns and alternative splicing in. C elegans Nucleic Acids Res. 2000a;28:91–93. doi: 10.1093/nar/28.1.91. [DOI] [PMC free article] [PubMed] [Google Scholar]
- Kent WJ, Zahler AM. Conservation, regulation, synteny, and introns in a large-scale C. briggsae-C. elegans genomic alignment. Genome Res. 2000b;10:1115–1125. doi: 10.1101/gr.10.8.1115. [DOI] [PubMed] [Google Scholar]
- Kent WJ, Zweig AS, Barber G, Hinrichs AS, Karolchik D. BigWig and BigBed: enabling browsing of large distributed data sets. Bioinformatics. 2010;26(17):2204–7. doi: 10.1093/bioinformatics/btq351. [DOI] [PMC free article] [PubMed] [Google Scholar]
- Lein ES, Hawrylycz MJ, Ao N, Ayres M, Bensinger A, Bernard A, Boe AF, Boguski MS, Brockway KS, Byrnes EJ, Chen L, Chen L, Chen TM, Chin MC, Chong J, Crook BE, Czaplinska A, Dang CN, Datta S, Dee NR, Desaki AL, Desta T, Diep E, Dolbeare TA, Donelan MJ, Dong HW, Dougherty JG, Duncan BJ, Ebbert AJ, Eichele G, Estin LK, Faber C, Facer BA, Fields R, Fischer SR, Fliss TP, Frensley C, Gates SN, Glattfelder KJ, Halverson KR, Hart MR, Hohmann JG, Howell MP, Jeung DP, Johnson RA, Karr PT, Kawal R, Kidney JM, Knapik RH, Kuan CL, Lake JH, Laramee AR, Larsen KD, Lau C, Lemon TA, Liang AJ, Liu Y, Luong LT, Michaels J, Morgan JJ, Morgan RJ, Mortrud MT, Mosqueda NF, Ng LL, Ng R, Orta GJ, Overly CC, Pak TH, Parry SE, Pathak SD, Pearson OC, Puchalski RB, Riley ZL, Rockett HR, Rowland SA, Royall JJ, Ruiz MJ, Sarno NR, Schaffnit K, Shapovalova NV, Sivisay T, Slaughterbeck CR, Smith SC, Smith KA, Smith BI, Sodt AJ, Stewart NN, Stumpf KR, Sunkin SM, Sutram M, Tam A, Teemer CD, Thaller C, Thompson CL, Varnam LR, Visel A, Whitlock RM, Wohnoutka PE, Wolkey CK, Wong VY, Wood M, Yaylaoglu MB, Young RC, Youngstrom BL, Yuan XF, Zhang B, Zwingman TA, Jones AR. Genome-wide atlas of gene expression in the adult mouse brain. Nature. 2007;445(7124):168–76. doi: 10.1038/nature05453. [DOI] [PubMed] [Google Scholar]
- Lenhard B, Hayes WS, Wasserman WW. GeneLynx: A gene-centric portal to the human genome. Genome Res. 2001;11:2151–2157. doi: 10.1101/gr.199801. [DOI] [PMC free article] [PubMed] [Google Scholar]
- Li H. Tabix: fast retrieval of sequence features from generic TAB-delimited files. Bioinformatics. 2011;27(5):718–9. doi: 10.1093/bioinformatics/btq671. [DOI] [PMC free article] [PubMed] [Google Scholar]
- Li H, Handsaker B, Wysoker A, Fennell T, Ruan J, Homer N, Marth G, Abecasis G, Durbin R. Genome Project Data Processing Subgroup. 2009. The Sequence alignment/map (SAM) format and SAMtools. Bioinformatics. 1000;25:2078–9. doi: 10.1093/bioinformatics/btp352. [DOI] [PMC free article] [PubMed] [Google Scholar]
- Maglott D, Ostell J, Pruitt KD, Tatusova T. Entrez Gene: gene-centered information at NCBI. Nucleic Acids Res. 2011;39(Database issue):D52–7. doi: 10.1093/nar/gkq1237. [DOI] [PMC free article] [PubMed] [Google Scholar]
- MGC Project Team. The completion of the Mammalian Gene Collection (MGC) Genome Res. 2009;19(12):2324–33. doi: 10.1101/gr.095976.109. [DOI] [PMC free article] [PubMed] [Google Scholar]
- Pieper U, Webb BM, Barkan DT, Schneidman-Duhovny D, Schlessinger A, Braberg H, Yang Z, Meng EC, Pettersen EF, Huang CC, Datta RS, Sampathkumar P, Madhusudhan MS, Sjölander K, Ferrin TE, Burley SK, Sali A. ModBase, a database of annotated comparative protein structure models, and associated resources. Nucleic Acids Res. 2011;39(Database issue):D465–74. doi: 10.1093/nar/gkq1091. [DOI] [PMC free article] [PubMed] [Google Scholar]
- Pollard KS, Hubisz MJ, Rosenbloom KR, Siepel A. Detection of nonneutral substitution rates on mammalian phylogenies. Genome Res. 2010;20(1):110–21. doi: 10.1101/gr.097857.109. [DOI] [PMC free article] [PubMed] [Google Scholar]
- Pruitt KD, Harrow J, Harte RA, Wallin C, Diekhans M, Maglott DR, Searle S, Farrell CM, Loveland JE, Ruef BJ, Hart E, Suner MM, Landrum MJ, Aken B, Ayling S, Baertsch R, Fernandez-Banet J, Cherry JL, Curwen V, Dicuccio M, Kellis M, Lee J, Lin MF, Schuster M, Shkeda A, Amid C, Brown G, Dukhanina O, Frankish A, Hart J, Maidak BL, Mudge J, Murphy MR, Murphy T, Rajan J, Rajput B, Riddick LD, Snow C, Steward C, Webb D, Weber JA, Wilming L, Wu W, Birney E, Haussler D, Hubbard T, Ostell J, Durbin R, Lipman D. The consensus coding sequence (CCDS) project: Identifying a common protein-coding gene set for the human and mouse genomes. Genome Res. 2009;19:1316–1323. doi: 10.1101/gr.080531.108. [DOI] [PMC free article] [PubMed] [Google Scholar]
- Raney BJ, Cline MS, Rosenbloom KR, Dreszer TR, Learned K, Barber GP, Meyer LR, Sloan CA, Malladi VS, Roskin KM, Suh BB, Hinrichs AS, Clawson H, Zweig AS, Kirkup V, Fujita PA, Rhead B, Smith KE, Pohl A, Kuhn RM, Karolchik D, Haussler D, Kent WJ. ENCODE whole-genome data in the UCSC genome browser (2011 update) Nucleic Acids Res. 2011;39(Database issue):D871–5. doi: 10.1093/nar/gkq1017. [DOI] [PMC free article] [PubMed] [Google Scholar]
- Reese MG, Moore B, Batchelor C, Salas F, Cunningham F, Marth GT, Stein L, Flicek P, Yandell M, Eilbeck K. A standard variation file format for human genome sequences. Genome Biol. 2010;11(8):R88. doi: 10.1186/gb-2010-11-8-r88. [DOI] [PMC free article] [PubMed] [Google Scholar]
- Rose PW, Beran B, Bi C, Bluhm WF, Dimitropoulos D, Goodsell DS, Prlic A, Quesada M, Quinn GB, Westbrook JD, Young J, Yukich B, Zardecki C, Berman HM, Bourne PE. The RCSB Protein Data Bank: redesigned web site and web services. Nucleic Acids Res. 2011;39(Database issue):D392–401. doi: 10.1093/nar/gkq1021. [DOI] [PMC free article] [PubMed] [Google Scholar]
- Safran M, Dalah I, Alexander J, Rosen N, Iny-Stein T, Shmoish M, Nativ N, Bahir I, Doniger T, Krug H, Sirota-Madi A, Olender T, Golan Y, Stelzer G, Harel A, Lancet D. GeneCards Version 3: the human gene integrator. Database (Oxford) 2010. 2010:baq020. doi: 10.1093/database/baq020. [DOI] [PMC free article] [PubMed] [Google Scholar]
- Sanborn JZ, Benz SC, Craft B, Szeto C, Kober KM, Meyer L, Vaske CJ, Goldman M, Smith KE, Kuhn RM, Karolchik D, Kent WJ, Stuart JM, Haussler D, Zhu J. The UCSC Cancer Genomics Browser database: update 2011. Nucleic Acids Res. 2011;39(Database issue):D951–9. doi: 10.1093/nar/gkq1113. [DOI] [PMC free article] [PubMed] [Google Scholar]
- Sayers EW, Barrett T, Benson DA, Bolton E, Bryant SH, Canese K, Chetvernin V, Church DM, DiCuccio M, Federhen S, Feolo M, Fingerman IM, Geer LY, Helmberg W, Kapustin Y, Landsman D, Lipman DJ, Lu Z, Madden TL, Madej T, Maglott DR, Marchler-Bauer A, Miller V, Mizrachi I, Ostell J, Panchenko A, Phan L, Pruitt KD, Schuler GD, Sequeira E, Sherry ST, Shumway M, Sirotkin K, Slotta D, Souvorov A, Starchenko G, Tatusova TA, Wagner L, Wang Y, Wilbur WJ, Yaschenko E, Ye J. Database resources of the National Center for Biotechnology Information. Nucleic Acids Res. 2011;39(Database issue):D38–51. doi: 10.1093/nar/gkq1172. [DOI] [PMC free article] [PubMed] [Google Scholar]
- Schwartz S, Kent WJ, Smit A, Zhang Z, Baertsch R, Hardison R, Haussler D, Miller W. Human-mouse alignments with BLASTZ. Genome Res. 2003;13:103–107. doi: 10.1101/gr.809403. [DOI] [PMC free article] [PubMed] [Google Scholar]
- Seal RL, Gordon SM, Lush MJ, Wright MW, Bruford EA. genenames.org: the HGNC resources in 2011. Nucleic Acids Res. 2011;39(Database issue):D514–9. doi: 10.1093/nar/gkq892. [DOI] [PMC free article] [PubMed] [Google Scholar]
- Shimoyama M, Smith JR, Hayman T, Laulederkind S, Lowry T, Nigam R, Petri V, Wang SJ, Dwinell M, Jacob H RGD Team. RGD: a comparative genomics platform. Hum Genomics. 2011;5(2):124–9. doi: 10.1186/1479-7364-5-2-124. [DOI] [PMC free article] [PubMed] [Google Scholar]
- Siepel A, Bejerano G, Pedersen JS, Hinrichs A, Hou M, Rosenbloom K, Clawson H, Spieth J, Hillier LW, Richards S, Weinstock GM, Wilson RK, Gibbs RA, Kent WJ, Miller W, Haussler D. Evolutionarily conserved elements in vertebrate, insect, worm, and yeast genomes. Genome Res. 2005;15:1034–1050. doi: 10.1101/gr.3715005. [DOI] [PMC free article] [PubMed] [Google Scholar]
- Smit AF. Interspersed repeats and other mementos of transposable elements in mammalian genomes. Curr Opin Gen Dev. 1999;9:657–663. doi: 10.1016/s0959-437x(99)00031-3. [DOI] [PubMed] [Google Scholar]
- Strausberg RL, Greenhut SF, Grouse LH, Schaefer CF, Buetow KH. In silico analysis of cancer through the Cancer Genome Anatomy Project. Trends Cell Biol. 2001;11:S66–S71. doi: 10.1016/s0962-8924(01)02104-3. [DOI] [PubMed] [Google Scholar]
- UniProt Consortium. Ongoing and future developments at the Universal Protein Resource. Nucleic Acids Res. 2011;39(Database issue):D214–9. doi: 10.1093/nar/gkq1020. [DOI] [PMC free article] [PubMed] [Google Scholar]
- Wang T, Furey TS. Analysis of complex disease association and linkage studies using the University of California Santa Cruz Genome Browser. Circ Cardiovasc Genet. 2009;2(2):199–204. doi: 10.1161/CIRCGENETICS.108.843946. [DOI] [PMC free article] [PubMed] [Google Scholar]
- Waterston RH, Lindblad-Toh K, Birney E, Rogers J, Abril JF, Agarwal P, Agarwala R, Ainscough R, Alexandersson M, An P, Antonarakis SE, Attwood J, Baertsch R, Bailey J, Barlow K, Beck S, Berry E, Birren B, Bloom T, Bork P, Botcherby M, Bray N, Brent MR, Brown DG, Brown SD, Bult C, Burton J, Butler J, Campbell RD, Carninci P, Cawley S, Chiaromonte F, Chinwalla AT, Church DM, Clamp M, Clee C, Collins FS, Cook LL, Copley RR, Coulson A, Couronne O, Cuff J, Curwen V, Cutts T, Daly M, David R, Davies J, Delehaunty KD, Deri J, Dermitzakis ET, Dewey C, Dickens NJ, Diekhans M, Dodge S, Dubchak I, Dunn DM, Eddy SR, Elnitski L, Emes RD, Eswara P, Eyras E, Felsenfeld A, Fewell GA, Flicek P, Foley K, Frankel WN, Fulton LA, Fulton RS, Furey TS, Gage D, Gibbs RA, Glusman G, Gnerre S, Goldman N, Goodstadt L, Grafham D, Graves TA, Green ED, Gregory S, Guigo R, Guyer M, Hardison RC, Haussler D, Hayashizaki Y, Hillier LW, Hinrichs A, Hlavina W, Holzer T, Hsu F, Hua A, Hubbard T, Hunt A, Jackson I, Jaffe DB, Johnson LS, Jones M, Jones TA, Joy A, Kamal M, Karlsson EK, Karolchik D, Kasprzyk A, Kawai J, Keibler E, Kells C, Kent WJ, Kirby A, Kolbe DL, Korf I, Kucherlapati RS, Kulbokas EJ, Kulp D, Landers T, Leger JP, Leonard S, Letunic I, Levine R, Li J, Li M, Lloyd C, Lucas S, Ma B, Maglott DR, Mardis ER, Matthews L, Mauceli E, Mayer JH, McCarthy M, McCombie WR, McLaren S, McLay K, McPherson JD, Meldrim J, Meredith B, Mesirov JP, Miller W, Miner TL, Mongin E, Montgomery KT, Morgan M, Mott R, Mullikin JC, Muzny DM, Nash WE, Nelson JO, Nhan MN, Nicol R, Ning Z, Nusbaum C, O’Connor MJ, Okazaki Y, Oliver K, Overton-Larty E, Pachter L, Parra G, Pepin KH, Peterson J, Pevzner P, Plumb R, Pohl CS, Poliakov A, Ponce TC, Ponting CP, Potter S, Quail M, Reymond A, Roe BA, Roskin KM, Rubin EM, Rust AG, Santos R, Sapojnikov V, Schultz B, Schultz J, Schwartz MS, Schwartz S, Scott C, Seaman S, Searle S, Sharpe T, Sheridan A, Shownkeen R, Sims S, Singer JB, Slater G, Smit A, Smith DR, Spencer B, Stabenau A, Stange-Thomann N, Sugnet C, Suyama M, Tesler G, Thompson J, Torrents D, Trevaskis E, Tromp J, Ucla C, Ureta-Vidal A, Vinson JP, Von Niederhausern AC, Wade CM, Wall M, Weber RJ, Weiss RB, Wendl MC, West AP, Wetterstrand K, Wheeler R, Whelan S, Wierzbowski J, Willey D, Williams S, Wilson RK, Winter E, Worley KC, Wyman D, Yang S, Yang SP, Zdobnov EM, Zody MC, Lander ES. Initial sequencing and comparative analysis of the mouse genome. Nature. 2002;420:520–562. doi: 10.1038/nature01262. [DOI] [PubMed] [Google Scholar]
- Wilming LG, Gilbert JG, Howe K, Trevanion S, Hubbard T, Harrow JL. The vertebrate genome annotation (Vega) database. Nucleic Acids Res. 2008;36(Database issue):D753–60. doi: 10.1093/nar/gkm987. [DOI] [PMC free article] [PubMed] [Google Scholar]
- Zhu J, Sanborn JZ, Benz S, Szeto C, Hsu F, Kuhn R, Karolchik D, Archie J, Lenburg M, Esserman L, Kent J, Haussler D, Wang T. The UCSC Cancer Genomics Browser. Nat Methods. 2009;6(4):239–40. doi: 10.1038/nmeth0409-239. [DOI] [PMC free article] [PubMed] [Google Scholar]