Abstract
The cerebellum is one of the most important structures in the posterior cranial fossa, but the characterization of its development by magnetic resonance imaging (MRI) is incomplete. We scanned 40 fetuses that had no morphological brain disorder at 14–22 weeks of gestation using 7.0 T MRI. Amira 4.1 software was used to determine morphological parameters of the fetal cerebellum, which included the cerebellar volume (CV), transverse cerebellar diameter (TCD), and the length and width of the vermis. The relationship between these measurements and gestational age (GA) was analysed. We found that the primary fissure was visible at week 14 of gestation. From week 16, the prepyramidal fissure, the secondary fissure and the dentate nucleus could be identified. The posterolateral fissure and the fourth ventricle were recognized at week 17, whereas the tentorium of the cerebellum was visible at week 20. The relationships between GA and CV, TCD, and the width and length of the vermis were described adequately by second-order polynomial regression curves. The ratios between TCD and vermis length and between TCD and vermis width decreased with GA. These results show that 7.0 T MRI can show the trajectory of cerebellar development clearly. They increase our understanding of normal cerebellar development in the fetus, and will facilitate the diagnosis of pathological intrauterine changes in the cerebellum.
Keywords: brain growth and development, cerebellum, fetal MRI
Introduction
The cerebellum is a region of the brain that plays an important role in motor control and motor learning, contributing to coordination, precision and accurate timing. It is also involved in some cognitive functions, such as attention and language, and probably in some emotional functions, such as the regulation of fear and pleasure responses (Susan et al. 2008). The cerebellum is one of the most important structures in the posterior cranial fossa. It develops over a long period: it is one of the first structures in the brain to begin to differentiate, but one of the last to mature (Susan et al. 2008). By the second trimester of pregnancy, the fissures of the cerebellar cortex have appeared. The cerebellar hemisphere and the vermis, which form the roof of the fourth ventricle, grow rapidly (Kapur et al. 2009), and during the second trimester the tentorium of the cerebellum is being shaped. Some abnormalities may arise during this process (Iruretagoyena et al. 2010), such as COACH syndrome and Dandy–Walker syndrome (Alexiou et al. 2010).
Ultrasound examination is the main technique used to evaluate the fetal brain, having the advantages of reliability, low cost, portability and real-time visualization. Some abnormalities in the posterior cranial fossa, including cerebellar tonsillar hernia (Iruretagoyena et al. 2010), can be identified using ultrasound from the second trimester. Rutten et al. (2009) measured the volume of the fetal cerebellum with 3D-ultrasound from 20 weeks of gestational age (GA) to determine the asymmetry between the left and right sides. However, ultrasound has several limitations when compared with magnetic resonance imaging (MRI), such as the relatively poor contrast resolution. For some brain structures, it can only delineate their gross anatomy (Malinger et al. 2009; Mighell et al. 2009; Vazquez et al. 2009). In recent years, fetal MRI has been proposed as a complimentary examination for prenatal diagnosis after the ultrasound. It has been demonstrated that in vivo fetal MRI is highly accurate with respect to the determination of normal and pathological morphological changes of the fetal brain, and it becomes especially important when ultrasound findings are inconclusive (Huisman et al. 2002). (Hatab et al. (2008) measured fetal cerebellar volume (CV) with MRI in vitro, and compared the results with those obtained by 3D-ultrasound. They found that MRI measurement was more accurate, and did not show attenuation shadowing. However, fetal MRI has some drawbacks; for example, fetal movement can influence the acquisition of the images (Reichel et al. 2003; Malinger et al. 2009).
The trajectory of cerebellar development has been described in detail in previous histological studies. However, there are some discrepancies between the data obtained using histology and those from in vivo fetal MRI. With post mortem MRI, clear images of thin layers of the cerebellum can be obtained without destruction of the specimen, and thus the technique provides a new way to study fetal cerebellar development (Triulzi et al. 2005; Joó & Rigó, 2009; Limperopoulos et al. 2009).
In this study, we selected 40 formalin-fixed fetal specimens with normal brain development and of GA ranging from 14 to 22 weeks, and investigated the characteristics of normal cerebellar development using 7.0 T MRI. The results could be useful for characterizing the development of the cerebellum and might facilitate the in vivo diagnosis of pathological changes that occur during the second trimester.
Materials and methods
Fetal specimens
From 2005, 43 fetal specimens (at 14–22 weeks GA) were collected in Shandong Province from abortions that were indicated medically because of abnormalities outside the brain, or from spontaneous abortions. The GA of the fetus was estimated on the basis of the crown–rump length, head circumference and foot length, and was expressed in weeks from the last menstrual period. The specimens were immersed in 10% formalin and were scanned by 7.0 T MRI as soon as possible. For each specimen, the period between collection and scanning was < 2 months. The procedure for examination of the fetuses was approved by the Internal Review Board of Shandong University. Parental consent to donation of the fetal cadaver was obtained. All images were reviewed by two neuroradiologists, each of whom had more than 10 years of experience in interpreting fetal brain images, to determine whether the morphological features of the fetal CNS were normal. Three of the fetuses showed cerebellar abnormalities on MRI; these were diagnosed as pontocerebellar hypoplasia, absence of the vermis, and cerebellar hypoplasia, respectively. The three fetuses with brain abnormalities were excluded, and the remaining 40 fetal specimens were used in this study. The distribution of GA of the fetuses studied is shown in Table 1.
Table 1.
Distribution of GA and number of specimens studied (n = 40)
| GA | Number | GA | Number |
|---|---|---|---|
| 14 | 1 | 19 | 7 |
| 16 | 5 | 20 | 7 |
| 17 | 5 | 21 | 6 |
| 18 | 5 | 22 | 4 |
GA, gestational age.
MRI and analysis
The fetuses were scanned with a BRUKER 7.0 T Micro-MR scanner with a maximum gradient of 360 mT (70/16 pharmaScan; Bruker Biospin GmbH, Germany). A rat body coil with an inner diameter of 60 mm was chosen for scanning of all the fetuses, and a single-shot FSE T2-weighted sequence was used. HASTE images were obtained with the following parameters: a slice thickness of 0.5 mm with no gap; field of view: 6.0 × 6.0 cm; matrix: 256 × 256; TR: 12 000.0 ms; TE: 50.0 ms; number of acquisitions: 4.
The MR images from each fetus were analysed by applying a series of manual and automated procedures. First, the images were imported into Amira 4.1 software (http://www.amira.com/) to be aligned. Second, for each image throughout the series, the cerebellar area in the sagittal, coronal and transverse planes was traced around manually until the cerebellum could be visualized no longer (Fig. 1). Third, the CV and transverse cerebellar diameter (TCD), which is the longest measurement of the long axis of the cerebellar hemispheres, were determined. Fourth, the width of the vermis (the distance from the roof of the fourth ventricle to the posterior border of the cerebellum) and height of the vermis (the longest macroaxis of the vermis) were measured on three sagittal images that approached the median sagittal plane (Robinson et al. 2007).
Fig. 1.
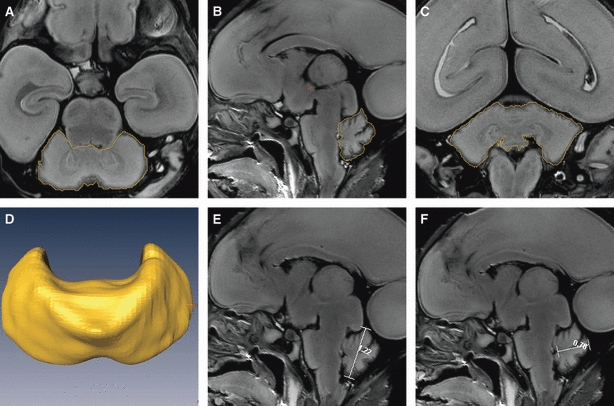
Procedures used to measure the CV, TCD, vermis height and vermis width by Amira. The figures show the procedures used to outline the cerebellum in a representative 21-week-old fetus in the (A) transverse, (B) sagittal and (C) coronal planes; the boundaries of the cerebellum are outlined in yellow. (D) The reconstructed cerebellar image after outlining. (E and F) The procedures used to measure the height and width of the vermis on median sagittal images by Amira; the lines on the images are the vermis height and width, respectively.
The main landmarks that were considered in delineation of the cerebellum were the roof of the fourth ventricle and the base of the cerebellar peduncles. To check the reproducibility of the manual segmentation, the cerebellum was segmented manually twice, on each occasion simultaneously by two anatomists, to obtain a mean value. The time interval between the two rounds of manual segmentation was at least 1 week. The results that showed no statistically significant interobserver variation (P > 0.80) were used for the analysis.
Statistical analysis
All the coronal, transverse and sagittal images obtained were analysed. Given that the CV increased rapidly with GA, the natural logarithmic transformation of the measurements was used instead of the raw CV data (Hatab et al. 2008). The natural logarithmic transformation fitted a normal distribution better than the raw data. The paired t-test was conducted to determine significant differences among the sagittal, transverse and coronal measurements, and P = 0.05 was considered to indicate a significant difference. The statistical software SPSS 17.0 was used to conduct the analysis.
Cerebellar volume was measured again by the two original observers in a sample set of three fetuses that spanned the whole range of GA used in this study. These measurements were compared with the original data set by paired t-test. CV was also measured by two additional observers in a different subset of five fetuses (with GAs of 17, 18, 19, 20 and 21 weeks, respectively). These data and the original data were analysed using the paired t-test to obtain a limited assessment of interobserver variability.
Results
Development of the fissures and folia of the vermis
The development of the cerebellar vermis could be observed more easily on mid-sagittal fetal MR images than on coronal or transverse images. The primary fissure was the first to be visualized, and was detectable as early as week 14 (Fig. 2B1). The culmen and declive, which are bounded by the primary fissure, also became visible at the same time. The prepyramidal fissure, which separates the pyramis vermis and tuber vermis, became visible by week 16 (Fig. 2B2). The secondary fissure also emerged at this point. The posterolateral fissure could be recognized at week 17 (Fig. 2B3). The uvula, which is bounded by the secondary and posterolateral fissures, emerged at week 16. In front of the culmen, the central lobule could be recognized at week 18.
Fig. 2.
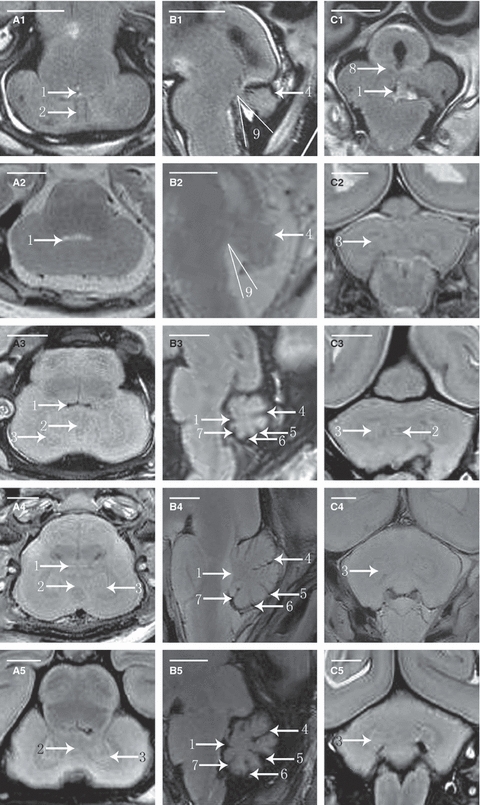
Fetal cerebellar T2-weighted MR images in transverse, sagittal and coronal planes. A1, A2, A3, A4 and A5 are the transverse MR images at 14 weeks of GA (W), 16W, 18W, 19W and 21W. B1, B2, B3, B4 and B5 are the sagittal MR images at 14W, 16W, 17W, 20W and 22W. C1, C2, C3, C4 and C5 are the coronal MR images at 14W, 17W, 19W, 20W and 21W. 1, fourth ventricle; 2, vermis; 3, dentate nucleus; 4, primary fissure; 5, prepyramidal fissure; 6, postpyramidal fissure; 7, posterolateral fissure; 8, middle cerebellar peduncle; 9, tegmento-vermian angle.
At the earliest GA studied, the ratio between the volume of the parts above and the volume of those beneath the primary fissure was 1 : 1. With the growth of the pyramis vermis and tuber vermis, the parts beneath grew faster and became larger than the parts above after week 16. As a result, the volume of the uvula changed little, whereas the declive, pyramis vermis and tuber vermis increased rapidly in size.
Development of the medulla and dentate nucleus of the cerebellum
The differences in the signal intensity of the cortex and medulla were too small for the parts to be distinguished in the second trimester. The demarcation could not be visualized until week 18 (Fig. 2A3), and it became clear at week 20. The dentate nucleus was usually detectable at week 16, and was delineated as an area of semiannular shape with a lower T2 signal intensity relative to the rest of the cerebellum (Fig. 2A2). It became clearly visible, with a pocket-like shape, after week 18, and was also delineated with low T2 signal intensity (Fig. 2A3). Other deep nuclei were not visible during this study.
Development of the structures adjacent to the cerebellum
In the posterior cranial fossa, the fourth ventricle is located between the cerebellum and the brain stem. From weeks 14 to 16 of gestation, the fourth ventricle is an open space, referred to as the tegmento-vermian angle (Necchi et al. 2000). This angle is formed by two lines. The first line lies along the dorsal surface of the brain stem parallel to the tegmentum, and should transect the nucleus gracilis at the obex. The second line is drawn along the ventral surface of the vermis. The tegmento-vermian angle was approximately 37.5 ° at week 14 (Fig. 2B1), and it declined with growth. At week 17, the angle disappeared and the fourth ventricle was closed.
The tentorium could be recognized at week 16, when its lower edge was free and it had not yet separated the cerebrum and cerebellum (Fig. 2B2). By week 17, the tentorium had its definitive orientation (Fig. 2B3), and its start and finish were clearly visible from week 20 onwards (Fig. 2B4).
Quantitative assessment
Student's t-test indicated that there was no significant difference among the values of CV obtained from the coronal, transverse and sagittal images (P > 0.2 for all comparisons), which suggested that the three measurements could be averaged. The relationship between CV in cm3 and GA in weeks was described well by a second-order polynomial regression curve [CV = 0.0041GA2 + 0.0238GA − 0.9334] (Fig. 3). The width and length of the vermis were obtained by averaging the measurements from three sagittal images. The TCD, as well as the width and length of the vermis, increased with GA in a pattern described by a second-order polynomial regression curve [TCD = −0.0073GA2 + 0.3804GA − 2.5735 (r2 = 0.768, P<0.05), vermis width = −0.0022GA2 + 0.1422GA − 1.2698 (r2 = 0.858, P<0.05), vermis height = 0.0005GA2 + 0.0733GA − 0.7529 (r2 = 0.818, P<0.05)] (Fig. 4). The ratio of TCD to vermis length decreased with GA, as did the ratio of TCD to vermis width (Fig. 5).
Fig. 3.
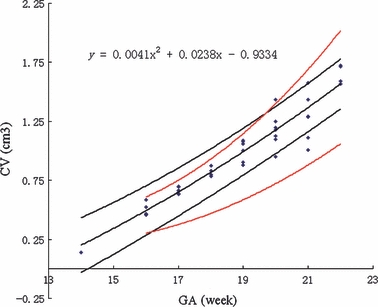
Cerebellar volume (CV) vs. gestational age (GA). The figure shows CV in cm3 as a function of GA in weeks. Each symbol represents the CV for a single fetus. The central dark line represents the mathematical model of the data, the equation for which is shown in the top left corner. The outer dark lines represent the 90% confidence intervals. The outer red lines are the 95th and 5th percentiles for CV derived from the study by Hatab et al.
Fig. 4.
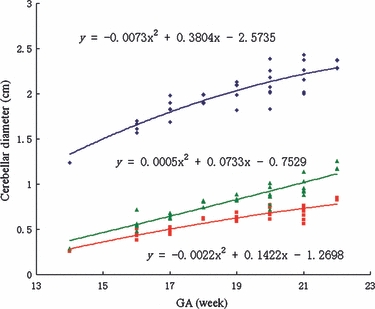
TCD, vermis height and vermis width vs. gestational age (GA). The figure shows TCD in cm (□, blue symbol), vermis height in cm (▴, green symbol) and vermis width in cm (▪, red symbol) as a function of GA in weeks. The three lines represent the mathematical models of the data, the equations for which are marked on the figure.
Fig. 5.
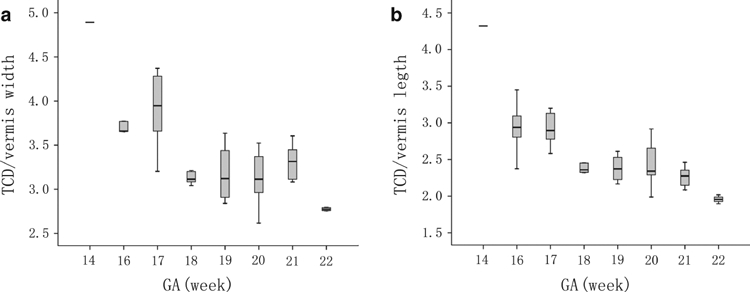
The ratio between transverse cerebellar diameter (TCD) and vermis height vs. gestational age (GA) (a), and the ratio between TCD and vermis width vs. GA (b). The superior and inferior extremity of each box indicates the 75 and 25 percentiles, respectively. The lines above and below each box indicate the minimum and maximum values for each GA. The line within each box indicates the median for each GA.
Discussion
Substantial changes occur in the cerebellum during the second trimester, i.e. at GA of 14–22 weeks. During this period, most structures of the cerebellum, as well as adjacent structures, form gradually but are not mature.
In a previous histological study (Susan et al. 2008), the authors observed that the first fissure to appear in the surface of the cerebellum was the lateral part of the posterolateral fissure. At the end of the third month, a transverse sulcus appeared on the rostral slope of the cerebellar rudiment and then deepened to form the primary fissure. At the same time, two short transverse grooves appeared in the caudal vermis; the first was the postpyramidal fissure, and the other was the prepyramidal fissure. In the current study, only the primary fissure could be recognized on the post mortem MR images during this period. The postpyramidal fissure, the prepyramidal fissure and the posterolateral fissure appeared later than the primary fissure. The reasons are diverse. According to phylogeny, the archicerebellum begins to develop earlier than the palaeocerebellum. However, from the second trimester, the archicerebellum grows more slowly, and finally becomes smaller, than the palaeocerebellum. With these changes, the posterolateral fissure, which is the boundary of the archicerebellum and palaeocerebellum, becomes more superficial, and it cannot be recognized clearly on MRI. In addition, both the postpyramidal fissure and the prepyramidal fissure are shallower than the primary fissure.
Given the poor definition that can be achieved with in vivo fetal MRI, previous studies have focused mainly on the gross anatomical features of the cerebellum, such as the shape or volume. Only apparent fissures had been described. The primary fissure could be recognized at week 21, and the vermis lobe was visible at week 24 (Necchi et al. 2000). In the current study, in which we used MRI at high tesla values, all fissures in the vermis could be recognized and the time at which they became visible could also be studied. Thus, MRI at high tesla can be used to obtain clearer images and more accurate results for fetal specimens from the second trimester than in vivo fetal MRI.
In the current study, which used fetuses with a GA of 14–20 weeks, the cerebellum did not occupy the entire posterior cranial fossa, because of the asynchronous development of the skull and cerebellum (Wright et al. 2010). During this stage of gestation, the vacant space in the posterior cranial fossa became smaller, which indicated that the rate of growth of the cerebellum was faster than that of the skull. If the development of the skull of the posterior cranial fossa is delayed during this period, the tonsil of the cerebellum may intrude into the foramen magnum, which gives rise to Chiari symptom (Falip et al. 2009). From week 14 to week 16, the tegmento-vermian angle decreased. At week 17, the fourth ventricle had lost its communication with the cistern of the posterior cranial fossa, and had become isolated. At this stage, if the fourth ventricle cannot be closed by the vermis owing to vermis dysplasia, Dandy–Walker syndrome can arise. In fact, there is no real communication between the fourth ventricle and the cisterna magna because there is a thin membrane between them, which is difficult to see on MRI. (Zalel et al. (2002) reported that Dandy–Walker syndrome could be diagnosed at week 18 of gestation, but it could be detected as early as week 17 in our study.
In previous studies, CV and cerebellar diameter have been obtained using 3D-ultrasonography and in vitro fetal MRI. Few studies have measured cerebellar size by MRI of fetal specimens, although the relationship between CV and GA has been investigated before with in vitro fetal MRI (Falip et al. 2009; Limperopoulos et al. 2009; Rutten et al. 2009). Figure 3 shows a plot of our data superimposed on the 5th and 95th centile curves from Hatab et al. (2008). It can be seen that our measurements are larger than those of the previous study, possibly because Hatab used a relatively large slice thickness. The increasing discrepancy between the two studies with increasing GA implied that the differences caused by the size of the gaps between slices were also increasing. Our 90% confidence intervals were narrower than those of Hatab et al., which suggests that our measurements were more precise. For TCD, our data at 20–22 weeks of GA were consistent with those reported by Parazzini et al. (2008).
Understanding the normal development of the cerebellum will help us to distinguish pathological changes from healthy growth during cerebellar development in the fetus, which can help in the early diagnosis of abnormalities. Our results could supply reference material for the identification of abnormalities in CV, TCD, and the length and width of the vermis, and thus could be used in the detection of cerebellar or vermian abnormalities. The two ratios measured both decreased with growth, which demonstrated that the rates of growth of cerebellar diameters and cerebellar lobes are not consistent. We observed on the sagittal images that, from week 16 of gestation, the pyramid and tuber of the vermis grew rapidly, whereas the uvula of the vermis changed little. This can be explained by the different phylogenies of the vermis lobes. The pyramid and tuber of the vermis are formed from the neocerebellum, whereas the uvula develops from the palaeocerebellum.
Some limitations of the study should be addressed. First, relative to the sample size in other fetal biometry studies, the sample size in this study (40 fetuses) was small. Second, the fetal specimens had been fixed with formalin before scanning, which might have affected the measurements slightly. Third, we made no histological comparisons with the high-resolution MR images.
Conclusions
The post mortem MRI of high tesla is an accurate way to study the development of the fetal cerebellum without the limitations of intrauterine MRI scanning. Clear images of cerebellar structures can be obtained for observation. The modeled growth curve generated from our results can be considered for clinical application. Future investigations might involve evaluation of the cerebellum at other GAs, and the long-term goal of this project is to use the results to evaluate the cerebellum in fetuses with malformations of the CNS. Although this method cannot be used in vivo, it can supply an anatomical foundation for the diagnosis of abnormalities.
Acknowledgments
This work was supported by National Natural Science Foundation of China (NO. 31071050), Natural Science Foundation of Shandong Province (ZR2009CM091), promotive research fund for excellent young and middle-aged scientists of Shandong Province (BS2010YY042), and Excellent postgraduate Innovation Foundation of Shandong University. The authors thank Bingzhi Liu, Qingcai Zhou, Shuhui Hong, Jianfen Jiao, Xinting Gai for the post mortem fetuses collection. Thanks to the ‘Genedits’, for linguistic advice.
References
- Alexiou GA, Sfakianos G, Prodromou N. Dandy–Walker malformation: analysis of 19 cases. J Child Neurol. 2010;25:188–191. doi: 10.1177/0883073809338410. [DOI] [PubMed] [Google Scholar]
- Falip C, Hornoy P, Millischer Bellaïche AE, et al. Fetal cerebral magnetic resonance imaging (MRI). Indications, normal and pathological patterns. Rev Neurol (Paris) 2009;165:875–888. doi: 10.1016/j.neurol.2009.01.036. [DOI] [PubMed] [Google Scholar]
- Hatab MR, Kamourieh SW, Twickler DM. MR volume of the fetal cerebellum in relation to growth. J Magn Reson Imaging. 2008;27:840–845. doi: 10.1002/jmri.21290. [DOI] [PubMed] [Google Scholar]
- Huisman TA, Martin E, Kubik-Huch R, et al. Fetal magnetic resonance imaging of the brain: technical considerations and normal brain development. Eur Radiol. 2002;12:1941–1951. doi: 10.1007/s00330-001-1209-x. [DOI] [PubMed] [Google Scholar]
- Iruretagoyena JI, Trampe B, Shah D. Prenatal diagnosis of Chiari malformation with syringomyelia in the second trimester. J Matern Fetal Neonatal Med. 2010;23:184–186. doi: 10.3109/14767050903061769. [DOI] [PubMed] [Google Scholar]
- Joó JG, Rigó J., Jr Significance of magnetic resonance studies in prenatal diagnosis of malformations of the fetal central nervous system. Orv Hetil. 2009;150:1275–1280. doi: 10.1556/OH.2009.28626. [DOI] [PubMed] [Google Scholar]
- Kapur RP, Mahony BS, Finch L, et al. Normal and abnormal anatomy of the cerebellar vermis in midgestational human fetuses. Birth Defects Res A Clin Mol Teratol. 2009;85:700–709. doi: 10.1002/bdra.20589. [DOI] [PubMed] [Google Scholar]
- Limperopoulos C, Robertson RL, Sullivan NR, et al. Cerebellar injury in term infants: clinical characteristics, magnetic resonance imaging findings, and outcome. Pediatr Neurol. 2009;41:1–8. doi: 10.1016/j.pediatrneurol.2009.02.007. [DOI] [PubMed] [Google Scholar]
- Malinger G, Lev D, Lerman-Sagie T. The fetal cerebellum. Pitfalls in diagnosis and management. Prenat Diagn. 2009;29:372–380. doi: 10.1002/pd.2196. [DOI] [PubMed] [Google Scholar]
- Mighell AS, Johnstone ED, Levene M. Post-natal investigations: management and prognosis for fetuses with CNS anomalies identified in utero excluding neurosurgical problems. Prenat Diagn. 2009;29:442–449. doi: 10.1002/pd.2245. [DOI] [PubMed] [Google Scholar]
- Necchi D, Soldani C, Bernocchi G, et al. Development of the anatomical alteration of the cerebellar fissura prima. Anat Rec. 2000;259:150–156. doi: 10.1002/(SICI)1097-0185(20000601)259:2<150::AID-AR5>3.0.CO;2-A. [DOI] [PubMed] [Google Scholar]
- Parazzini C, Righini A, Rustico M, et al. Prenatal magnetic resonance imaging: brain normal linear biometric values below 24 gestational weeks. Neuroradiology. 2008;50:877–883. doi: 10.1007/s00234-008-0421-7. [DOI] [PubMed] [Google Scholar]
- Reichel TF, Ramus RM, Caire JT, et al. Fetal central nervous system biometry on MR imaging. Am J Roentgenol. 2003;180:1155–1158. doi: 10.2214/ajr.180.4.1801155. [DOI] [PubMed] [Google Scholar]
- Robinson AJ, Blaser S, Toi A, et al. The fetal cerebellar vermis: assessment for abnormal development by ultrasonography and magnetic resonance imaging. Ultrasound Q. 2007;23:211–223. doi: 10.1097/RUQ.0b013e31814b162c. [DOI] [PubMed] [Google Scholar]
- Rutten MJ, Pistorius LR, Mulder EJ, et al. Fetal cerebellar volume and symmetry on 3-D ultrasound: volume measurement with multiplanar and vocal techniques. Ultrasound Med Biol. 2009;35:1284–1289. doi: 10.1016/j.ultrasmedbio.2009.03.016. [DOI] [PubMed] [Google Scholar]
- Susan S, Harold E, Jeremiah CH. Gray's Anatomy. 40th edn. Spain: Churchill Livingstone; 2008. pp. 375–379. 297–309. [Google Scholar]
- Triulzi F, Parazzini C, Righini AS. MRI of fetal and neonatal cerebellar development. Semin Fetal Neonatal Med. 2005;10:411–420. doi: 10.1016/j.siny.2005.05.004. [DOI] [PubMed] [Google Scholar]
- Vazquez E, Mayolas N, Delgado I, et al. Fetal neuroimaging: US and MRI. Pediatr Radiol. 2009;39:422–435. doi: 10.1007/s00247-009-1221-x. [DOI] [PubMed] [Google Scholar]
- Wright C, Sibley CP, Baker PN. The role of fetal magnetic resonance imaging. Arch Dis Child Fetal Neonatal Ed. 2010;95:F137–F141. doi: 10.1136/adc.2008.151076. [DOI] [PubMed] [Google Scholar]
- Zalel Y, Seidman DS, Brand N, et al. The development of the fetal vermis: an in-utero sonographic evaluation. Ultrasound Obstet Gynecol. 2002;19:136–139. doi: 10.1046/j.0960-7692.2001.00621.x. [DOI] [PubMed] [Google Scholar]


