Abstract
Heel fat pad cushioning efficiency is the result of its structure, shape and thickness. However, while a number of studies have investigated heel fat pad (HFP) anatomy, structural behavior and material properties, no previous study has described its three-dimensional morphology in situ. The assessment of the healthy, unloaded, three-dimensional morphology of heel pad may contribute to deepen the understanding of its role and behavior during locomotion. It is the basis for the assessment of possible HFP morphological modifications due to changes in the amount or distribution of the loads normally sustained by the foot. It may also help in guiding the surgical reconstruction of the pad and in improving footwear design, as well as in developing a correct heel pad geometry for finite element models of the foot. Therefore the purpose of this study was to obtain a complete analysis of HFP three-dimensional morphology in situ. The right foot of nine healthy volunteers was scanned with computed tomography. A methodological approach that maximizes reliability and repeatability of the data was developed by building a device to lock the foot in a neutral position with respect to the scan planes during image acquisition. Scan data were used to reconstruct virtual three-dimensional models for both the calcaneus and HFP. A set of virtual coronal and axial sections were extracted from the three-dimensional model of each HFP and processed to extract a set of one- and two-dimensional morphometrical measurements for a detailed description of heel pad morphology. The tissue exhibited a consistent and sophisticated morphology that may reflect the biomechanics of the foot support. HFP was found to be have a crest on its anterior dorsal surface, flanges on the sides and posteriorly, and a thick portion that reached and covered the posterior surface of the calcaneus and the achilles tendon insertion. Its anterior internal portion was thinner and a lump of fat was consistently present in this region. Finally, HFP was found to be thicker in males than in females.
Keywords: foot morphology, heel fat pad, heel pad thickness, heel pain, plantar fat pad
Introduction
The heel fat pad (HFP) is a highly specialized adipose-based structure that protects the rear foot and the lower extremities from the stress generated during the heel-strike and the initial support phase of locomotion. HFP cushioning efficiency is the result of its structure, shape and thickness (Miller-Young et al. 2002). However, although a number of studies have investigated HFP anatomy, structural behavior and material properties, there has been a limited discussion on its morphology in situ. In this context, several studies investigated HFP thickness, which was considered the most important structural factor in determining the stresses on the deeper tissues (Gooding et al. 1986; Cavanagh et al. 1997). Atrophy of the plantar fat pad has also been implicated in a number of pathologies (Morag et al. 1997). Many studies compared HFP thickness of healthy individuals with that of subjects with clinical diseases such as diabetes (Hsu et al. 2009; Gooding et al. 1986; Kao et al. 1999), rheumatoid arthritis (Falsetti et al. 2004), calcaneal fractures (Silver et al. 1994; Levy et al. 1992), acromegaly (Gooding et al. 1986), and plantar heel pain syndrome (Prichasuk, 1994). HFP thickness differences due to gender, aging and athletic activity level (Uzel et al. 2006) have also been investigated. Both ultrasonography and lateral radiographs were used to obtain the unloaded and loaded HFP thickness beneath the plantar tuberosity of the calcaneus by measuring the vertical distance between the calcaneus and the skin. However, the accuracy of the measurements obtained with these techniques strongly depends on the orientation of the foot during the examination, which is not usually strictly constrained, thus making the repeatability of the approaches doubtful and the reported HFP thickness easily overestimated. In addition, measuring HFP thickness at only one point does not provide a complete knowledge of HFP 3-D morphology.
Knowledge of healthy, unloaded HFP morphology may contribute to deepen the understanding of its role and behavior during locomotion. It provides a basis for assessing whether HFP morphological remodeling occurs due to changes in the amount or distribution of HFP loads caused by factors such as aging, obesity, level of sports activity, and modifications of HFP material properties due to clinical diseases. Assessment of HFP morphology can be useful in the surgical reconstruction of absent or damaged HFP. Burn scar, trauma, chronic wound, and tumor resection can create sole and heel defects that may require HFP surgical reconstruction. Surgery is generally done with muscle flaps placed beneath the calcaneus (Yucel et al. 2000; Ikuta et al. 1984; Wang et al. 1999). A deeper knowledge of HFP distribution can guide the surgeons to a more effective placement of the flaps. In addition, footwear designers may benefit from knowing the healthy and altered morphology of the HFP to improve sole, midsole and insole geometry to enhance or replace HFP functionality. Luo et al. (2011) developed a 2-D finite element model of the heel to investigate the effect of various insole design and materials on the stress, strain and strain energy density on the HFP. They concluded that changing insole design and using different materials can significantly redistribute the stress and strain inside the HFP. Indeed, the correct HFP geometry is critical also for the development of 3-D finite element models of the foot (as most available models are in 2-D). Sopher et al. (2011) developed a 3-D finite element model of the heel to examine the effects of foot posture on strain and stresses sensed by the HFP. In the model, HFP geometry was deducted from measurements of foot cryosections available in the Human Visible Project (Sopher et al. 2011); however, only the posterior part of the pad was considered for that study.
Despite the numerous applications that can benefit from knowledge of HFP morphology, no previous studies have provided a 3-D analysis of HFP morphological peculiarities. Hence, the purpose of this study was to perform a realistic and detailed set of 1- and 2-D morphometrical measurements on virtual models of the HFP in order to obtain a complete analysis of HFP 3-D morphology in situ.
Materials and methods
Nine (four males and five females) volunteers with no history of relevant foot trauma or over/under pronation problems, with a mean age of 30 years (Table 1), were enrolled in this study and gave informed consent. Their right foot was scanned with computed tomography (CT) after careful preorientation of the leg–foot complex on the CT couch. CT data were processed with commercial image processing software to develop virtual 3-D models of the calcaneus and HFP. Axial and coronal planes were generated with a sampling interval based on calcaneus size and used to generate HFP sections. The resulting sections were processed and morphometrical parameters were obtained for the description of HFP morphology.
Table 1.
Subject characteristics
| Subjects | |||||||||
|---|---|---|---|---|---|---|---|---|---|
| A | B | C | D | E | F | G | H | I | |
| Gender (F/M) | F | F | M | F | F | M | M | M | F |
| Age (years) | 26 | 26 | 26 | 28 | 34 | 35 | 26 | 45 | 29 |
| Weight (kg) | 55 | 62 | 73 | 61 | 58 | 77 | 78 | 90 | 50 |
| BMI (kg m–2) | 17 | 24 | 22 | 21 | 22 | 23 | 21 | 24 | 17 |
F/M, female/male; BMI, body mass index.
Foot preorientation
The choice of the coordinate system (CS) for HFP morphometrical measurements is critical. In the present study a device defining a cartesian CS to preorientate the foot during the CT scan was built. The device consists of two boards at a 90° angle used to position the foot (foot board, FB) and the leg (leg board, LB, Fig. 1). Lying on FB, the foot was perpendicular to the leg lying on LB, thus ensuring 0º of dorsiflexion/plantarflexion and 0º of inversion/eversion for the ankle joint. In addition, the foot longitudinal axis (FLA, joining the mid-point of the line connecting the medial and lateral malleoli with the point between the second and third toes) was perpendicular to LB, which ensured 0º of abduction/adduction of the foot. We referred to this position as the neutral position of the foot. Positioning of the device on the CT couch was accomplished by aligning the two boards with the CT scan planes. We used a digital level to achieve a flat condition for LB lying on the couch and exact 90º angle between the two boards (even slight pressure exerted by the forefoot pushing on FB may cause a displacement, altering the 90° angle). Thus, CT and device CSs had the same orientation, and the foot was in normal position with respect to the planes of both device and CT scan. This enabled us to obtain reliable sections of the HFP according to the CT scan planes. During acquisition, volunteers were required to lightly lift up the heel from the board, thus keeping the HFP unloaded and its morphology unchanged. This resulted in a slight plantarflexion of the ankle joint see (Discussion). The use of the support during the CT scan enhanced experimental repeatability and reproducibility by locking the foot of each patient in the same orientation with respect to the CT scan and ensured the reliability of the data, as the foot was in neutral position with respect to the CT scan planes used for the generation of HFP sections.
Fig. 1.
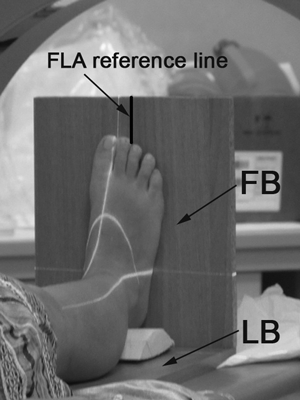
CT scan of the foot with the positioning device. The device consist of a leg board (LB) and a foot board (FB). The black line drawn on the FB is the reference line for alignment of foot longitudinal axis (FLA). The white lines represent the scan lines.
Data acquisition
A Philips Brilliance-64 CT scanner (Philips Medical Systems, Cleveland, OH, USA) was used to acquire 0.8-mm-thick slices with 0.4-mm overlap with a low-dose protocol. An appropriate number of slices were generated to acquire the ankle, the foot and the support. A typical protocol for foot ‘extremities-foot’ mode was used, and the resulting CT data were filtered with a soft tissue filter to facilitate the accurate HFP segmentation, and with a hard tissue filter for calcaneus segmentation. Hence, two different image datasets were obtained for each foot and converted into digital imaging and communication (DICOM) format.
Image processing
The DICOM data were imported into amira 3.1.1 (Mercury Computer Systems, Chelmsford, MA, USA) to obtain 3-D virtual models of the calcaneus and HFP of each subject. The segmentation of the calcaneus was semi-automatically obtained by the software's blowtool (i.e. starting by selecting a voxel relative to the calcaneus, the selection grows in areas with homogeneous gray values and stops when gray values change abruptly) and completed manually slice by slice. The HFP was completely manually segmented. Manual segmentation was required because the HFP consists of adipose tissue embedded in connective septae and a single threshold range could not detect tissues of different densities. Sagittal sections were used to start the manual segmentation, and the result was checked and corrected in the coronal and axial views with the supervision of an expert radiologist. During segmentation, only structured fat was considered to be the HFP. This made it difficult to segment the lateral walls of the pad, where the HFP borders the hypodermis. Hypodermis also presents connective septae but they are loose and less numerous than the dense system of fibro-elastic septae in the HFP. We could not define objectively, through CT images, a clear line separating the HFP and hypodermis because such a distinction relies on a different amount of connective septae (Fig. 2A). The fat beneath the calcaneus was completely structured and easy to segment (Fig. 2B), except for a small area characterized by the absence of connective septae. The lump of fat was found in all subjects on the antero-medial side of the heel and excluded from the segmentation (Fig. 2C,D). 3-D virtual models of the calcaneus and HFP were generated from the stacked segmented images. The 3-D models were slightly smoothed and exported in a stereolithography format (STL).
Fig. 2.
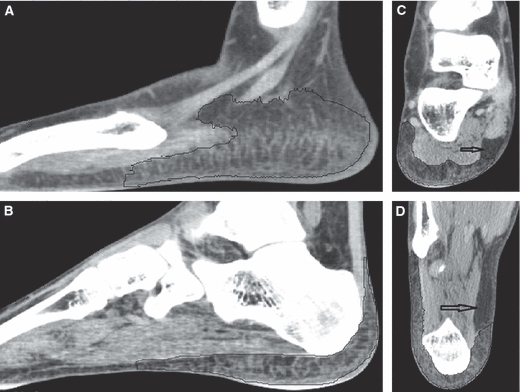
HFP segmentation. (A,B) HFP segmentation (inside the black line) on sagittal slices. As a clear line separating the HFP and hypodermis could not be clearly defined, segmentation of the HFP side walls is uncertain (A). In contrast, the segmentation of the HFP beneath the calcaneus was easily performed (B). (C,D) Unstructured (arrow) fat of the heel. The unstructured fat is located in the antero-medial side of the rear foot. (C) Coronal view. (D) Axial view.
Data processing
The STL files of the HFP and calcaneus were imported in rhinoceros 4.0 (Robert McNeel & Associates, Seattle, WA, USA). Axial and coronal sections were generated for the HFP and imported in matlab in comma-separated values file format (CSV) for morphological analysis.
HFP sections
Calcaneus maximum length and height were measured. Starting from the most posterior point of the calcaneus, 10 coronal planes (oriented as the CT coronal plane) were generated at intervals of 13% of the calcaneus length (Fig. 3A). HFP coronal sections were obtained by intersecting the HFP with those planes (Fig. 3B). Four axial planes (oriented as the CT axial plane) at intervals of 18% of the calcaneus height were created starting from the lowest point of the calcaneus (Fig. 3C). HFP axial sections were extracted only from the HFP posterior part (i.e. HFP up to the third coronal plane) as the intersection with the axial planes (Fig. 3D). A cloud of 500 points was generated for each section and the points related to all 10 coronal and four axial sections were exported in two different CSV files for the morphological analysis.
Fig. 3.
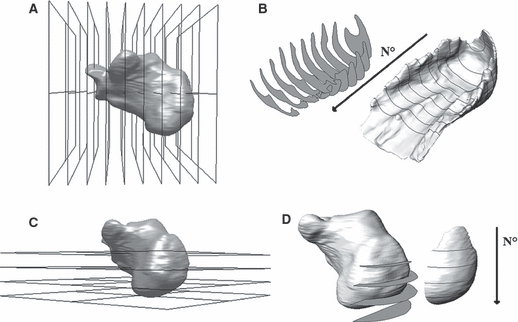
Generation of HFP sections. (A,B) Generation of coronal sections. (A) Identification of coronal planes. The step increment of 13% of calcaneus length was chosen to detect the plantar tuberosity of the calcaneus (i.e. the point where HFP thickness was measured in previous studies). (B) Extrapolation of HFP coronal sections. The coronal sections were numbered one to 10 starting from the most posterior section forward. (C,D) Generation of axial sections. (C) Identification of the axial planes. The step increment of 18% was chosen to detect the most posterior point of the calcaneus. (D) Extrapolation of HFP axial sections. To isolate the tissue behind the calcaneus, the posterior HFP was sectioned with the axial planes. The axial sections were numbered one to four starting from the most proximal section.
Morphological measures
CSV files were imported in matlab (The Mathworks Inc., Boston, MA, USA) to perform the morphological analysis. As HFP side walls were most likely subjected to errors during segmentation, these were excluded from the measurements of HFP thickness of the coronal sections and only the points inside 25–75% of each section width were considered for extrapolation of morphological parameters. For the axial sections we considered only the points inside 20–80% of each section width to isolate the analysis of the tissue strictly behind the calcaneus. However, all points of coronal and axial sections were considered for area measurements. HFP thickness was measured as a 1-D parameter in the coronal sections and as 2-D thickness (shortest 2-D Euclidean distance) for axial sections.
Results
The virtual 3-D models of the HFP exhibited a consistent morphology among the subjects (Fig. 4). The orientations of device and CT CSs differ by less than 1º, and the coronal and axial sections, determined as a percentage of the calcaneus length and height, identified the same qualitative portion of the HFP for all the subjects.
Fig. 4.
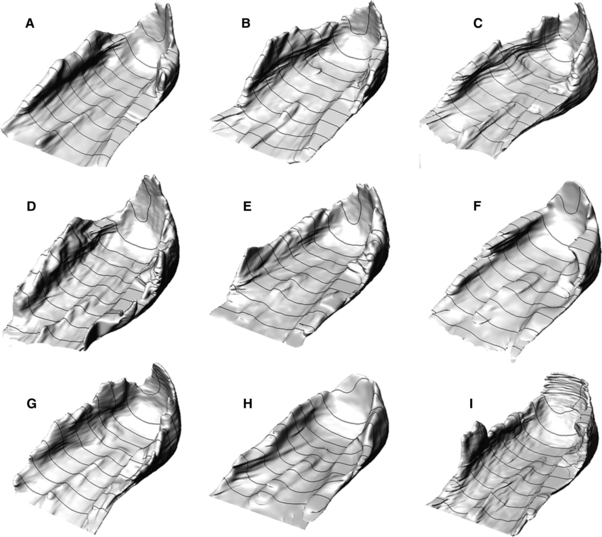
HFPs of the nine subjects of the study.
Coronal sections
The HFP was found to reach maximum area in the third, fourth and fifth coronal sections, with mean values of 11.4, 12.0, 11.6 cm2, respectively. For each section, the HFP area was bigger for males than for females (Table 2).
Table 2.
Female and male data
| Females | Males | |||||||||
|---|---|---|---|---|---|---|---|---|---|---|
| Coronal section No. | Area [cm2] | VCST [%] | CMT [cm] | CH [mm] | IECSTD [%] | Area [cm2] | VCST [%] | CMT [cm] | CH [mm] | IECSTD [%] |
| 1 | 9.1 (2.4) | - | - | - | - | 11.7 (2.9) | - | - | - | - |
| 2 | 9.1 (1.9) | 19 (3) | - | - | - | 12.4 (2.1) | 23 (11) | - | - | - |
| 3 | 10.0 (1.6) | 15 (6) | - | - | - | 13.3 (1.5) | 20 (7) | - | - | - |
| 4 | 10. 5 (1.9) | 17 (5) | - | - | - | 13.8 (1.8) | 23 (6) | - | - | - |
| 5 | 10.1 (2.3) | 20 (4) | 1.5 (0.2) | 0.8 (0.5) | 4 (2) | 13.4 (1.4) | 30 (13) | 1.7 (0.1) | 0.7 (1.0) | 0 (6) |
| 6 | 8.4 (1.8) | 20 (5) | 1.5 (0.2) | 1.9 (0.7) | 6 (5) | 11.2 (1.7) | 35 (3) | 1.7 (0.1) | 2.1 (0.9) | 0 (8) |
| 7 | 7.3 (1.4) | 30 (7) | 1.5 (0.2) | 3.0 (0.5) | 11 (9) | 9.5 (1.9) | 41 (11) | 1.7 (0.2) | 4.3 (1.3) | 8 (11) |
| 8 | 6.2 (1.1) | 43 (8) | 1.4 (0.1) | 4.5 (1.0) | 20 (10) | 8.1 (1.5) | 52 (11) | 1.6 (0.2) | 5.0 (0.2) | 17 (20) |
| 9 | 4.9 (1.2) | 48 (8) | 1.1 (0.1) | 3.5 (0.7) | 31 (6) | 6.7 (1.6) | 62 (12) | 1.5 (0.1) | 5.0 (0.1) | 25 (17) |
| 10 | 3.5 (0.6) | 55 (12) | 1.1 (0.2) | 3.6 (2.4) | 34 (11) | 5.1 (1.1) | 72 (9) | 1.4 (0.3) | 5.6 (1.9) | 29 (21) |
| Mean | - | - | 1.3 (0.2) | 2.9 (1.0) | 18 (7) | - | - | 1.6 (0.1) | 3.8 (0.9) | 14 (6) |
Values are means (SD).
VCST, percentual variation in the coronal section thickness; CMT, maximum thickness measured on the crest; CH, height of the crest obtained by subtracting the average thickness of each section from CMT; IECSTD, internal–external HFP thickness percentual difference. Higher values for the male group were found for all the data in the table except IECSTD.
The average thickness of each coronal section (ACST) was calculated for all subjects excluding the side walls (Fig. 5A). On average, ACST was maximal in the second section, with a mean value of 1.7 ± 0.3 cm (range: 1.3–2.2 cm), and it decreased in the subsequent sections (i.e. anterior) achieving a mean value of 0.8 ± 0.1 cm (range: 0.6–0.9 cm) in the 10th section (53% decrease). ACST decreased on average by 12% from the second to the third section, then remained roughly unchanged until the fifth section, and finally decreased by 14–20% from section to section. ACST values differ between males and females by about 1–3 mm (Fig. 5A).
Fig. 5.
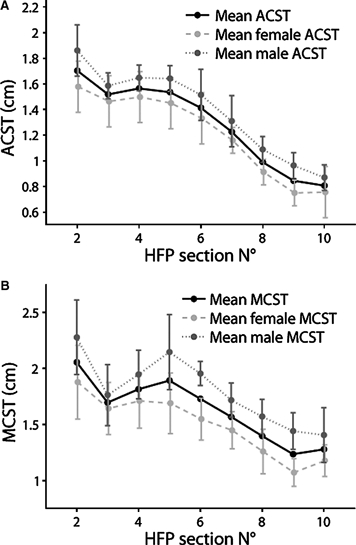
Comparison of coronal section thicknesses between males and females. (A) Average coronal section thickness (ACST, mean values) for males and females. (B) Maximum coronal section thickness (MCST, mean values) for males and females.
The maximum thickness of each coronal section (MCST) was also measured and mean values are reported in Fig. 5B. For all subjects, the HFP achieved its maximum value in the second section, where MCST averaged 2.1 ± 0.8 cm (range: 1.5–2.6 cm). For females, MCST of the second section averaged 1.9 ± 0.3 cm (range: 1.5–2.4 cm), whereas for males it averaged 2.3 ± 0.3 cm (range: 1.8–2.6 cm, Fig. 5B). The location of MCST points for each section differed between subjects (Table 3). For the last four sections MCST was always located on the crest; for the other sections MCST location changed and it was almost always located on the border of the selected coronal sections (Fig. 6A), suggesting that the real MCST may be located outside our selection.
Table 3.
Locations of the maximum and minimum HFP thickness points on the coronal sections
| MCST | MiCST | |||||||||||||||||
|---|---|---|---|---|---|---|---|---|---|---|---|---|---|---|---|---|---|---|
| Subjects | Subjects | |||||||||||||||||
| Coronal Section N° | A | B | C | D | E | F | G | H | I | A | B | C | D | E | F | G | H | I |
| 2 | L | L | M | L | L | M | M | L | L | CE | CE | CE | M | M | CE | CE | CE | CE |
| 3 | M | M | L | M | L | L | L | L | L | CE | CE | CE | M | M | CE | M | M | M |
| 4 | M | L | M | M | M | M | L | M | L | CE | M | L | M | M | CE | M | CE | L |
| 5 | L | M | M | M | M | M | M | L | L | M | M | L | M | M | M | M | CE | M |
| 6 | L | M | M | C | C | M | M | M | C | M | M | L | M | M | M | M | CE | M |
| 7 | C | C | C | C | C | C | C | C | C | M | M | L | M | M | M | M | M | M |
| 8 | C | C | C | C | C | C | C | C | C | M | M | M | M | M | M | M | M | M |
| 9 | C | C | C | C | C | C | C | C | C | M | M | M | M | M | M | M | M | M |
| 10 | C | C | C | C | C | C | C | C | C | M | M | M | M | M | M | M | M | M |
MiCST, minimum thickness of the coronal section. MCST, maximum thickness of the coronal section.
MCST and MiCST were located on the HFP medial (M), lateral (L), central (CE) sides and on the crest (C). Medial and lateral HFP sides are defined with respect to the foot longitudinal axis (FLA).
Fig. 6.
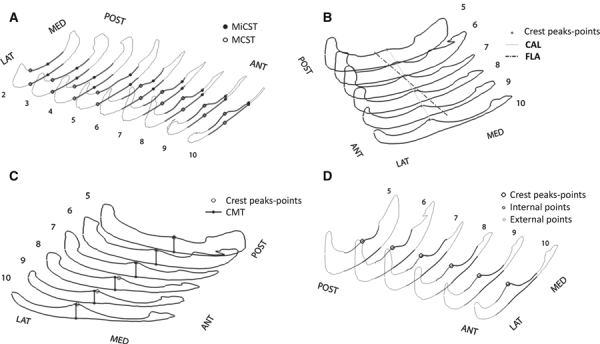
HFP qualitative data. (A) Localization of the points defining maximum and minimum coronal section thicknesses (MCST and MiCST). (B) Representation of the crest approximating line (CAL) with respect to the foot longitudinal axis (FLA). (C) Representation of the points defining the crest maximal thickness (CMT) with respect to the points of the crest peaks. (D) Measurement of the HFP thickness on the internal and external sides.
The minimum thickness of each coronal section (MiCST) was also measured. Points of MiCST were more consistently localized in the central part of the HFP for the second and third coronal sections, averaging 1.4 ± 0.2 cm (range: 1.1–1.6 cm), whereas they were located more medially for the other sections (Table 3). Percentage differences between MCST and MiCST values were calculated to describe the variability of HFP thickness inside each section (VCST, Table 2). Mean differences between MCST and MiCST of 0.5, 0.3 and 0.4 cm were found inside the second, third and fourth sections, respectively, corresponding to VCST values of 22, 18 and 21%. A major difference from 0.5 to 0.9 cm was found for the most anterior sections, with VCST values of 25–70%. These results suggested that the thickness inside each coronal section is more homogeneous for the posterior than for the anterior sections.
To compare the results of our study with previous studies, we measured the HFP thickness in he proximity of the plantar tuberosity of the calcaneus located on the third coronal section. We found a mean thickness of 1.4 ± 0.2 cm (range: 1.1–1.6 cm) and 1.5 ± 0.1 cm (range: 1.3–1.6 cm) for females and males, respectively.
Crest
The dorsal HFP surface exhibited a crest that has not been described previously in the literature. It appeared from the fifth coronal section and proceeded beyond the 10th section. A linear regression was used to fit the sets of crest peak points on each coronal section (Fig. 6B). The resulting crest approximating line (CAL) best represents the direction of the crest with an average coefficient of determination (R2) of 0.93. CAL starts on the medial area of the fifth section and moves in the antero-lateral direction of the foot, forming a mean angle of 13.5 ± 2.5° (range: 10.2–17.1°) with FLA. Grouping the data for sex, the resulted CAL-FLA angle became more consistent and averaged 11.8 ± 1° (range: 10.2–12.8°) for females and 15.7 ± 2.1° (range: 12.5–17.1°) for males.
The crest maximal thickness (CMT) was calculated for each section and the values found were very close to the overall MCST of the seventh, eighth, ninth and 10th sections for all subjects. CMT values were not necessarily achieved on the peak points of the crest (Fig. 6C) and they generally decreased proceeding from the posterior to the anterior sections, with an average 25% decrease from the fifth to the 10th coronal section. CMT for all five coronal sections averaged 1.3 ± 0.2 cm (range: 1.0–1.9 cm) for females and 1.7 ± 0.1 cm for males (range, 1.0–2.1 cm), with an average of 1.5 ± 0.2 cm (range: 0.9–2.1 cm) for the overall subject population (Table 2).
The height of the crest (CH) was measured by subtracting the CMT from the ACST of each section to obtain measures of the crest independent of the thickness of the coronal sections. For all subjects, CH increased from the fifth to the 10th section, from a mean value of 0.8 mm to 4.5 mm. Higher values were measured for males than females, with mean CHs of 3.8 and 2.9 mm, respectively (Table 2).
Finally, we calculated the average HFP thickness on both sides of the crest. For this measurement we referred to the external and internal HFP sides with respect to CAL, and to the medial and lateral HFP sides with respect to FLA (Fig. 6D). The percentual difference between the average thickness of the internal and the external sides of the HFP was calculated for each coronal section (IECSTD) and mean values for males and females are reported in Table 2. The HFP external side was 2, 3 and 10% thicker than the internal side for the fifth, sixth and seventh sections, respectively, whereas it was 19, 28 and 32% thicker for the eighth, ninth and 10th sections, suggesting that the anterior HFP is thicker in its external than its internal side.
Axial sections
HFP axial section areas were measured and are reported in Table 4. The area values strongly increased from the first section, averaging 1.3 ± 0.5 cm2 (range: 0.6–2 cm2), to the fourth section, averaging 5.7 ± 1.3 cm2 (range: 3.9–7.6 cm2).
Table 4.
Axial section data
| Axial Section No. | Area [cm2] | AAST [cm] | MAST [cm] |
|---|---|---|---|
| 1 | 1.3 (0.5) | 0.5 (0.1) | 0.6 (0.1) |
| 2 | 3.6 (1.1) | 0.7 (0.2) | 0.8 (0.2) |
| 3 | 5.7 (1.4) | 1.1 (0.2) | 1.3 (0.2) |
| 4 | 5.7 (1.3) | 1.1 (0.2) | 1.6 (0.2) |
Values are means (SD).
AAST, average thickness of the axial section; MAST, maximum thickness of the axial section.
The average and the maximum thickness of each axial section (AAST and MAST) were also calculated (Table 4, Fig. 7A). Maximum values for AAST were found on the third and fourth sections, with mean values of 1.1 ± 0.2 cm2. MAST on the third and fourth sections averaged 1.3 ± 0.2 cm2 and 1.6 ± 0.2 cm2, respectively. Only slight differences in area, AAST (Fig. 7B) and MAST values between males and females were noted.
Fig. 7.
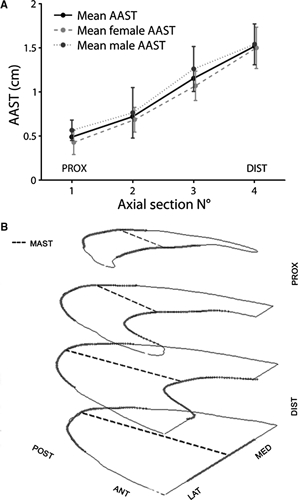
HFP axial section data. (A) Localization of the points of maximum axial section thickness (MAST). (B) Comparison of the average axial section thickness (AAST) in males and females.
Discussion
HFP thickness has been considered the strongest structural predictor of plantar pressure under the heel (Cavanagh et al. 1997). Changes in HFP thickness have been reported as a determining factor for heel pain, which can cause total disability for the working population and may jeopardize employment or professional athletic careers (Baxter & Thigpen, 1984). The assessment of healthy, unloaded, 3-D HFP morphology may help to understand its possible morphological modifications due to factors such as aging, obesity and various clinical conditions. The knowledge of HFP morphology may contribute in guiding the surgical reconstruction of the pad beneath the heel and also in the improvement of footwear design. Finally, it may help in developing a correct HFP geometry for FEM models of the foot. However, no previous studies have described HFP morphology in situ. In the present study, we obtained a set of 1- and 2-D morphometrical measurements on nine virtual models of HFP reconstructed from CT scans. We developed a methodological approach that maximizes reliability and repeatability of the measures by building a device to lock the foot in a neutral position with respect to the CT scan planes during image acquisition. The HFP exhibited a consistent and sophisticated morphology that may reflect the biomechanics of the foot support. The HFP was found to have a crest on its anterior dorsal surface, flanges on the sides and posteriorly, and a thick portion that reached and covered the posterior surface of the calcaneus and the achilles tendon insertion. Its anterior internal portion was thinner and a lump of fat was consistently present in this region (Fig. 8A). In addition, the HFP was thicker in males than in females.
Fig. 8.
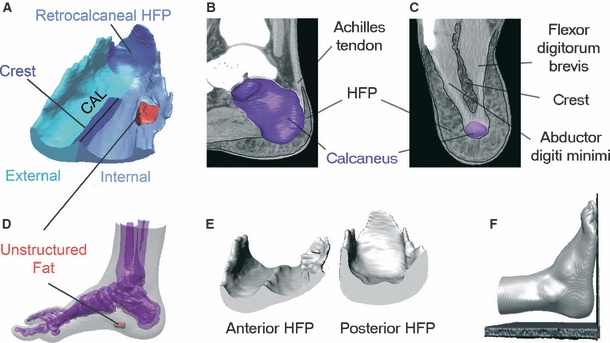
Findings of the study. (A) Representation of the HFP morphological peculiarities. (B) Spatial relationship between the retrocalcaneal HFP and the achilles tendon insertion. (C) HFP crest is located between the flexor digitorum brevis and the abductor digiti minimi. (D) The unstructured fat area is located on the antero-medial side of the heel, close to the foot arch. (E) HFP thickness is more homogeneously distributed on the posterior rather than on the anterior side. (F) Only slight foot plantarflexion was necessary to leave the heel unloaded during the CT scan.
HFP thickness measured behind the plantar tuberosity of the calcaneus has been reported to be about 1.5 cm in healthy young persons (Prichasuk et al. 1994; Hsu et al. 1998, 2007; Zheng et al. 2000). This result is close to the thickness of 1.43 cm found in this study. Higher values for HFP thickness of up to 1.8 cm have also been reported in literature (Gooding et al. 1985; Prichasuk, 1994; Uzel et al. 2006). However, we believe that variability in the positioning of the foot during the examination may have affected the results. We estimated that with a difference of 5º or 10º degrees of dorsi-plantar flexion on the preorientation of the foot, HFP thickness measurements on the plantar calcaneal tuberosity changes by 8 or 10%, respectively.
The HFP is commonly defined as the pad beneath the heel; however, the present study showed that the HFP achieves considerable thickness even behind the calcaneus. The retrocalcaneal HFP covers the posterior surface of the calcaneus from its basis up to 54% of its height with considerable thickness (AAST = 1.1 cm). The function of the retrocalcaneal HFP may be related to the protection of the achilles tendon insertion that is located between the calcaneus and the retrocalcaneal HFP (Fig. 8B). Jorgensen reported on three cases in which achillodynia could be explained by loss of heel pad shock absorbency capability and all patients were successfully treated with added external heel shock absorption (Jorgensen, 1985). Although in the study only the HFP beneath the calcaneus was implicated in the development of achillodynia, we suggest that altered properties of the retrocalcaneal HFP may contribute to the development of inflammation. Shoe counters can be responsible for stress in the posterior part of the calcaneus and HFP may help to protect the achilles tendon from excessive stress. Further studies on barefoot populations are needed to test this hypothesis.
The 3-D morphology of the crest found on the dorsal HFP surface was described in this study for the first time. However, an indentation between the medial and lateral compartments of the plantar foot was shown previously by dissection by Ling & Kumar (2008). The crest was also depicted in images obtained with a 3-Tesla MRI by Reach et al. (2007). The crest is located between the abductor digiti minimi and the flexor digitorum brevis of the foot (Fig. 8C) and can reach a height of 0.5 cm in the anterior HFP. CAL seemed directed along the calcaneus longitudinal axis rather than the FLA, which one would expect given the protective role of the HFP on the calcaneus. The crest appears to be continuous with the intermediate septum that separates the medial and the lateral plantar compartments. This septum serves as a passage to vessels and nerves towards the HFP. It may also serve as a firm anchor to the anterior portion of the HFP. Thus, the crest would be important in creating a lateral fat compartment which could be critical for the transfer of weight from the heel to the forefoot during the stance phase of gait. In addition, we speculate that the crest may optimize HFP structure to prevent the medio-lateral sliding of the pad during locomotion. Further studies are required to investigate whether crest morphology changes with athletic activity, as it is located between two muscles.
The study showed that anterior and posterior HFPs have a different morphology. Posterior HFP has a roughly homogeneous thickness along each coronal section, whereas anterior HFP has an asymmetric structure with a thicker external side (vs. internal side, Fig. 8E). This difference can be explained by considering the phases of gait cycle. During heel strike, the load is located centrally on the heel, which explains the more homogeneous HFP thickness on the posterior sections. During the subsequent midstance phase, the weight shifts from the posterior to the forefoot through the heel. In this phase, the foot begins to roll forward with a position of supination. Hence, as during the gait cycle the heel is loaded only when the foot is performing supination, and therefore an inhomogeneous thickness, with a thicker HFP external side, may be an optimization in response to the lateral loads commonly sustained by the heel. It would be interesting to investigate HFP internal and external thickness on overpronators and oversupinators.
A further finding of the study is the presence of an unstructured area of fat in the antero-medial side of the heel close to the foot arch (Fig. 8D). Although being located inside the HFP, this fat did not show the connective septae, thus appearing to be unstructured. We hypothesize that unstructuring of the fat may be the consequence of the absence of loading during the gait cycle (given its position). To test this, one could assess whether the unstructured area is also present in subjects with flat feet, where the arch is always in contact with the ground and the arch is loaded.
Limitations to our methodological approach (e.g. in the positioning of the foot with respect to the CT CS) should be acknowledged. First, a slight plantarflexion of the foot was caused by the lift of the hindfoot to keep the heel unloaded (Fig. 8F). We estimated that the plantarflexion is < 2º, which affected the HFP thickness measurements by about 2%. Secondly, because the midpoint between the malleoli was difficult to determine during the CT scan, there was a slight alignment of FLA with the FB axis. We estimated that adduction was < 3º and affected the HFP thickness measurements by about 1%. Importantly, the methodological approach used for this study ensured the enhanced repeatability, reproducibility and reliability of the data. It can be applied to explore the HFP 3-D morphology in loaded condition and its possible morphological changes with aging, athletic activity and various clinical conditions.
Acknowledgments
The authors acknowledge Regione Veneto for the financial support provided in the project ‘Innovative Shoes’ in which the present study was developed. We also wish to thanks Dr. Eleonora Grandi for valuable help in drafting of the manuscript, Andrea Borin for the construction of the leg/foot device, and Stefano Morotti, MS, for his precious suggestions in data processing and in figure arrangements.
Author contributions
Valentina Campanelli: concept/design, acquisition of data, data analysis/interpretation, drafting of the manuscript; Massimiliano Fantini: concept/design, data analysis, critical revision of the manuscript; Niccolò Faccioli: acquisition of data, data analysis; Alessio Cangemi: acquisition of data; Antonio Pozzo: critical revision of the manuscript; Andrea Sbarbati: concept/design, interpretation of data, critical revision of the manuscript, approval of the article.
References
- Baxter DE, Thigpen CM. Heel pain – operative results. Foot Ankle. 1984;5:16–25. doi: 10.1177/107110078400500103. [DOI] [PubMed] [Google Scholar]
- Cavanagh PR, Morag E, Boulton AJ, et al. The relationship of static foot structure to dynamic foot function. J Biomech. 1997;30:243–250. doi: 10.1016/s0021-9290(96)00136-4. [DOI] [PubMed] [Google Scholar]
- Falsetti P, Frediani B, Acciai C, et al. Heel fat pad involvement in rheumatoid arthritis and in spondyloarthropathies: an ultrasonographic study. Scand J Rheumatol. 2004;33:327–331. doi: 10.1080/03009740410005395. [DOI] [PubMed] [Google Scholar]
- Gooding GA, Stress RM, Graf PM, et al. Heel pad thickness: determination by high-resolution ultrasonography. J Ultrasound Med. 1985;4:173–174. doi: 10.7863/jum.1985.4.4.173. [DOI] [PubMed] [Google Scholar]
- Gooding GA, Stess RM, Graf PM, et al. Sonography of the sole of the foot. Evidence for loss of foot pad thickness in diabetes and its relationship to ulceration of the foot. Invest Radiol. 1986;21:45–48. [PubMed] [Google Scholar]
- Hsu TC, Wang CL, Tsai WC, et al. Comparison of the mechanical properties of the heel pad between young and elderly adults. Arch Phys Med Rehabil. 1998;79:1101–1104. doi: 10.1016/s0003-9993(98)90178-2. [DOI] [PubMed] [Google Scholar]
- Hsu CC, Tsai WC, Wang CL, et al. Microchambers and macrochambers in heel pads: are they functionally different? J Appl Physiol. 2007;102:2227–2231. doi: 10.1152/japplphysiol.01137.2006. [DOI] [PubMed] [Google Scholar]
- Hsu CC, Tsai WC, Hsiao TY, et al. Diabetic effects on microchambers and macrochambers tissue properties in human heel pads. Clin Biomech (Bristol, Avon) 2009;24:682–686. doi: 10.1016/j.clinbiomech.2009.06.005. [DOI] [PubMed] [Google Scholar]
- Ikuta Y, Murakami T, Yoshioka K, et al. Reconstruction of the heel pad by flexor digitorum brevis musculocutaneous flap transfer. Plast Reconstr Surg. 1984;74:86–96. doi: 10.1097/00006534-198407000-00012. [DOI] [PubMed] [Google Scholar]
- Jorgensen U. Achillodynia and loss of heel pad shock absorbency. Am J Sports Med. 1985;13:128–132. doi: 10.1177/036354658501300209. [DOI] [PubMed] [Google Scholar]
- Kao PF, Davis BL, Hardy PA. Characterization of the calcaneal fat pad in diabetic and non-diabetic patients using magnetic resonance imaging. Magn Reson Imaging. 1999;17:851–857. doi: 10.1016/s0730-725x(99)00019-3. [DOI] [PubMed] [Google Scholar]
- Levy AS, Berkowitz R, Franklin P, et al. Magnetic resonance imaging evaluation of calcaneal fat pads in patients with os calcis fractures. Foot Ankle. 1992;13:57–62. doi: 10.1177/107110079201300202. [DOI] [PubMed] [Google Scholar]
- Ling ZX, Kumar VP. The myofascial compartments of the foot: a cadaver study. J Bone Joint Surg Br. 2008;90:1114–1118. doi: 10.1302/0301-620X.90B8.20836. [DOI] [PubMed] [Google Scholar]
- Luo G, Houston VL, Garbarini MA, et al. Finite element analysis of heel pad with insoles. J Biomech. 2011;44:1559–1565. doi: 10.1016/j.jbiomech.2011.02.083. [DOI] [PubMed] [Google Scholar]
- Miller-Young JE, Duncan NA, Baroud G. Material properties of the human calcaneal fat pad in compression: experiment and theory. J Biomech. 2002;35:1523–1531. doi: 10.1016/s0021-9290(02)00090-8. [DOI] [PubMed] [Google Scholar]
- Morag E, Lemmon DR, Cavangh PR. What role does plantar soft tissue stiffness play in determining peak pressure under the heel? Gait Posture. 1997;5:164–164. [Google Scholar]
- Prichasuk S. The heel pad in plantar heel pain. J Bone Joint Surg Br. 1994;76:140–142. [PubMed] [Google Scholar]
- Prichasuk S, Mulpruek P, Siriwongpairat P. The heel-pad compressibility. Clin Orthop Relat Res. 1994;300:197–200. [PubMed] [Google Scholar]
- Reach JS, Jr, Amrami KK, Felmlee JP, et al. Anatomic compartments of the foot: a 3-Tesla magnetic resonance imaging study. Clin Anat. 2007;20:201–208. doi: 10.1002/ca.20381. [DOI] [PubMed] [Google Scholar]
- Silver DA, Kerr PS, Andrews HS, et al. Heel pad thickness following calcaneal fractures: ultrasound findings. Injury. 1994;25:39–40. doi: 10.1016/0020-1383(94)90182-1. [DOI] [PubMed] [Google Scholar]
- Sopher R, Nixon J, McGinnis E, et al. The influence of foot posture, support stiffness, heel pad loading and tissue mechanical properties on biomechanical factors associated with a risk of heel ulceration. J Mech Behav Biomed Mater. 2011;4:572–582. doi: 10.1016/j.jmbbm.2011.01.004. [DOI] [PubMed] [Google Scholar]
- Uzel M, Cetinus E, Ekerbicer HC, et al. Heel pad thickness and athletic activity in healthy young adults: a sonographic study. J Clin Ultrasound. 2006;34:231–236. doi: 10.1002/jcu.20230. [DOI] [PubMed] [Google Scholar]
- Wang CL, Shau YW, Hsu TC, et al. Mechanical properties of heel pads reconstructed with flaps. J Bone Joint Surg Br. 1999;81:207–211. doi: 10.1302/0301-620x.81b2.9056. [DOI] [PubMed] [Google Scholar]
- Yucel A, Senyuva C, Aydin Y, et al. Soft-tissue reconstruction of sole and heel defects with free tissue transfers. Ann Plast Surg. 2000;44:259–268. doi: 10.1097/00000637-200044030-00003. discussion 268-9. [DOI] [PubMed] [Google Scholar]
- Zheng YP, Choi YK, Wong K, et al. Biomechanical assessment of plantar foot tissue in diabetic patients using an ultrasound indentation system. Ultrasound Med Biol. 2000;26:451–456. doi: 10.1016/s0301-5629(99)00163-5. [DOI] [PubMed] [Google Scholar]


