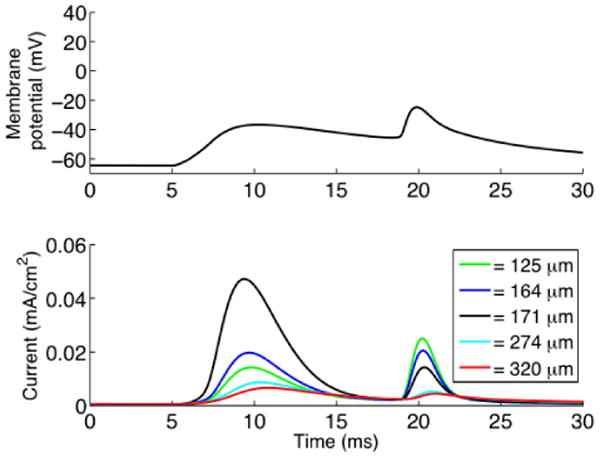
Fig. 4.

Distance-dependent KA activation. The top graph shows the membrane potential at input site (171μm from soma) with a 92% level of synchronous input. The first event is the EPSP and second is the backpropagating action potential. The bottom graph shows the current through the KA channel. The current was measured at five different locations 125μm, 164μm, 171μm, 247μm and 340μm from the soma.
