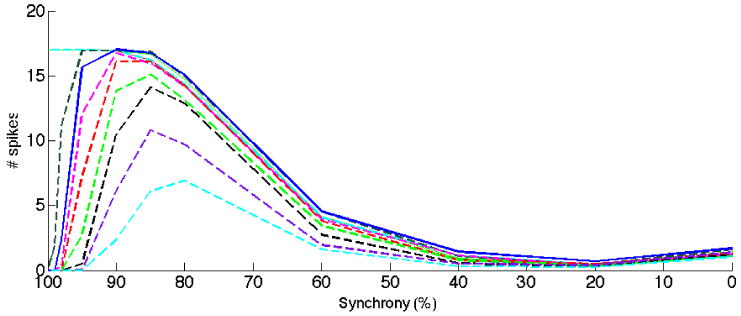
Fig. 5.

The selectivity to synchronized input varies when KA dynamics is modified. The inactivation time constant was changed representing modulatory influences of e.g. auxillary proteins. As in figure 1, the solid blue curve is the result with standard values of KA. The magenta, red, light green, black purple and cyan curves represent decreasing inactivation time constant in steps of 1ms. Dark green and solid cyan curves represent increasing inactivation time constant in steps of 1ms. Note the significant difference in reduction of synchronized input, effectively covering the interval 95-80%.
