

Abstract
Neurons sum their input by spatial and temporal integration. Temporally, presynaptic firing rates are converted to dendritic membrane depolarizations by postsynaptic receptors and ion channels. In several regions of the brain, including higher association areas, a majority of firing rates are low. For rates below 20 Hz the ionotropic receptors AMPA and NMDA will not produce effective temporal summation. We hypothesized that depolarization mediated by transient receptor potential (TRP) channels activated by metabotropic glutamate receptors would be more effective due to their slow kinetics. Based on voltage-clamp and current-clamp recordings from a rat slice preparation, we constructed a computational model of the TRP channel and its intracellular activation pathway, including the metabotropic glutamate receptor. We show that synaptic input frequencies down to 3-4 Hz and inputs consisting of as few as 3-5 pulses can be effectively summed. We further show that the time constant of integration increases with increasing stimulation frequency and duration. We suggest that the temporal summation characteristics of TRP channels may be important at distal dendritic arbors where spatial summation is limited by the number of concurrently active synapses. It may be particularly important in regions characterized by low and irregular rates.
Keywords: mGluR, dendritic integration, entorhinal cortex, computational model, integration time constant
1. Introduction
High frequencies, as reflected by gamma oscillations 40-80 Hz as well as burst mode neuronal firing, have been extensively discussed in relation to cognitive processing. The majority of spikes, however, are fired at considerably lower rates. Rates of 8-13 Hz were observed in non-human primate prefrontal cortex (PFC) during a categorization task (Freedman et al., 2001) and rates as low as 1-5 Hz were found in human amygdala during a recognition task (Fried et al., 1997). In entorhinal cortex (EC), rodent in vivo behavioural studies show neuronal activities around 7 Hz during open platform food-search (Jeffery et al., 1995) and around 8-13 Hz during delay match-to-sample tasks (Young et al., 1997). Moreover, pyramidal neurons receive a majority of their synaptic input at distal thin dendrites, where synaptic integration is supported by the generation of dendritic spikes (Larkum et al., 2009). This spike generation may require inputs to arrive within a 40 μm segment (Polsky et al., 2004), implying that spatial synaptic integration may be limited. Consequently, mechanisms of temporal integration are necessary.
From the rates discussed above, which may have a mean around 8 Hz, it follows that synaptic inputs have interspike intervals of 120 ms or more. NMDA synapses have a decay time constant of 150 ms (Destexhe et al., 1998). Moreover, for low input rates, depolarization may not be strong enough to remove the NMDA Mg-block. In that case, the effective EPSP decay time constant is guided by the kainate/AMPA decay time constant of about 5 ms (Destexhe et al., 1998). If the dendrite membrane time constant exceeds 5 ms, the EPSP will be guided by this value instead. However, due to the contribution of synaptically and modulatory activated conductances, the membrane time constant will presumably be below the in vitro values around 25 ms. Thus, since ionotropic synaptic transmission will not be effective for summation at low frequencies, we decided to study effects downstream of metabotropic glutamate receptors (mGluR), known for their slow dynamics.
mGluRs are located peri- and extrasynaptically (Lujan et al., 1996) and in several regions, synaptic mGluR activation results in a slow EPSP mediated by TRP channels (Batchelor et al., 1994; Congar et al., 1997; Batchelor & Garthwaite, 1997; Tempia et al., 1998; Partridge & Valenzuela, 1999; Tempia et al., 1998; Strubing et al., 2001; Kim et al., 2003; Bengtson et al., 2004; Faber et al., 2006; Yoshida et al., 2008; Riccio et al., 2009). These studies, however, typically used one or a small number of stimulation frequencies, commonly at high frequencies of 50-100 Hz, and thus do not provide detailed information on low-frequency activation.
We were interested in studying the TRP-channel mediated depolarization from synaptic activation at low frequencies of 1-10 Hz. We studied the TRP activation and time dependency at steady-state as well as transiently for a small fixed number of inputs. Since experimental dendritic recordings of synaptically generated events are challenging, we instead used computational modeling. We used data from our own experimental studies and published work to construct mGluR and TRP channel models. To our knowledge, the model presented here is the first to describe synaptically evoked TRP currents.
2. Methods
In several regions, synaptic activation of metabotropic glutamate receptors (mGluR) located peri- or extrasynaptically (Lujan et al., 1996) results in a slow EPSP originating from activation of a TRP channel. These slow EPSPs have been reported in the cerebellum (Batchelor et al., 1994, 1997; Kim et al., 2003), dopamine neurons in substantia nigra pars compacta (Bengtson et al., 2004), hippocampus CA1 (Congar et al., 1997; Partridge & Valenzuela, 1999; Strubing et al., 2001; Wyart et al., 2005), PFC (Fowler et al., 2007; Sidiropoulou et al., 2009) and lateral amygdala (Faber et al., 2006; Riccio et al., 2009). In previous work, we studied plateau potentials mediated by TRP channels in the entorhinal cortex (EC) layer V (Egorov et al., 2002; Fransén et al., 2006) and layer III (Tahvildari et al., 2007; Yoshida et al., 2008). The TRP channels in layer V have been identified as TRPC4/5 (Zhang et al., 2011), a subtype also found in several cortical and subcortical regions (Fowler et al., 2007). In the present work, we have studied synaptic activation of entorhinal cortex layer III neurons. We found EPSC decay kinetics to be similar to those of hippocampal pyramidal neurons (Wyart et al., 2005). Due to difficulties recording dendritic intracellular potentials at a location near a synaptic input, detailed information on the summation process is missing. This prompted us to investigate the summation properties utilizing computational modeling.
The model used is based on a morphologically reconstructed multi-compartment CA1 pyramidal cell model (Poirazi et al., 2003; http://senselab.med.yale.edu/modeldb/ShowModel.asp?model=20212) developed for the NEURON simulation environment. The dendritic tree contains a range of ionic conductances. The model has been used in several studies on different aspects of dendritic processing and was therefore selected as a starting point for this work. As mentioned above, hippocampal CA1 neurons possess TRP channels. Hippocampus displays expression of TRPC4/5 (Fowler et al., 2007) and synaptic activation of TRP/cationic currents have been studied by Congar et al. (1997), Partridge & Valenzuela (1999), and Wyart et al. (2005). The activation of TRP/cationic currents has also been studied using bath application of mGluR agonists (Crepel et al., 1994; Congar et al., 1997; Gee et al., 2003; Wyart et al., 2005).
One of the activation factors of the TRPC channels is calcium from voltage-gated calcium channels. These will be affected by the spatio-temporal integration of the membrane. A model with a detailed multi-compartment representation of the dendritic tree is therefore more adequate than a multi-channel single compartment model or a model with a passive tree. As our experimental recordings were performed in the soma and the location of the synapse and TRP channel is in the dendrite, a detailed model had the advantage of providing adequate dendritic filtering and thus produced somatic potentials that could be compared to the experimental ones. Filtering is further discussed in section 2.6. To verify our results, we also ran simulations using the model by Larkum et al. (2009) of a neocortical layer V pyramidal neuron. The results of using the Larkum model are presented in the section on parameter sensitivity analysis.
The spatial compartmentalization in the Poirazi model had been obtained from a digitized CA1 pyramidal neuron and contains 183 compartments. The following ion channels, described in a Hodgkin-Huxley formalism, were included: Na, NaP, CaR, CaT, CaL, Kdr, KA, KM, KCaBK, KCaslow, Kleak, h. To this model we added a metabotropic glutamate receptor model adapted from the metabotropic GABAB model by Destexhe & Sejnowski (1995) as well as a TRP channel model adapted from a CAN channel model by Destexhe et al. (1994). These components were placed on a dendritic compartment 143 μm from the soma, representing a synaptic contact at a medial dendritic location. The temperature parameter, 34 degrees C, was the same as in the original Poirazi model. The resting potential of the Poirazi model was changed from −70 mV to −60 mV to represent in vivo-like resting conditions rather than hyperpolarized in vitro conditions. One advantage of using in vivo conditions is that activation of calcium currents might be suppressed at in vitro potentials. We also blocked the calcium-dependent potassium currents KCaBK and KCaslow to avoid confounding contributions. One case where they are present is included (figure M7). The model has a soma membrane time constant of 18 ms for a small somatic hyperpolarizing current step. If a step is applied to a medial dendritic location, the membrane time constant of the dendrite is 15 ms and when measured in the soma it is 22 ms. Below is a detailed description of the TRP and mGluR model components and how their parameters were chosen. An overview of the added model components and their interactions is presented in figure M1.
Figure M7.
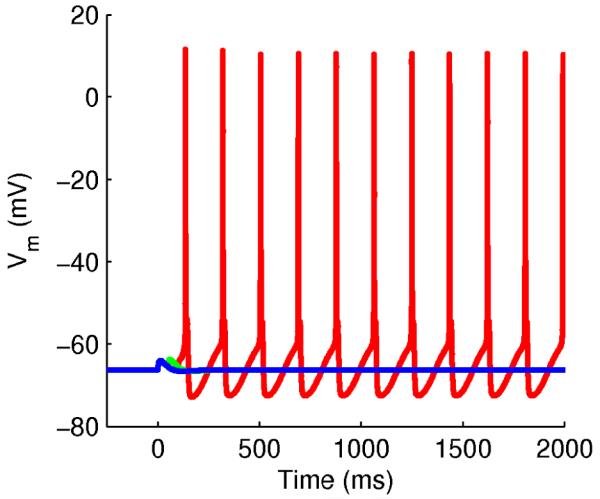
Synaptically induced persistent spiking plateaus. Persistent spiking at 5.4 Hz from stimulation by 3 pulses at 20 Hz (red). When only 1 (blue) or 2 (green) pulses are given, the cell does not spike. The model used for this simulation was based on the voltage-dependent activation model, but with the following changes: The TRP channel conductance was increased by a factor of 20 to model bath application of a muscarinic agonist or metabotropic glutamate agonist. Representing bath application also means that the unknown activation factor [x] had a fixed value. The BK channel was included and its conductance was increased a factor 20 compared to the original value used by Poirazi et al. (2003). The sAHP channel KCaslow, was also included and its conductance was set to the original value used by Poirazi et al. (2003). The AMPA and NMDA conductances were scaled a factor 7 to represent a stronger input to the dendrite.
Figure M1.

Model for mGluR-activated TRP current. Dashed box shows model components only included in the voltage-dependent activation (VDA) model. TRPC canonical transient receptor potential channel, [Glu] glutamate concentration, mGluR metabotropic glutamate receptor, Gq/11 G-protein q/11, PLC phospholipase-C, PIP2 phosphatidylinositol 4,5-bisphosphate, DAG diacylglycerol, IP3 inositol 1,4,5-triphosphate, iGluR ionotropic glutamate receptors (AMPA and NMDA), VGCC voltage-gated calcium channel.
2.1. Glutamate concentration model
We modeled the glutamate concentration following a single pulse at a perisynaptic location with a biexponential decay according to Hires et al. (2008) with a fast decay (100 ms) carrying 85 % of the amplitude and a slow decay (2100 ms) carrying 15 % of the amplitude (figure M2A). This resulted in a weighted time constant of 132 ms. Rise time of glutamate concentration was assumed instantaneous (Hires et al., 2008). Hires’ et al. (2008) results indicated the presence of temporal summation. Following their observation, we found that a summation of 300 % for 30 Hz and 200 % for 15 Hz could be obtained if we set Kglu to 0.9 and 0.85 respectively in the equation describing glutamate concentration, shown below. For our study, focusing on frequencies between 1-10 Hz, we chose Kglu = 0.8 (figure M3). The glutamate concentration amplitude was selected from glutamate diffusion modeling studies (Rusakov & Kullman, 1998) and experimental observations (Marcaggi et al., 2009) indicating an amplitude of 200 μM.
where [Glu] is the glutamate concentration and summation factor Kglu = 0.8.
Figure M2.

Glutamate and mGlu receptor kinetics. (A) mGlu receptor kinetics following a single synaptic activation as used in the simulations. (B) mGlu receptor kinetics following a single (square) glutamate pulse (Marcaggi et al., 2009).
Figure M3.

Temporal summation. Top: Glutamate concentration following a train of synaptic activations of 4 Hz (dashed) and 8 Hz (solid). Center: Corresponding mGlu receptor kinetics. Bottom: Corresponding calcium concentration.
2.2. mGlu receptor model
The mGlu receptor kinetics was modelled according to results obtained by Marcaggi et al. (2009), as shown in figure M2B. The receptor activation following a square pulse of glutamate follows a rise time constant of 20 ms and a decay time constant of 50 ms.
where R is the fraction of activated receptors, k1 = 0.035 and k2 = 0.02 are the forward and backward rates. Activation of the mGlu receptor leads to second messenger activation and subsequent production of an unidentified metabolite that activates the TRP channel. This signalling was modeled as
where [x] is the unknown signalling metabolite that activates TRP channels and G = R is the fraction of activated G-proteins.
2.3. TRP channel model
TRPC channels, as opposed to strictly calcium-gated CAN channels like TRPM4, require in addition to an increase in cytosolic calcium above baseline levels also activation of muscarinic or metabotropic glutamate receptors (Yan et al., 2009; Zhang et al., 2011); both converge on the PLC (phospholipase C) pathway. The mechanism of interaction between PLC and TRPC activation is not known, although a reduction in levels of PIP2 appears to be involved (Zhang et al., 2011). Awaiting further developments, we set the second messenger kinetics to follow that of the mGlu receptor. Kinetics is thereby determined on the one hand by the glutamate and mGluR modules described above and on the other hand by the TRP channel kinetics. The latter component must thus be seen as representing both the channel itself as well as its activating signalling pathway. The TRP model was based on the calcium-dependent CAN channel model by Destexhe et al. (1994). The original model included a calcium dependence of the rate constant α for a single activation gate m. The requirement of a combined PLC activation and a rise in cytosolic calcium indicates a multiplicative type of relationship between the two activating factors. We modeled this activation by including the factor ([x]) described above representing the mGluR/PLC activation in addition to calcium for the rate functions of the gate. The mGluR/PLC activation produces a shift in the calcium sensitivity analogous to what is found in the effects of capsaisin on TRPV1 and menthol on TRPM8 (Voets et al., 2004). In addition to the m gate, we added Mg-block type voltage dependence (figure M4A) modeled according to Zhang et al. (2011), similar to what was found by Strubing et al. (2001).
Figure M4.

Steady-state TRP channel activation. (A) Voltage dependence of TRP channel. (B) Steady-state conductance of the TRP channel versus mGluR-associated activation component for the voltage-independent activation (VIA) model. (C) Steady-state conductance of the TRP channel versus mGluR-associated activation component and calcium concentration for the voltage-dependent activation (VDA) model.
2.4. Kinetics of the TRP channel
The amplitude of the TRP current increases with stimulation frequency (Batchelor & Garthwaite, 1997; Tempia et al., 1998; Riccio et al., 2009) and with the number of stimuli (Batchelor et al., 1994; Congar et al., 1997; Tempia et al., 1998; Reichelt & Knöpfel, 2002; Kim et al., 2003; Faber et al., 2006). This suggests a dependency on temporal summation. The amplitude also increases with increasing stimulation intensity (Congar et al., 1997). This suggests a dependency on spatial summation, possibly a result of cooperative glutamate spillover.
In several studies, more than one time scale of TRP current decay rate is evident (Tempia et al., 1998; Kim et al., 2003; Faber et al., 2006; Riccio et al., 2009; Gross et al., 2009). We can identify a fast decay around 10 ms (Faber et al., 2006; Riccio et al., 2009; Gross et al., 2009), a medium decay around 200-300 ms (Batchelor et al., 1994; Wyart et al., 2005; Faber et al., 2006; Yoshida et al., 2008) and a slow decay around 2-3 seconds (Partridge & Valenzuela, 1999; Faber et al., 2006; Sidiropoulou et al., 2009; Gross et al., 2009). Analysis of our voltage-clamp data (figure 1C) gave a decay time constant of about 210 ms. Therefore we focused on the medium scale in this study. We did not find evidence for the fast time scale in our data. A smaller amplitude of the slow time scale was noticeable in our data, but was not included in the present study. We also estimated the amount of summation produced by 10 pulses at 20 Hz and used this in conjunction with the decay time when calibrating model parameters. The TRP model thereby produced a current with a decay rate consistent with our experimental findings.
Figure 1.

Synaptic activation of mGluR-mediated current in EC layer III pyramidal neuron. (A) Induced current during voltage clamp in control ringer solution (containing 2 mM atropine, 2 mM, kynurenic acid, 100 μM picrotoxin and 4 μM CGP55845) using 10 pulses at 20 Hz. (B) Induced current using blockers LY367385 100 μM and MPEP 20 μM, blocking mGluR1 and 5 respectively. (C) Voltage-clamp subtraction plot, (control − MPEP+LY367385) with constant resting current difference subtracted and normalized to unity. Red line indicates fit with single exponential. (D) Effect of TRP blocker SKF96365 (30 μM) (bottom) and control ringer containing 2 mM atropine (top) showing a reduced depolarization in the case with the blocker.
2.5. TRP channel activation
The sources of intracellular calcium activating TRP channels are subject to debate (Bianchi et al., 1999; Blair et al., 2009). Possible sources are voltage-gated calcium channels, IP3-induced release from ER and Ca influx from the TRPs themselves (Fowler et al., 2007). Blair et al. (2009) identified TRPs to be the major source. In Egorov et al. (2002), a major source was attributed to nifedipine-sensitive CaL-type channels, whereas Yan and coworkers (2009) identified CaT channels as sources. Gross et al. (2009) found activation from either stores or L-type calcium channels. In separate models we investigated two cases, one including activation originating from stores and another including both stores and voltage-gated calcium channels. While the former, hereafter referred to as the voltage-independent activation (VIA) model, depends solely on the chain of biochemical events and thus operates in open loop mode, the latter, hereafter referred to as the voltage-dependent activation (VDA) model, also includes a membrane potential dependency via the calcium channels and thereby possesses a positive feedback loop.
2.6. Voltage-independent activation of TRP
This model represents the modulatory activation of TRP channels via the synaptic glutamatergic activation of the mGluR/PLC pathway. The effect of downstream factors on TRP channels and of calcium released from internal stores is combined into one composite signal controlling TRP channel activation (figure M4B).
where iTRP is the TRP current, gbar = 32·10−3 is the maximum conductance, m is the gating variable, f(Vm) is the function describing the voltage dependence and Vm is the membrane potential.
where the reversal potential E = 0.
where m∞ is the steady-state gating parameter and τm is the activation time constant:
where α and β are the rate coefficients, β = 37.5·10−3,
where multiplication factor Kα = 0.57·103. The parameters were tuned to reproduce voltage-clamp data (figure 1C) in which synaptic stimulation with 10 pulses at 20 Hz produced a rise time of 90 ms and a decay time of 210 ms. In the model w e applied voltage clamp to the soma, as in the experiment, and tuned the TRP-kinetics until the somatic time constant was the same as the experimental value. Since we compared rise and decay time of model soma membrane potential to experimental recordings performed in the soma, dendritic space-clamp filtering of synaptic input (Spruston et al., 1993; Williams & Mitchell, 2008) was accounted for. When voltage clamp was applied to the dendrite, the decay time constant was 214 ms, a factor 1.02 larger than the somatic value. This small effect is consistent with the conclusions that the voltage clamp error is frequency dependent and that errors in the substantially faster NMDA kinetics would be substantially smaller than the errors of AMPA EPSPs (Spruston et al., 1993; Williams & Mitchell, 2008). As a positive control, we applied a pure AMPA input and observed that the somatic decay of 7 ms was a factor 2.2 slower than the dendritic. This value corresponds well to the experimentally measured factor of 2.2 and 1.8 for an input with 10 ms EPSC half width (Williams & Mitchell, 2008), and to the modeling result with a factor 2.4 for a EPSC half decay time of 5.7 ms (Spruston et al., 1993).
2.7. Voltage-dependent activation of TRP
In the subsequent model, voltage-dependent factors were also included (figure M4C). Experimental results in the entorhinal cortex indicated significant contributions for TRP activation from L-type calcium channels (Egorov et al., 2002). This channel provided a major component of the calcium influx for the voltage interval relevant to our study. The L-type model of the Poirazi model was used and calcium from these channels was set to affect TRP channels located in the same dendritic compartment (Gross et al., 2009). The half activation was set to −52 mV and the slope factor to −3 to account for the low-voltage activation reported for L-type Cav1.3 channels (Lipscombe et al., 2004).
where [Ca]i is the intracellular calcium concentration and calcium threshold Cath = 1.09·10−4. In this model, which was tuned to get a time course in accordance with current-clamp data (Yoshida et al., 2008), three parameter values differed from the voltage-independent activation model: Kα = 10·103; β = 7.5·10−3; gbar = 1.7·10−3. The procedure was analougos to the tuning in voltage clamp above, adapting the dendritic TRP-kinetics to get the same somatic EPSP time constant as was observed experimentally.
2.8. Synaptic input model
We also included depolarization from ionotropic synaptic receptors in the voltage-dependent model (figure M5A). The NMDA model was taken from Gasparini et al. (2004) and the rate constants K1 and K2 were changed to 0.5 and 0.05 respectively to follow the faster time course reported by Alonso et al. (1990). The AMPA model had a rise time constant of 1 ms and a decay time constant of 2 ms. In figure M5A we show a compound EPSP including a small GABAB component, the latter modeled according to Destexhe & Sejnowski (1995). In figure M5B we show the activation factors of the TRP channel during this input. Values for the relative contribution of the mGluR-associated depolarization reported in the literature range from 50 % (Yoshida et al., 2008), 45 % (Riccio et al., 2009), 33 % (Batchelor et al., 1994) to 16 % (Faber et al., 2006). Following these experimental results, the conductance of the mGluR component was set to 40 % of the ionotropic component. The decay of the EPSP amplitude from the synaptic location to the soma was a factor 3.2 (31% remaining) which is consistent with experimental observations of amplitude dampening (Magee & Cook, 2000, 76-26% remaining depending on input location).
Figure M5.

TRP channel kinetics. (A) Soma membrane potential following a single input for the combined TRP and ionotropic glutamatergic (solid), pure ionotropic glutamatergic (dashed) and mixed input including also a GABAB component (dash-dotted). (B) Activation input to TRP channel. mGluR-associated activation (solid green), Ca (solid blue), mGluR activation and Ca (solid red). When the TRP component is blocked Ca decays more rapidly (blue dotted). (C-E) Repetitive stimulation using 1 Hz (blue), 5 Hz (green), 9 Hz (red). Somatic membrane potential summation with TRP channel blocked (C) and TRP channel present (D). Dashed line in D illustrates calculation of average membrane potential at steady-state. (E) TRP current of case shown in D. The filled circle illustrates estimation of maximum current amplitude at steady-state. (F) Somatic membrane potential for 1, 2, 3 pulses at 10 Hz. Decay time constant estimated from peak to time point of closed circle. Panels A-E: VDA model. Panel F: VIA model.
The appearance of a bimodal peak in the EPSP in the absence of inhibitory GABAB input (figure M5A) is consistent with experimental findings (Batchelor et al., 1994; Kim et al., 2003; Hartmann et al., 2008). The degree to which the depolarization is split into two peaks depends primarily on the rising rate of the mGluR-associated depolarization relative to the hyperpolarizing contribution of GABAB. As our model focuses on slow temporal summation, factors influencing the rising and early portion of the EPSP are of lesser importance. The key factor is the decay constant of the depolarization.
In figure M5C-E we show the response to repetitive stimulation. The summation seen for 5 and 9 Hz with the TRP channel present (D) is much stronger than the summation with the TRP channel blocked (C). We also illustrate (F) how the decay time constant was estimated for three different number of pulses. The decay time constant was calculated from the time point of the peak from the last pulse to 37% of the peak value.
2.9. Pair-pulse paradigm
To study the membrane-potential summation, we used a pair-pulse paradigm (figure M6) where the peak of the second test stimulus was used to assess membrane potential savings. This pair-pulse summation depended on the inter-stimulus delay (ISD). The initial stimulus can be either a single pulse or, as we chose to use, a train of pulses at a particular frequency. ISD was measured as the interval between the last pulse in the train and the test pulse.
Figure M6.

Pair-pulse protocol. Example using ISD = 500 ms. (A) Control (single pulse). The amplitude of second (test) pulse is denoted A0. (B) Pulse train, 5 pulses at 4 Hz. Amplitude of test pulse is denoted A. Relative amplification is calculated as RPT = A/A0.
2.10. Persistent spiking
The current work has focused on the subthreshold dendritic depolarization from mGluR-mediated activation of TRP channels. Most studies of TRP-channel depolarization however have triggered post-spike depolarizations using somatic current injections in the presence of muscarinic or metabotropic glutamate agonists. In our own work, we have previously shown the occurrence of both short and very long-lasting plateaus of persistent spiking (Egorov et al., 2002; Fransén et al., 2006; Yoshida et al., 2008). We also showed that these suprathreshold plateaus could be induced by synaptic stimulation (Egorov et al., 2002; Yoshida et al., 2008). In figure M7 we show that the present model is capable of generating these persistent spiking plateaus as well. Following synaptic stimulation of 3 pulses at 20 Hz, and including the effects of mGluR-agonist bath application, the model produced suprathreshold spiking plateaus.
2.11. Experimental methods
Methods were identical to those described in Yoshida et al. (2008).
Slice preparation
All experimental protocols were approved by the Institutional Animal Care and Use Committee at Boston University. Long-Evans rats (postnatal days 21 to 27; Charles River, Wilmington, MA) were deeply anesthetized with ketamine/xylazine (95 mg/Kg ketamine and 2.8 mg/Kg xylazine) through intraperitoneal injection; the absence of both pedal and tail pinch reflex was confirmed. Ice-cold modified artificial cerebrospinal fluid (ACSF) containing (in mM) 110 choline chloride, 2.5 KCl, 1.25 NaH2PO4, 26 NaHCO3, 0.5 CaCl2, 7 MgCl2, 7 glucose, 3 pyruvic acid and 1 ascorbic acid (pH adjusted to 7.4 by saturation with 95% O2 - 5% CO2) was intracardially perfused. The brain was then removed from the cranium and placed in ice-cold modified ACSF. 350 μm-thick slices of the hippocampal-entorhinal region were cut near horizontally with a 30 degree offset (cutting more dorsal at more rostral regions) using a Vibroslicer (World Precision Instruments, Sarasota, FL, USA). Slices were transferred to a holding chamber, where they were kept submerged for over an hour at room temperature before recording. The holding chamber was filled with ACSF containing (in mM) 124 NaCl, 3 KCl, 1.25 NaH2PO4, 26 NaHCO3, 1.6 CaCl2, 1.8 MgSO4, 10 glucose (pH adjusted to 7.4 by saturation with 95% O2 - 5% CO2).
Electrophysiological recording
Slices were transferred to a submerged recording chamber and perfused with ACSF, maintaining the temperature between 33 to 35 °C for recordings. Patch pipettes were fabricated from borosilicate glass capillaries by means of a P-87 horizontal puller (Sutter Instrument, Novato, CA, USA). Patch pipettes were filled with intracellular solution containing (in mM) 120 K-gluconate, 10 HEPES, 0.2 EGTA, 20 KCl, 2 MgCl, 7 phosphocreatine-diTris, 4 Na2ATP and 0.3 TrisGTP (pH adjusted to 7.3 with KOH). The intracellular solution also contained 0.1 % biocytin for labeling. When filled with this solution, the patch pipettes had a resistance of 3–5 MΩ. Slices were visualized with an upright microscope (Zeiss Axioskop 2), equipped with a ×40 water-immersion objective lens, and a near-infrared charge-coupled device (CCD) camera (JAI CV-M50IR, San Jose, CA, USA). Locations of the cells in the slice were confirmed to be in the deep half of layer III of the medial EC by biocytin staining after recordings in 78 % of the cells used. Tight seals (>1 GΩ) were formed on cell bodies and the membrane was ruptured with negative pressure. Current-clamp recordings were made with a Multi Clamp 700B amplifier (Axon Instruments, Foster City, CA, USA). Signals were low-pass filtered at 5 kHz or 10 kHz and sampled at 10 kHz or 20 kHz, respectively, using Clampex 9.0 software (Axon Instruments, Foster City, CA, USA). Liquid junction potential of 10 mV was not corrected.
Synaptic stimulation was given by a clustered bipolar electrode placed in the angular bundle. The electrode had two wires fixed parallel to each other. The distance between its poles was 40 μm and the overall tip diameter was 80 μm. Duration of the stimulation pulse was 200 μs and intensity was 8 mA. On average, this stimulation produced EPSPs with a 5.0 mV peak amplitude in normal ACSF (without synaptic blockers); the same stimulus intensity was used for all other conditions. Distance from the tip of the stimulation electrode to the recorded neuron (measured in 37 slices in which we clearly saw marks of stimulation electrode and biocytin filled layer III cells) was 580 ± 17 μm ranging from 430 to 870 μm.
Chemicals
Stock solutions of atropine (2 mM, in water), CGP55845 (4 mM, in DMSO), MPEP (20 mM, in DMSO), LY367385 (100mM, in 1.1 eq. NaOH) and SKF96365 (30 mM, in water) were prepared and diluted more than a thousand times in the ACSF. Kynurenic acid and picrotoxin were directly dissolved in the ACSF. Chemicals were purchased from Sigma-Aldrich (St. Louis, MO, USA) and Tocris Bioscience (Ellisville, MO, USA).
Data analysis
Clampfit 9.0 (Axon Instruments, Foster City, CA, USA) and Matlab (MathWorks, Natick, MA, USA) were used for data analysis. To observe the EPSP induced by a single synaptic stimulation, the angular bundle was stimulated with single pulse at a membrane potential near the resting level (Yoshida et al., 2008, Fig. 2(c)).
3. Results
To evaluate the possible contribution of TRP channels to dendritic integration, we studied the depolarization produced in response to synaptic inputs of low frequencies. One or several synaptic inputs were applied to a dendritic branch located at a medial location. Summation of membrane potential was studied in the soma including amplitude as well as the time course of depolarization.
3.1. Experimental EPSC time course
In voltage-clamp experiments of layer III pyramidal neurons in rat entorhinal cortex, we studied the slow mGluR-induced EPSCs produced by synaptic stimulation in angular bundle (figure 1A, B). Decay time constants following a train of 10 pulses at 20 Hz were extracted from subtraction plots (figure 1C). The weighted average time constant was found to be 210 ms (n = 3, min = 203, max = 254). This can be compared to the decay of the EPSP in a previous study (Yoshida et al., 2008) with a time constant around 290 ms (fit of mean response, n=9). The block also produced a change in resting current, presumably from block of background mGluR activation of TRP channels and release from block of potassium currents. In the model, this constant current was included in the constant currents contributing to resting potential. Involvement of TRP channels was investigated using the TRP channel blocker SKF96365 (figure 1D). We observed a reduction in the depolarizing current in 3 out of 3 tested neurons. This supports the interpretation that a TRP current contributes to the depolarization studied.
3.2. Voltage-independent activation of TRP channels
To study the contributions to dendritic temporal integration from mGluR-mediated activation of TRP channels, voltage-independent activation of the TRP channel was studied in a first model. The voltage-dependent factors, including depolarization from ionotropic excitatory synaptic transmission and calcium from voltage-gated calcium channels, were added in a second model as described below.
As described in Methods, the model components were constructed from our own and other published data. The model included equations describing the glutamate concentration following a single synaptic release, mGlu receptor activation, and triggering of intracellular signalling and TRP-channel activation dynamics. As described in Methods, voltage-clamp data (exemplified in figure 1) was used to set the kinetics of the TRP channel and its associated signalling pathway. In figure 2, we show the TRP-channel current of the model (A) and resulting EPSP (B) recorded in the soma. The EPSC has a decay time of 120 ms (data not shown) and the EPSP has a decay time of 195 ms. The observations in the soma can be compared to the actual events in the dendrite. When voltage clamp was applied at the location of the synaptic input, the dendritic current had a decay time of 120 ms (data not shown) and when current clamp was applied the dendritic EPSP had a decay time of 129 ms. In the figure, as a comparison, we also show an EPSP from an ionotropic AMPA and NMDA receptor mediated synaptic activation illustrating the differences in time scale of the ionotropic and TRP EPSPs. Moreover, we find that the decay time constant of the TRP depolarization depends on the duration of the glutamate concentration, see below, consistent with experimental findings using glutamate uptake inhibitors (Congar et al., 1997; Reichelt & Knöpfel, 2002).
Figure 2.

Simulated slow mGluR-induced TRP channel-mediated depolarization produced by a single synaptic stimuli. The synaptic and TRP channel location is medial, 143 μm from the soma. (A) Model TRP channel current producing the slow depolarizaton in B. (B) Soma membrane potential (solid). For comparison, the time course of a pure ionotropic AMPA and NMDA receptor-mediated EPSP is also shown (dashed).
We became interested in studying the influence of this slow EPSP on membrane potential and particularly the temporal summation properties of neurons with dendrites possessing these mechanisms. In figure 3 we show, for a set of stimulating frequencies in the range 1-10 Hz, the results when the membrane potential reached steady-state. In A we show the peak current of the TRP channel and in B the average membrane potential. Illustrations on how peak currents and average membrane potentials were measured are shown in Methods (figure M5). In B we also show for comparison the summation of ionotropic receptor mediated EPSPs. As can be seen, the metabotropic-mediated depolarization is about 2.9 times larger than the ionotropic EPSP at these frequencies (B) even though the EPSP peak potential is only 1/ 2.5 of the ionotropic (figure 2B). Increasing depolarization amplitudes for increasing stimulation frequencies is consistent with experimental observations (Batchelor & Garthwaite, 1997; Tempia et al., 1998; Riccio et al., 2009). Depolarization also increases for an increasing number of inputs (figure M6), consistent with experimental observations (Batchelor et al., 1994; Congar et al., 1997; Tempia et al., 1998; Kim et al., 2003; Reichelt & Knöpfel, 2002; Faber et al., 2006).
Figure 3.

Frequency dependence of slow TRP depolarization. (A) Peak of TRP current for frequencies 1 – 10 Hz measured when average membrane potential has reached steady-state. (B) Average soma membrane potential at steady-state for frequencies 1 – 10 Hz. mGluR-induced depolarization (solid) and pure ionotropic depolarization (dashed). Note that despite the ratio 2.5:1 (amplitudes of figure 2B), the ratio of steady-state summation is 1:2.9. Frequency f = 0 indicates resting potential.
To further elucidate the factors contributing to membrane potential summation, we studied the effective time constant of the membrane potential. In figure 4A and 4B we show the decay time constant of the EPSP for different stimulus frequencies and durations. Illustrations on how time constants were measured are shown in Methods (figure M5). As can be seen, the decay time constant increased with both frequency and duration. In subsequent model analysis, we found that the decay time constant had a linear dependency on the peak glutamate concentration reached during synaptic activation (C).
Figure 4.

Kinetics of decay of slow TRP-mediated EPSP. (A) Decay time constant of the EPSP for frequencies in the interval 1 – 10 Hz shown for different number of pulses, N = 2 (blue), 3 (green) and steady-state (red). (B) Decay time constant of the EPSP depends on the duration of the stimulation. Frequencies f = 6 (blue), 8 (green) and 10 Hz (red). Note the relatively rapid rise where maximal response is attained within 300 ms. (C) Decay time constant τdecay of the EPSP is increasing with increasing amplitude of the glutamate concentration. Data points are well fitted with a linear function, τdecay = 91 + 103*max([Glu]). It may be noted that max([Glu]) can be calculated as a function of pulse train parameters N and f, as max([Glu]) = (CN−1)/(C−1), where C = Kglu * (0.85 * exp(−1000/(τ1*f)) + 0.15 * exp(−1000/(τ2 * f))). Kglu = 0.8, τ1 = 100 ms, τ2 = 2100. Kglu, τ1 and τ2 were approximated from Hires et al. (2008).
Measuring the decline of membrane potential by estimating a time constant is complicated by the fact that not all depolarizations evoked by mGluR activation of TRP channels follow a single exponential time course. Also the peak of the depolarization may show a complicated shape. An alternative for studying effective depolarization decay is to use a pair-pulse paradigm where the peak of the test stimulus is used to assess membrane potential summation. An advantage with this measure is that it reflects the core of summation – effects on present input from past inputs. This pair-pulse summation depends on the inter-stimulus delay (ISD). The initial stimulus can be either a single pulse or, as we choose to use, a train of pulses at a particular frequency. ISD was measured as the interval between the last pulse in the train and the test pulse (figure M6). Figure 5A shows the amplitude of the test pulse versus the ISD for varying frequencies (2, 6, 10 Hz) when the duration of the pulse train is long enough to reach steady-state (s-s). Frequency dependence is apparent and further explored in figure 5B, where the ISD is fixed to 150 ms, corresponding to a theta-burst type of input, or fixed to 500 ms. The number of stimuli in the pulse train (N) is varied (2, 3, 4, s-s/15). From figures 5A and B we can conclude that increasing stimulus frequency and/or duration lead to an increase in the amplitude of the test pulse.
Figure 5.

Pair-pulse and pair-train amplification. (A) EPSP amplitude of test pulse versus ISD, for frequencies f = 2 (blue), 6 (green), 10 Hz (red) and number of pulses N = steady-state. (B) EPSP amplitude of test pulse versus frequency, for ISD = 150 ms (solid) and 500 ms (dotted) and for N = 2 (blue), 3 (green), 4 (red) and steady-state (cyan).
Next, we studied the relative pulse-train amplification, the ratio RPT. This was defined as the amplitude of the test pulse following an initial pulse train divided by the amplitude of the test pulse when the initial pulse train consisted of a single pulse, as shown in figure M6. Thus, it measures how much more a train of EPSPs contributes over a single EPSP to dendritic depolarization. In figure 6A, RPT is plotted versus the frequency for various ISDs. In B we show the frequency dependency of the amplification factor for ISI = 150 and ISI = 500 ms, using 2, 3, 4, and 15 (s-s) pulses. When RPT is plotted versus pulse train duration (figure 6C) it is clear that the relative amplification increases with increasing stimulus duration when the frequency is fixed, and with increasing frequency when duration is fixed, for both ISD = 150 ms and ISD = 500 ms. In figure 7A the analysis is taken one step further as we calculate the largest possible ISD to reach a RPT of 1.1, i.e. a 10 % increase in amplification of the test pulse (ISDR10). The result shows that with higher frequencies as well as a higher number of pulses, depolarizations become more long-lasting, indicating a larger effective decay time constant. In figure 7B, we plot the data from figure 7A versus the decay time constants from figure 4 with corresponding frequency and number of pulses. The linear relationship confirms the use of ISDR10 as a measure of an effective decay time constant. Thus, increasing frequency and increasing the number of inputs lead not only an increase in depolarization amplitude, but also a decrease in the rate of decay of the depolarization and hence a more long-lasting depolarization.
Figure 6.

Depolarization from pulse train. (A) Relative amplification RPT versus frequency when pulse train has reached steady-state, for ISD = 150 (blue), 500 (green), 1000 (red), 2000 (cyan) and 3000 ms (magenta). (B) Relative amplification versus frequency for N = 2 (blue), 3 (green), 4 (red) and steady-state (cyan) and ISD = 150 (solid) and 500 ms (dotted). (C) Relative amplification versus stimulation duration, for f = 6 (blue), 8 (green) and 10 Hz (red) and ISD = 150 (solid) and 500 ms (dotted).
Figure 7.

Effective decay time constant. (A) ISDR10 versus number of pulses (N), for frequencies 3-10 Hz (< 3 Hz does not allow for 10%-amplification). (B) ISDR10 versus decay time constant, for various N (1-10 pulses) and frequencies (1-10 Hz).
3.3. Voltage-dependent activation of TRP channels
We were also interested in studying the influences of TRP channels on dendritic integrative properties when contributions to calcium from voltage-dependent factors were included, i.e. the activation of voltage-gated calcium channels. For the voltage interval spanned by the EPSPs produced in our simulations, we assumed the main source of calcium would be L-type channels with low threshold characteristics, see Methods. As membrane potential is one of the key factors in CaL-channel activation, we studied the integrative properties with excitatory ionotropic synaptic transmission intact. Furthermore, as the resulting TRP-channel activation led to membrane depolarization, this model displayed a positive feedback loop.
We first studied the integration of inputs of frequencies in the interval 1-10 Hz (figure 8). Results were similar to those of the voltage-independent activation model (figure 3), but the rate of increase appeared to be larger for frequencies below 4 Hz and the saturation appeared to be stronger for frequencies above 4 Hz. The two models yield partially different results, since in the VDA model there are two factors, the calcium from calcium channels as well as the mGluR activation factor, but in the VIA model there is only the latter.
Figure 8.

Frequency dependence of slow TRP depolarization when voltage-dependent factors of the TRP channel activation are included. (A) Peak of TRP current EPSCs for frequencies 1 – 10 Hz measured when average membrane potential has reached steady-state. (B) Average soma membrane potential at steady-state for frequencies 1 – 10 Hz. Mixed mGlu and ionotropic receptor induced depolarization (solid) and pure ionotropic depolarization (dashed). For the mixed TRP and ionotropic glutamatergic response, saturation can be observed above about 4 Hz.
We next studied the effective decay time of the membrane potential using pair-pulse stimulation. This method of measuring membrane potential decay was even more advantageous in this model than in the VIA model, as a single decay time constant and peak point was even more difficult to identify. In figure 9A we see that the relative amplification of the test pulse depends on the inter-stimulus delay, with maximal amplitude around 100-400 ms and decaying to negligible amplification around 1000 ms. As in the voltage-independent activation model (figure 6B), higher frequency yields a larger effect (figure 9B). For an ISD of 150 ms, the amplification reaches up to 50 % for 10 Hz, and even for an ISD of 500 ms it is more than 30%. The saturation above 4 Hz observed in figure 8B is even more pronounced in 9B. Notably, we get an amplification of more than 40 % for the low frequency 4 Hz. To assess the contribution of the TRP current to the phenomenon, we also show results from blocking the TRP component of the synaptic response and leaving only ionotropic responses. The TRP block reduces the depolarization index dramatically.
Figure 9.

Depolarization from pulse train and effective decay time constant when voltage dependent factors of the TRP channel activation are included. (A) Relative amplification RPT versus ISD for frequencies 2, 4, 6, 8, 10 Hz, N = steady-state. The dashed line shows how the ISDR10 in D is calculated. Note that for this model, the relative amplification stays high up to some 300-400 ms instead of as in the previous model decay monotonically. (B) Relative amplification RPT is increasing with increasing frequency for a given number of inputs, N=2 (blue), 3 (green), 4 (red), s-s (cyan), and ISD = 150 (solid) and 500 ms (dotted). With the TRP channel blocked, RPT is relatively small (dashed and dash-dotted). (C) Relative amplification increases with increasing stimulation duration, for ISD = 150 (solid) and 500 ms (dotted), f = 6 (blue), 8 (green), 10 Hz (red). (D) ISDR10 versus N, for frequencies 1-10 Hz. Note that ISDR10 increases about 100 % from 1-10 Hz.
Moreover, we also studied the dependency of amplification on stimulus duration (figure 9C). As in figure 6C we chose ISDs of 150 and 500 ms. The results are similar to those of figure 6C. When plotting the ISDR10 (figure 9D) we see a positive trend similar to the voltage-independent activation model (figure 7A). The saturation after the 4th pulse seen in figure 9D, and also in 9B, is very similar to experimental findings (Congar et al., 1997). This saturation is also consistent with saturation of TRP associated post-spike depolarizations (Sidiropoulou et al., 2009). In figure 9D we can also see that, as indicated in figure 9A, for a savings of 10% (RPT = 1.1) the inter-stimulus delay ISDR10 is about 550 ms for 2 Hz but 800 ms for 10 Hz, again reflecting that higher frequencies give potentials that decay slower.
Furthermore, transient responses to the onset of input can also be analysed. Figure 9C shows that most of the amplification is reached in less than 400 ms, which is a short time considering the low frequencies studied here. For 6 Hz this leads to 3 inputs and for 10 Hz it leads to 5 inputs. Moreover, in figure 9D, one can see that the major part of the increase in decay rate is reached at 5 pulses. Both results show that the kinetics of TRP activation enables summation of relatively brief stimulations. Note that the ISDR10 increases approximately 100% in the frequency interval 1-10 Hz. This shows that the effective decay time constant increases as a function of stimulus parameters.
3.4. Sensitivity analysis
To assess the results we found by using the CA1 pyramidal neuron model by Poirazi et al. (2003), we performed additional experiments using the model by Larkum et al. (2009; http://senselab.med.yale.edu/ModelDb/showmodel.asp?model=124043) of a neocortical pyramidal neuron. To the Larkum model we added our model components describing the glutamate concentration dynamics, mGlu receptor and the TRP channel, and the associated signalling pathway between the two latter. The Larkum model and the Poirazi model, from which our model was developed, have calcium concentrations produced in different ranges due to different calcium channel models used. To account for this, we needed to change two parameters in our model. To take into account the different calcium scales used in the Larkum model, we multiplied the calcium concentration value (Cai) by a factor of 1/24000 and changed the calcium threshold in the TRP model (Cath) from 1.09e-4 to 2.1e-6. The results on low frequency summation in the 1-10 Hz range were qualitatively similar to the ones using the Poirazi model (data not shown). Our interpretation based on this comparison is that the results presented in this work do not critically depend on dendrite morphology or ion channel distribution.
As described in Methods, calcium-dependent potassium currents were blocked in all results presented here except figure M7. The significance of this simplification was tested in a model version which did not block these currents. The dynamic balance between the resting membrane potential and currents gated by voltage and calcium was affected and required parameters such as Cath to be re-tuned, but results were not qualitatively different from the results presented. For example, the decay time increased with increasing frequency and number of inputs (figures 4, 6, 7, 9), and the average membrane potential at steady-state increased with increasing frequency (figures 3B, 8B). Our results do not seem sensitive to the presence of other calcium-activated currents.
Next we wanted to study the influence of maximum TRP conductance, by scaling this parameter to 50 % or 200 % of its original value in the voltage-independent activation model. As the values in figure 4A changed less than 5 %, the impact on decay time was small. The impact on steady-state summation was large but followed the TRP amplitude change; values in figure 3B changed to 50 % and 205 % respectively.
The glutamate model used in this work is based on data showing a double exponential decay which allows for summation. Our finding of an increase in EPSP decay time as a result of increasing frequency and duration is to a large extent dependent on this glutamate summation. The increase in EPSP decay time was absent in simulations in which we set Kglu to 0. In addition, we evaluated the use of square glutamate pulses of duration in the range of 100 ms in a case with no summation allowed. Even with square glutamate pulses, both maximum TRP current (figures 3A, 8A) and average membrane potential increases with increasing frequency at steady-state (figures 3B, 8B) .
4. Discussion
Neuronal integration is a result of temporal and spatial summation. Pyramidal neurons receive a majority of their synaptic input at distal thin dendrites. Dendritic ion channels may strongly affect the input summation by the generation of NMDA spikes, Na spikes and Ca spikes (Spruston, 2008; Larkum et al., 2009). This spike generation may be generated within a single dendritic branch (Wei et al., 2001; Polsky et al., 2004; Losonczy & Magee, 2006) and may even require inputs to be within a 40 μm segment (Polsky et al., 2004). Furthermore, neuronal firing rates during behaviour are commonly below 15 Hz; 1-5 Hz (Fried et al., 1997), around 7 Hz (Jeffery et al., 1995; Harvey et al., 2009), 8-13 Hz (Young et al., 1997; Freedman et al., 2001). This implies that despite a multitude of synaptic contacts over the dendritic tree, frequencies may locally be low. Consequently, cortical neurons must possess a slow dendritic component to support low-frequency integration. In this work, we have shown that synaptically induced TRP-channel activation can enable neurons to effectively summate these low frequencies. In particular, we show that the system comprising TRP channels activated by mGlu receptors and their second messenger signalling pathways possesses a time scale slow enough to effectively summate frequencies as low as 3-4 Hz (figure 3B, 8B). Moreover, we show that depolarization builds up relatively rapidly, from 3-5 inputs (figure 6A, 9C, 9D) suggesting that the contribution should not only be seen as a background depolarization but also would be relevant for brief inputs. Importantly, we show that the system has the property that the effective time constant increases with increasing frequencies and increasing stimulation time. We show that this property is due to summation of peri- and extrasynaptic glutamate available for the mGlu receptor, a result consistent with experiments using glutamate uptake blockers (Congar et al., 1997; Reichelt & Knöpfel, 2002). The dependency of the decay time constant on stimulus parameters implies that the mGluR-activated TRP current provides a mnemonic capacity where stimulus frequency and intensity combine to affect the longevity of the depolarization. In this way the properties of the mGluR-TRP component further enhance the capacity of neuronal low-frequency summation.
Similar results found for voltage-independent and voltage-dependent models
The two cases studied, one omitting voltage-dependent TRP channel activating factors (VIA), and one including such factors (VDA), gave similar results for most aspects studied. We found that the effective rate of decay increased with increasing stimulus frequency and duration. We also found that the highest rate of summation was attained for the first 3-5 inputs. This means that transient activation by brief stimuli might be effectively integrated for low frequencies. The difference observed when including the voltage-dependent factors was mainly found as a more pronounced rate of summation for frequencies up to 3-4 Hz followed by increased saturation for frequencies above 3-4 Hz both for membrane potential and for pair-pulse amplification factor. As TRPC channels are Ca-permeable, saturation in the activation is to be expected from a calcium homeostatic point of view.
The slow mGluR-activated TRP summation may be present in multiple neuron types
TRPC channels have been found in a multitude of neuron types (Batchelor et al., 1994, 1997; Congar et al., 1997; Partridge & Valenzuela, 1999; Kim et al., 2003; Bengtson et al., 2004; Wyart et al., 2005; Faber et al., 2006; Fowler et al., 2007; Riccio et al., 2009; Sidiropoulou et al., 2009). There may be differences in integrative properties as different neuron types display individual profiles of ion channel expression. In particular, the source of calcium from voltage-gated calcium channels may be of a different origin. It has however been suggested that TRPC channels may respond to calcium from a multitude of sources (Gross et al., 2009). In this study we obtained similar results from two separate models, one representing a hippocampal CA1 and the other a neocortical layer V pyramidal neuron. It is therefore possible that TRP channels, despite differences between neuron types, can provide similar properties regarding summation of synaptic input.
Comparison to experimental observations
Our results show that TRP channels can enable summation at low frequencies. This is consistent with the experimental findings by Wyart et al. (2005). They show that depolarization/network activity following 2 Hz stimulation depends on a cationic current and that NMDA activation is not triggered for this low frequency. Furthermore, using somatic current injections to evoke a spike triggered mGluR-mediated slow afterdepolarization; Sidiropoulou et al. (2009) showed that the depolarization attained a maximal amplitude already for 5 Hz stimulation but not for 2 Hz. This result is consistent with our result seen in figure 8B where the TRP-mediated depolarization shows saturation around 4 Hz.
Moreover, Sidiropoulou et al. (2009) also found that the maximal depolarization was attained already for the 4th stimuli (spike), consistent with our findings (figures M5D, 7A, 9D). This latter observation was also seen in summation of synaptically triggered EPSPs (Congar et al., 1997).
Single pulse stimulation
Previous studies have shown that single inputs can elicit TRP depolarizations (Faber et al., 2006; Yoshida et al., 2008). However other studies report a lack of response for single synaptic pulses or low stimulation frequencies (see e.g. Kim et al., 2003). This difference may be due to differences in temperature, which has been shown to affect glutamate release for single pulses (Kovalchuck et al. 2000).
Role of TRP in dendritic spike generation
Dendritic spike generation is voltage dependent (Wei et al. 2001; Losonczy & Magee, 2006). To trigger an NMDA spike, the time window within which inputs need to arrive has been suggested to be quite limited, on the order of 6 ms (Losonczy & Magee, 2006). The low-frequency summation studied here may thereby complement this limitation of burst-mode signalling with a capacity to also integrate information over longer time windows relevant for behaviour. Further, dendritic spikes do not always propagate to the soma (Golding & Spruston, 1998). Temporal summation of long-lasting dendritic depolarizations as studied here could potentially facilitate the propagation by inactivating KA currents and enhancing Na and Ca currents (Gasparini et al., 2004). Moreover, long-lasting dendritic depolarizations could also facilitate the pairing between EPSPs and back-propagating action potentials, as the latter are facilitated by dendritic depolarization (Sjöström & Häusser, 2006).
Role of TRP currents in behaviour
Cationic channels have been implicated in sensory-motor integration (Oestreich et al., 2006), motor pattern generation (Viana di Prisco et al., 2000; Pace et al., 2007) and coordination (Hartmann et al., 2008), and have recently been shown to be involved in fear behaviour (Riccio et al., 2009) and learning and memory (Zhou et al ., 2008). We show how the slow kinetics of the TRP-mediated depolarizations enables the neuron to integrate inputs of rates down to 3-4 Hz. This capacity might be particularly important in regions displaying low rate or irregular firing. In regions involved in working memory or trace conditioning, neurons display low-rate sustained firing, often below 15 Hz. Involvement of TRPC channels is consistent with the observation that behavioural performance shows sensitivity to cholinergic and metabotropic glutamate blockade (Tang et al., 1997; Naie & Manahan-Vaughan, 2004; Bang & Brown, 2009; Esclassan et al ., 2009). Slow TRPC-mediated depolarizations could thus be involved in sustaining the low rates over behaviourally relevant time periods.
Group I mGluR activation supports many hippocampal-dependent behaviours such as spatial navigation, object recognition memory and contextual fear conditioning (Maciejak et al., 2003; Balschun et al., 2006; Barker et al., 2006; Xu et al., 2009). On a cellular level, pyramidal neurons in the hippocampus are depolarized through group I mGluR activation (Congar et al., 1997; Partridge & Valenzuela, 1999; Strubing et al., 2001; Wyart et al., 2005). Lack of this depolarization might underlie deficits in the above-mentioned behaviours. In particular, during spatial navigation, hippocampal place cells show slow depolarization as the animal moves across place fields (Harvey et al., 2009). Group I mGluR-activated TRP current may thus support spatial navigation by providing a necessary depolarization enabling neural activity.
Acknowledgements
Grant sponsor: Swedish VR; Grant number: 621-2007-3774
Grant sponsor: NIH; Grant number: MH061492-06A2 We thank Philippe Séguéla for discussions on TRP channels.
References
- Alonso A, de Curtis M, Llinás R. Postsynaptic hebbian and non-hebbian long-term potentiation of synaptic efficacy in the entorhinal cortex in slices and in the isolated adult guinea pig brain. PNAS. 1990;87(23):9280–9284. doi: 10.1073/pnas.87.23.9280. [DOI] [PMC free article] [PubMed] [Google Scholar]
- Balschun D, Zuschratter W, Wetzel W. Allosteric enhancement of metabotropic glutamate receptor 5 function promotes spatial memory. Neuroscience. 2006;142:691–702. doi: 10.1016/j.neuroscience.2006.06.043. [DOI] [PubMed] [Google Scholar]
- Bang SJJ, Brown TH. Muscarinic receptors in perirhinal cortex control trace conditioning. The Journal of neuroscience. 2009;29(14):4346–4350. doi: 10.1523/JNEUROSCI.0069-09.2009. [DOI] [PMC free article] [PubMed] [Google Scholar]
- Barker GR, Bashir ZI, Brown MW, Warburton EC. A temporally distinct role for group I and group II metabotropic glutamate receptors in object recognition memory. Learn Mem. 2006;13:178–186. doi: 10.1101/lm.77806. [DOI] [PMC free article] [PubMed] [Google Scholar]
- Batchelor AM, Garthwaite J. Frequency detection and temporally dispersed synaptic signal association through a metabotropic glutamate receptor pathway. Nature. 1997;385(6611):74–77. doi: 10.1038/385074a0. [DOI] [PubMed] [Google Scholar]
- Batchelor AM, Madge DJ, Garthwaite J. Synaptic activation of metabotropic glutamate receptors in the parallel fibre-purkinje cell pathway in rat cerebellar slices. Neuroscience. 1994;63(4):911–915. doi: 10.1016/0306-4522(94)90558-4. [DOI] [PubMed] [Google Scholar]
- Bengtson CP, Tozzi A, Bernardi G, Mercuri NB. Transient receptor potential-like channels mediate metabotropic glutamate receptor EPSCs in rat dopamine neurones. The Journal of physiology. 2004;555(Pt 2):323–330. doi: 10.1113/jphysiol.2003.060061. [DOI] [PMC free article] [PubMed] [Google Scholar]
- Bianchi R, Young SR, Wong RK. Group I mGluR activation causes voltage-dependent and -independent Ca2+ rises in hippocampal pyramidal cells. J Neurophysiol. 1999;81(6):2903–13. doi: 10.1152/jn.1999.81.6.2903. [DOI] [PubMed] [Google Scholar]
- Blair NT, Kaczmarek JS, Clapham DE. Intracellular calcium strongly potentiates agonist-activated TRPC5 channels. The Journal of general physiology. 2009;133(5):525–546. doi: 10.1085/jgp.200810153. [DOI] [PMC free article] [PubMed] [Google Scholar]
- Congar P, Leinekugel X, Ben-Ari Y, Crépel V. A long-lasting calcium-activated nonselective cationic current is generated by synaptic stimulation or exogenous activation of group I metabotropic glutamate receptors in CA1 pyramidal neurons. J. Neuroscience. 1997;17(14):5366–5379. doi: 10.1523/JNEUROSCI.17-14-05366.1997. [DOI] [PMC free article] [PubMed] [Google Scholar]
- Crépel V, Aniksztejn L, Ben-Ari Y, Hammond C. Glutamate metabotropic receptors increase a Ca(2+)-activated nonspecific cationic current in CA1 hippocampal neurons. J. Neurophysiol. 1994;72(4):1561–9. doi: 10.1152/jn.1994.72.4.1561. [DOI] [PubMed] [Google Scholar]
- Destexhe A, Contreras D, Sejnowski TJ, Steriade M. A model of spindle rhythmicity in the isolated thalamic reticular nucleus. Journal of neurophysiology. 1994;72(2):803–818. doi: 10.1152/jn.1994.72.2.803. [DOI] [PubMed] [Google Scholar]
- Destexhe A, Mainen ZF, Sejnowski TJ. Kinetic models of synaptic transmission. In: Koch C, Segev I, editors. Methods in Neuronal Modeling. MIT Press; Cambridge: 1998. pp. 1–25. [Google Scholar]
- Destexhe A, Sejnowski TJ. G protein activation kinetics and spillover of gamma-aminobutyric acid may account for differences between inhibitory responses in the hippocampus and thalamus. PNAS. 1995;92(21):9515–9519. doi: 10.1073/pnas.92.21.9515. [DOI] [PMC free article] [PubMed] [Google Scholar]
- Egorov AV, Hamam BN, Fransén E, Hasselmo ME, Alonso AA. Graded persistent activity in entorhinal cortex neurons. Nature. 2002;420(6912):173–178. doi: 10.1038/nature01171. [DOI] [PubMed] [Google Scholar]
- Esclassan F, Coutureau E, Di Scala G, Marchand AR. A cholinergic-dependent role for the entorhinal cortex in trace fear conditioning. The Journal of Neuroscience. 2009;29(25):8087–8093. doi: 10.1523/JNEUROSCI.0543-09.2009. [DOI] [PMC free article] [PubMed] [Google Scholar]
- Faber ES, Sedlak P, Vidovic M, Sah P. Synaptic activation of transient receptor potential channels by metabotropic glutamate receptors in the lateral amygdala. Neuroscience. 2006;137(3):781–794. doi: 10.1016/j.neuroscience.2005.09.027. [DOI] [PubMed] [Google Scholar]
- Fowler MA, Sidiropoulou K, Ozkan ED, Phillips CW, Cooper DC. Corticolimbic expression of TRPC4 and TRPC5 channels in the rodent brain. PloS one. 2007;2(6):e573. doi: 10.1371/journal.pone.0000573. [DOI] [PMC free article] [PubMed] [Google Scholar]
- Fransén E, Tahvildari B, Egorov A, Hasselmo M, Alonso A. Mechanism of graded persistent cellular activity of entorhinal cortex layer V neurons. Neuron. 2006;49:735–746. doi: 10.1016/j.neuron.2006.01.036. [DOI] [PubMed] [Google Scholar]
- Freedman DJ, Riesenhuber M, Poggio T, Miller EK. Categorical representation of visual stimuli in the primate prefrontal cortex. Science. 2001;291(5502):312–316. doi: 10.1126/science.291.5502.312. [DOI] [PubMed] [Google Scholar]
- Fried I, MacDonald KA, Wilson CL. Single neuron activity in human hippocampus and amygdala during recognition of faces and objects. Neuron. 1997;18(5):753–765. doi: 10.1016/s0896-6273(00)80315-3. [DOI] [PubMed] [Google Scholar]
- Gasparini S, Migliore M, Magee JC. On the initiation and propagation of dendritic spikes in CA1 pyramidal neurons. The Journal of Neuroscience. 2004;24(49):11046–11056. doi: 10.1523/JNEUROSCI.2520-04.2004. [DOI] [PMC free article] [PubMed] [Google Scholar]
- Gee CE, Benquet P, Gerber U. Group I metabotropic glutamate receptors activate a calcium-sensitive transient receptor potential-like conductance in rat hippocampus. J Physiol. 2003;546(3):655–664. doi: 10.1113/jphysiol.2002.032961. [DOI] [PMC free article] [PubMed] [Google Scholar]
- Golding NL, Spruston N. Dendritic sodium spikes are variable triggers of axonal action potentials in hippocampal CA1 pyramidal neurons. Neuron. 1998;21(5):1189–1200. doi: 10.1016/s0896-6273(00)80635-2. [DOI] [PubMed] [Google Scholar]
- Gross SAA, Guzmán GAA, Wissenbach U, Philipp SEE, Zhu MXX, Bruns D, Cavalié A. TRPC5 is a Ca2+-activated channel functionally coupled to Ca2+-selective ion channels. The Journal of biological chemistry. 2009;284(49):34423–34432. doi: 10.1074/jbc.M109.018192. [DOI] [PMC free article] [PubMed] [Google Scholar]
- Hartmann J, Dragicevic E, Adelsberger H, Henning HA, Sumser M, Abramowitz J, Blum R, Dietrich A, Freichel M, Flockerzi V, Birnbaumer L, Konnerth A. TRPC3 channels are required for synaptic transmission and motor coordination. Neuron. 2008;59(3):392–398. doi: 10.1016/j.neuron.2008.06.009. [DOI] [PMC free article] [PubMed] [Google Scholar]
- Harvey CD, Collman F, Dombeck DA, Tank DW. Intracellular dynamics of hippocampal place cells during virtual navigation. Nature. 2009;461(7266):941–946. doi: 10.1038/nature08499. [DOI] [PMC free article] [PubMed] [Google Scholar]
- Hires SAA, Zhu Y, Tsien RY. Optical measurement of synaptic glutamate spillover and reuptake by linker optimized glutamate-sensitive fluorescent reporters. PNAS. 2008;105(11):4411–4416. doi: 10.1073/pnas.0712008105. [DOI] [PMC free article] [PubMed] [Google Scholar]
- Jeffery KJ, Donnett JG, O’Keefe J. Medial septal control of theta-correlated unit firing in the entorhinal cortex of awake rats. Neuroreport. 1995;6(16):2166–2170. doi: 10.1097/00001756-199511000-00017. [DOI] [PubMed] [Google Scholar]
- Kim SJJ, Kim YSS, Yuan JP, Petralia RS, Worley PF, Linden DJ. Activation of the TRPC1 cation channel by metabotropic glutamate receptor mGluR1. Nature. 2003;426(6964):285–291. doi: 10.1038/nature02162. [DOI] [PubMed] [Google Scholar]
- Kovalchuk Y, Eilers J, Lisman J, Konnerth A. NMDA receptor-mediated subthreshold Ca(2+) signals in spines of hippocampal neurons. The Journal of neuroscience. 2000;20(5):1791–1799. doi: 10.1523/JNEUROSCI.20-05-01791.2000. [DOI] [PMC free article] [PubMed] [Google Scholar]
- Larkum ME, Nevian T, Sandler M, Polsky A, Schiller J. Synaptic integration in tuft dendrites of layer 5 pyramidal neurons: a new unifying principle. Science (New York, N.Y.) 2009;325(5941):756–760. doi: 10.1126/science.1171958. [DOI] [PubMed] [Google Scholar]
- Lipscombe D, Helton TD, Xu W. L-type calcium channels: the low down. Journal of neurophysiology. 2004;92(5):2633–2641. doi: 10.1152/jn.00486.2004. [DOI] [PubMed] [Google Scholar]
- Losonczy A, Magee JC. Integrative properties of radial oblique dendrites in hippocampal CA1 pyramidal neurons. Neuron. 2006;50(2):291–307. doi: 10.1016/j.neuron.2006.03.016. [DOI] [PubMed] [Google Scholar]
- Lujan R, Nusser Z, Roberts JD, Shigemoto R, Somogyi P. Perisynaptic location of metabotropic glutamate receptors mGluR1 and mGluR5 on dendrites and dendritic spines in the rat hippocampus. The European journal of neuroscience. 1996;8(7):1488–1500. doi: 10.1111/j.1460-9568.1996.tb01611.x. [DOI] [PubMed] [Google Scholar]
- Maciejak P, Taracha E, Lehner M, Szyndler J, Bidziński A, Skórzewska A, Wisłowska A, Zienowicz M, Płaźnik A. Hippocampal mGluR1 and consolidation of contextual fear conditioning. Brain Res Bull. 2003;62:39–45. doi: 10.1016/j.brainresbull.2003.08.003. [DOI] [PubMed] [Google Scholar]
- Magee JC, Cook EP. Somatic EPSP amplitude is independent of synapse location in hippocampal pyramidal neurons. Nat Neurosci. 2000;3:895–903. doi: 10.1038/78800. [DOI] [PubMed] [Google Scholar]
- Marcaggi P, Mutoh H, Dimitrov D, Beato M, Knöpfel T. Optical measurement of mGluR1 conformational changes reveals fast activation, slow deactivation, and sensitization. PNAS. 2009;106(27):11388–11393. doi: 10.1073/pnas.0901290106. [DOI] [PMC free article] [PubMed] [Google Scholar]
- Naie K, Manahan-Vaughan D. Regulation by metabotropic glutamate receptor 5 of LTP in the dentate gyrus of freely moving rats: relevance for learning and memory formation. Cerebral cortex. 2004;14(2):189–198. doi: 10.1093/cercor/bhg118. [DOI] [PubMed] [Google Scholar]
- Oestreich J, Dembrow NC, George AA, Zakon HH. A ”sample-and-hold” pulse-counting integrator as a mechanism for graded memory underlying sensorimotor adaptation. Neuron. 2006;49(4):577–588. doi: 10.1016/j.neuron.2006.01.027. [DOI] [PubMed] [Google Scholar]
- Pace RW, Mackay DD, Feldman JL, Del Negro CA. Inspiratory bursts in the prebötzinger complex depend on a calcium-activated non-specific cation current linked to glutamate receptors in neonatal mice. The Journal of physiology. 2007;582(Pt 1):113–125. doi: 10.1113/jphysiol.2007.133660. [DOI] [PMC free article] [PubMed] [Google Scholar]
- Partridge LD, Valenzuela CF. Ca2+ store-dependent potentiation of Ca2+-activated non-selective cation channels in rat hippocampal neurones in vitro. The Journal of physiology. 1999;521(Pt 3):617–627. doi: 10.1111/j.1469-7793.1999.00617.x. [DOI] [PMC free article] [PubMed] [Google Scholar]
- Poirazi P, Brannon T, Mel BW. Arithmetic of subthreshold synaptic summation in a model CA1 pyramidal cell. Neuron. 2003;37(6):977–987. doi: 10.1016/s0896-6273(03)00148-x. [DOI] [PubMed] [Google Scholar]
- Polsky A, Mel BW, Schiller J. Computational subunits in thin dendrites of pyramidal cells. Nature neuroscience. 2004;7(6):621–627. doi: 10.1038/nn1253. [DOI] [PubMed] [Google Scholar]
- Reichelt W, Knöpfel T. Glutamate uptake controls expression of a slow postsynaptic current mediated by mGluRs in cerebellar purkinje cells. Journal of neurophysiology. 2002;87(4):1974–1980. doi: 10.1152/jn.00704.2001. [DOI] [PubMed] [Google Scholar]
- Riccio A, Li Y, Moon J, Kim K-SS, Smith KS, Rudolph U, Gapon S, Yao GLL, Tsvetkov E, Rodig SJ, Van’t Veer A, Meloni EG, Carlezon WA, Bolshakov VY, Clapham DE. Essential role for TRPC5 in amygdala function and fear-related behavior. Cell. 2009;137(4):761–772. doi: 10.1016/j.cell.2009.03.039. [DOI] [PMC free article] [PubMed] [Google Scholar]
- Rusakov DA, Kullmann DM. Extrasynaptic glutamate diffusion in the hippocampus: ultrastructural constraints, uptake, and receptor activation. The Journal of neuroscience. 1998;18(9):3158–3170. doi: 10.1523/JNEUROSCI.18-09-03158.1998. [DOI] [PMC free article] [PubMed] [Google Scholar]
- Sidiropoulou K, Lu F-MM, Fowler MA, Xiao R, Phillips C, Ozkan ED, Zhu MX, White FJ, Cooper DC. Dopamine modulates an mGluR5-mediated depolarization underlying prefrontal persistent activity. Nature neuroscience. 2009;12(2):190–199. doi: 10.1038/nn.2245. [DOI] [PMC free article] [PubMed] [Google Scholar]
- Sjöström PJJ, Häusser M. A cooperative switch determines the sign of synaptic plasticity in distal dendrites of neocortical pyramidal neurons. Neuron. 2006;51(2):227–238. doi: 10.1016/j.neuron.2006.06.017. [DOI] [PMC free article] [PubMed] [Google Scholar]
- Spruston N, Jaffe DB, Williams SH, Johnston D. Voltage- and space-clamp errors associated with the measurement of electrotonically remote synaptic events. J. Neurophysiol. 1993;70:781–802. doi: 10.1152/jn.1993.70.2.781. [DOI] [PubMed] [Google Scholar]
- Spruston N. Pyramidal neurons: dendritic structure and synaptic integration. Nature reviews. Neuroscience. 2008;9(3):206–221. doi: 10.1038/nrn2286. [DOI] [PubMed] [Google Scholar]
- Strübing C, Krapivinsky G, Krapivinsky L, Clapham DE. TRPC1 and TRPC5 form a novel cation channel in mammalian brain. Neuron. 2001;29(3):645–655. doi: 10.1016/s0896-6273(01)00240-9. [DOI] [PubMed] [Google Scholar]
- Tahvildari B, Fransén E, Alonso A, Hasselmo M. Switching between “On” and “Off” States of Persistent Activity in Lateral Entorhinal Layer III Neurons. Hippocampus. 2007;17:257–263. doi: 10.1002/hipo.20270. [DOI] [PubMed] [Google Scholar]
- Tang Y, Mishkin M, Aigner TG. Effects of muscarinic blockade in perirhinal cortex during visual recognition. Proc Natl Acad Sci USA. 1997;94:12667–12669. doi: 10.1073/pnas.94.23.12667. [DOI] [PMC free article] [PubMed] [Google Scholar]
- Tempia F, Miniaci MC, Anchisi D, Strata P. Postsynaptic current mediated by metabotropic glutamate receptors in cerebellar purkinje cells. Journal of neurophysiology. 1998;80(2):520–528. doi: 10.1152/jn.1998.80.2.520. [DOI] [PubMed] [Google Scholar]
- Viana di Prisco GV, Pearlstein E, Le Ray D, Robitaille R, Dubuc R. A cellular mechanism for the transformation of a sensory input into a motor command. J Neurosci. 2000;20(21):8169–8176. doi: 10.1523/JNEUROSCI.20-21-08169.2000. [DOI] [PMC free article] [PubMed] [Google Scholar]
- Voets T, Droogmans G, Wissenbach U, Janssens A, Flockerzi V, Nilius B. The principle of temperature-dependent gating in cold- and heat-sensitive TRP channels. Nature. 2004;430(7001):748–754. doi: 10.1038/nature02732. [DOI] [PubMed] [Google Scholar]
- Wei DS, Mei YA, Bagal A, Kao JP, Thompson SM, Tang CM. Compartmentalized and binary behavior of terminal dendrites in hippocampal pyramidal neurons. Science. 2001;293(5538):2272–2275. doi: 10.1126/science.1061198. [DOI] [PubMed] [Google Scholar]
- Williams SR, Mitchell SJ. Direct measurement of somatic voltage clamp errors in central neurons. Nat Neurosci. 2008;11:790–8. doi: 10.1038/nn.2137. [DOI] [PubMed] [Google Scholar]
- Wyart C, Cocco S, Bourdieu L, Léger J-FF, Herr C, Chatenay D. Dynamics of excitatory synaptic components in sustained firing at low rates. Journal of neurophysiology. 2005;93(6):3370–3380. doi: 10.1152/jn.00530.2004. [DOI] [PubMed] [Google Scholar]
- Yan H-DD, Villalobos C, Andrade R. TRPC channels mediate a muscarinic receptor-induced afterdepolarization in cerebral cortex. The Journal of neuroscience. 2009;29(32):10038–10046. doi: 10.1523/JNEUROSCI.1042-09.2009. [DOI] [PMC free article] [PubMed] [Google Scholar]
- Yoshida M, Fransén E, Hasselmo ME. mGluR-dependent persistent firing in entorhinal cortex layer III neurons. The European journal of neuroscience. 2008;28(6):1116–1126. doi: 10.1111/j.1460-9568.2008.06409.x. [DOI] [PMC free article] [PubMed] [Google Scholar]
- Xu J, Zhu Y, Contractor A, Heinemann SF. mGluR5 has a critical role in inhibitory learning. J Neurosci. 2009;29:3676–3684. doi: 10.1523/JNEUROSCI.5716-08.2009. [DOI] [PMC free article] [PubMed] [Google Scholar]
- Young BJ, Otto T, Fox GD, Eichenbaum H. Memory representation within the parahippocampal region. The Journal of neuroscience. 1997;17(13):5183–5195. doi: 10.1523/JNEUROSCI.17-13-05183.1997. [DOI] [PMC free article] [PubMed] [Google Scholar]
- Zhang Z, Reboreda A, Alonso A, Barker PA, Séguéla P. TRPC channels underlie cholinergic plateau potentials and persistent activity in entorhinal cortex. Hippocampus. 2011 Apr;21(4):386–97. doi: 10.1002/hipo.20755. [DOI] [PubMed] [Google Scholar]
- Zhou J, Du W, Zhou K, Tai Y, Yao H, Jia Y, Ding Y, Wang Y. Critical role of TRPC6 channels in the formation of excitatory synapses. Nat Neurosci. 2008;11(7):741–3. doi: 10.1038/nn.2127. [DOI] [PubMed] [Google Scholar]