Abstract
Nanoindentation has become a standard method for measuring mechanical properties of bone, especially within microstructural units such as individual osteons or trabeculae. The use of nanoindentation to measure elastic properties has been thoroughly studied and validated. However, it is also possible to assess time dependent properties of bone by nanoindentation. The goal of this study was to compare time dependent mechanical properties of bone measured at the macroscopic level with those measured by nanoindentation. Twelve samples were prepared from the posterior distal femoral cortex of young cows. Initially, dogbone samples were prepared and subjected to torsional stress relaxation in a saline bath at 37 C. A 5 mm thick disk was subsequently sectioned from the gage length, and subjected to nanoindentation. Nanoindentation was performed on hydrated samples using a standard protocol with 20 indents performed in 20 different osteons in each sample. Creep and stress relaxation data were fit to a Burgers four parameter rheological model, a five parameter generalized Maxwell model, and a three parameter standard linear solid. For Burgers viscoelastic model, the time constants measured by nanoindentation and torsion were weakly negatively correlated, while for the other two models the time constants were uncorrelated. The results support the notion that the viscoelastic behavior of bone at the macroscopic scale is primarily due to microstructural features, interfaces, or fluid flow, rather than viscous behavior of the bone tissue. As viscoelasticity affects the fatigue behavior of materials, the microscale properties may provide a measure of bone quality associated with initial damage formation.
Keywords: Cortical bone, viscoelasciticty, nanoindentation, torsion
Introduction
Nanoindentation provides a means to assess the mechanical properties of bone at very small length scales (Gupta et al., 2005; Rho et al., 1997; Turner et al., 1999; Zysset et al., 1999). In the case of cortical bone, nanoindentation can be used to measure mechanical behavior at the level of individual osteons (Huja et al., 2006; Rho et al., 2001) or even lamellae (Rho et al., 1999a; Rho et al., 1999b). It is one of the few methods capable of directly assessing mechanical behavior of the bone tissue within individual trabeculae (Rho et al., 1997; Turner et al., 1999; Zysset et al., 1999). A nanoindentation instrument measures the load and deformation of a probe as it is advanced into the surface of an object. The data are typically used to estimate the elastic modulus, which is calculated by the Pharr–Oliver equations (Oliver and Pharr, 2004). If a holding period at a constant load or displacement or a dynamic oscillation is included, viscoelastic behavior can also be assessed (Fischer-Cripps, 2004; Huang et al., 2011). The viscoelastic behavior of bulk polymers measured by nanoindentation agrees with that found using macroscopic testing (Odegard et al., 2005).
Nanoindentation protocols for bone were developed to measure elastic properties consistent with behaviors measured at the macroscopic level. Relatively large indentations, on the order of 2 μm across and 500 to 1000 nm deep, are recommended (Hengsberger et al., 2003b; Hoffler et al., 2005; Zysset et al., 1999), which result in measured elastic moduli on the order of 10 to 20 GPa (Rho et al., 1997). Indentation on two orthogonal planes combined with an anisotropic analysis gave moduli in good agreement with microtensile specimens (Hengsberger et al., 2003a). When the same loading protocols were applied to trabecular bone tissue, the measured elastic modulus was similar to cortical bone tissue (Turner et al., 1999). Lower loads or indentation depths have been used in order to measure the properties of individual lamellae, which were found to have alternating high and low moduli (Hengsberger et al., 2002; Rho et al., 1999b). Indentation protocols for bone typically include a holding period at constant load or depth where the bone exhibits creep or stress-relaxation behavior, respectively. This technique has been applied to characterize bone properties during growth (Isaksson et al., 2010a), damage (Zioupos, 2005), and healing (Oyen and Ko, 2007). The experimental protocol can similarly affect nanoindentation measurements of viscoelastic behavior of bone (Isaksson et al., 2010b; Wu et al., 2011), but it is not known how these measures will relate to the macroscopic viscoelastic behavior.
Considering the hierarchical structure of bone, the viscoelastic properties from nanoindentation may not reflect the macroscopic behavior of bone, regardless of loading protocol. The deformation mechanisms during indentation differ from those in macroscopic testing. When a Berkovich indentation tip is used, there is damage formation below the tip (Zhang et al., 2010) and permanent deformation occurs (Mullins et al., 2009). Hence, in order to place viscous measurements from nanoindentation in context, they should be compared to data from conventional testing methods. The goal of this study was to assess the relationship between viscoelastic measurements of bone tissue by nanoindentation and macroscopic mechanical testing. Specifically, the aims of this study were to 1) measure the elastic and viscoelastic behavior of cortical bone using torsion tests; 2) measure the mechanical behavior of the same samples using nanoindentation; and 3) identify any correlations between the properties measured by the two techniques.
Methods
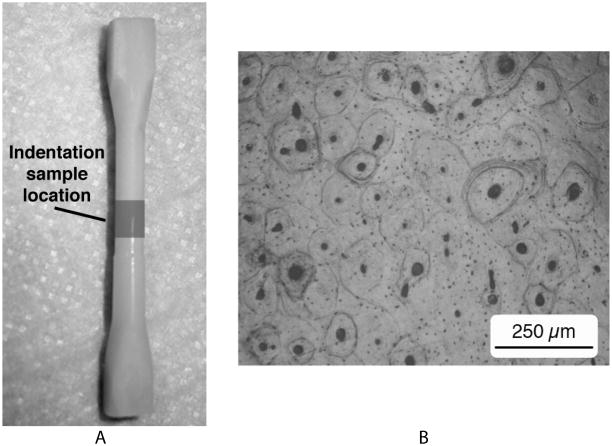
Fourteen cylindrical cortical bone specimens were prepared from seven bovine tibiae obtained from a local abattoir (Martin’s Meats, Wakarusa, IN). The samples were taken from the osteonal region near the posterior and distal aspects of the bone. Samples were machined into 5 mm square by 50 mm long beams using a diamond saw (South Bay Technology, San Clemente, CA) and a CNC milling system (Sherline Products, Vista, CA). A CNC Lathe (Sherline) was used to turn the beams down to cylindrical dogbone shape samples with a gage length and diameter of 18.0 ± 0.36 mm and 3.0 ± 0.05 mm, respectively (Jepsen and Davy, 1997). The samples had square ends to facilitate gripping in the mechanical testing system (Fig. 1). The bone was kept hydrated with buffered saline throughout cutting using a water bath or drip irrigation systems.
Figure 1.
a) The geometry of the torsion sample. The nanoindentation sample was sectioned from the center of the gage length. b) Micrograph of the polished surface of the nanoindentation surface showing clearly visible osteons (50 X magnification).
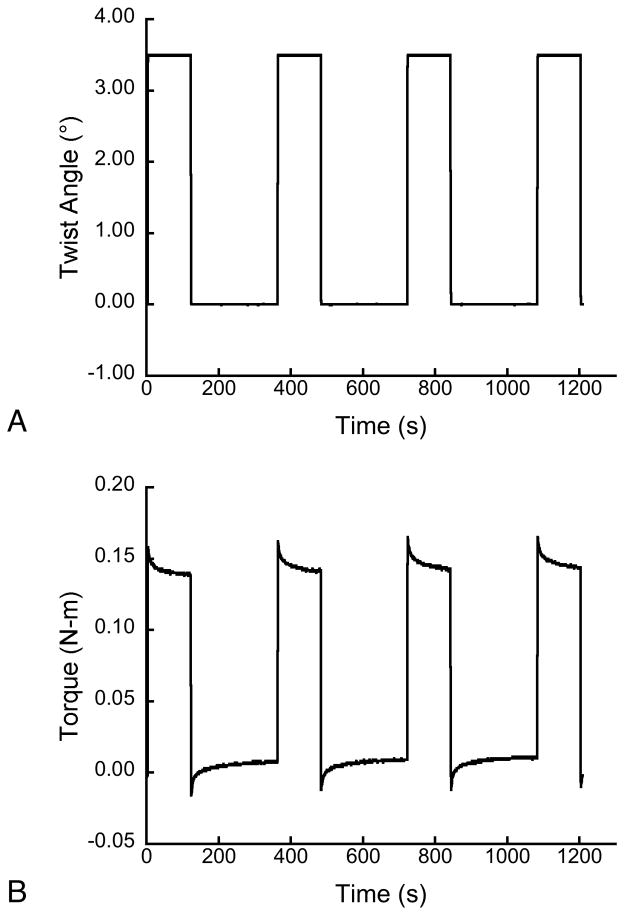
The elastic and stress-relaxation behavior of each sample was initially measured by torsional testing on a voice-coil actuated load frame (Bose/Enduratec, Eden Prairie, MN). Testing was performed in a bath of phosphate buffered saline at 37° C. The samples were loaded in displacement control to an angle of 3.5° at a rate 40°/s, held for 120 s, then returned to zero twist at 40°/s. The maximum shear strain in the samples was 0.5%, which was below the reported damage or yield level for cortical bone in torsion (Jepsen and Davy, 1997). The load-hold-unload protocol was repeated four times with a 240 sec interval between cycles (Fig. 2).
Figure 2.
The applied twist (a) and measured torque (b) for torsional stress relaxation experiments.
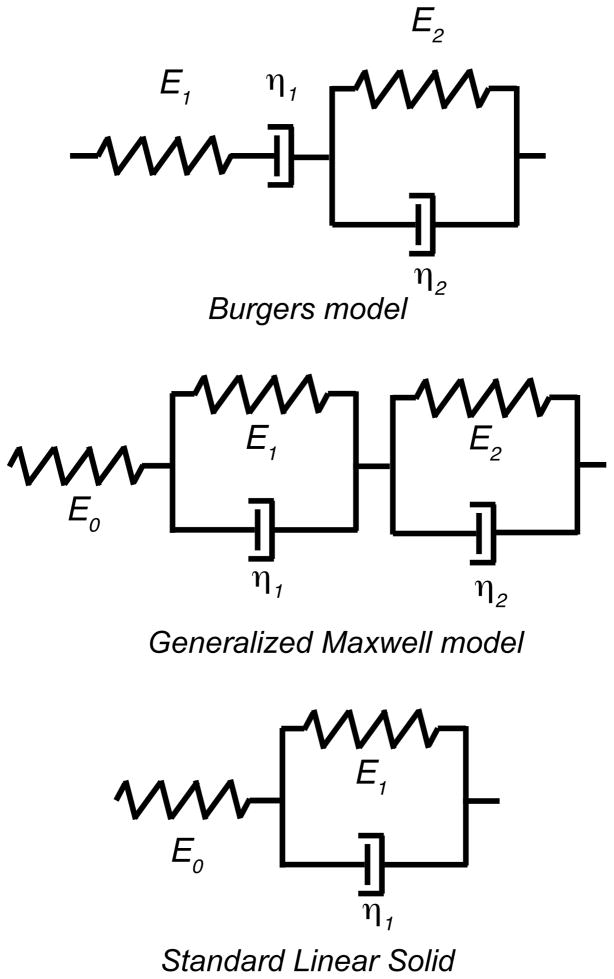
The viscoelastic behavior was determined by a fit to three different viscoelastic models (Fig. 3). The Burgers model and the generalized Maxwell model each have two time constants in stress relaxation, while he standard linear solid has only a single time constant. A limitation of Burgers model is that under stress relaxation the stress goes to zero, and in creep the material deforms indefinitely. Although creep deformation of bone does continue for at least several days even under small loads (Sasaki et al., 1993), this is not a physically realistic model for a solid. The generalized Maxwell model and the standard linear solid do not suffer from this limitation. The parameters of the viscoelastic models were determined by least squares curve fitting of the data using the lsqcurvefit module in Matlab (The Mathworks, Natick, MA). The theoretical relationships between stress-relaxation and creep were used to calculate the associated creep time constants, allowing direct comparison of the torsion and nanoindentation data (Table 1).
Figure 3.
Rheological models employed for creep behavior were the Burgers model (top) consisting of a Voigt and Maxwell element in series, the generalized Maxwell model (middle) with two Voigt elements and an elastic element in series, and the standard linear solid (bottom) with a single Voigt and elastic element in series.
Table 1.
Stress relaxation and creep formulae for the three viscoelastic models studied. The theoretical relationship between the stress relaxation and creep time constants is given in the third row {Findley, 1989 #6264}.
| Burgers Model | Generalized Maxwell Model | Standard Linear solid | ||||
|---|---|---|---|---|---|---|
| Stress Relaxation |
|
|
|
|||
| Creep |
|
|
|
|||
| Theoretical relation |
|
|
|
Following torsional testing, the samples were subjected to nanoindentation. A 5 mm thick sample was sectioned from the mid span of the gage region using a diamond saw (South Bay Technology, San Clemente, CA). One face of the sample was polished using a sequence of abrasives starting with 600 grit paper and ending with 1/4 micron alumina paste (Buehler, Lake Bluff, IL.), using deionized water as a lubricant. Osteons and interstitial bone were clearly distinguishable on the polished surface (Fig. 1b). The polished samples were mounted on a metal disk using cyanoacrylate glue (Loctite 401, Düsseldorf), and the disk was used to fix the sample to the magnetic chuck of the nanoindentation instrument (Hysitron, Eden Prarie, MN). The samples were thawed and kept hydrated by wrapping in gauze soaked in phosphate buffered saline until immediately before testing.
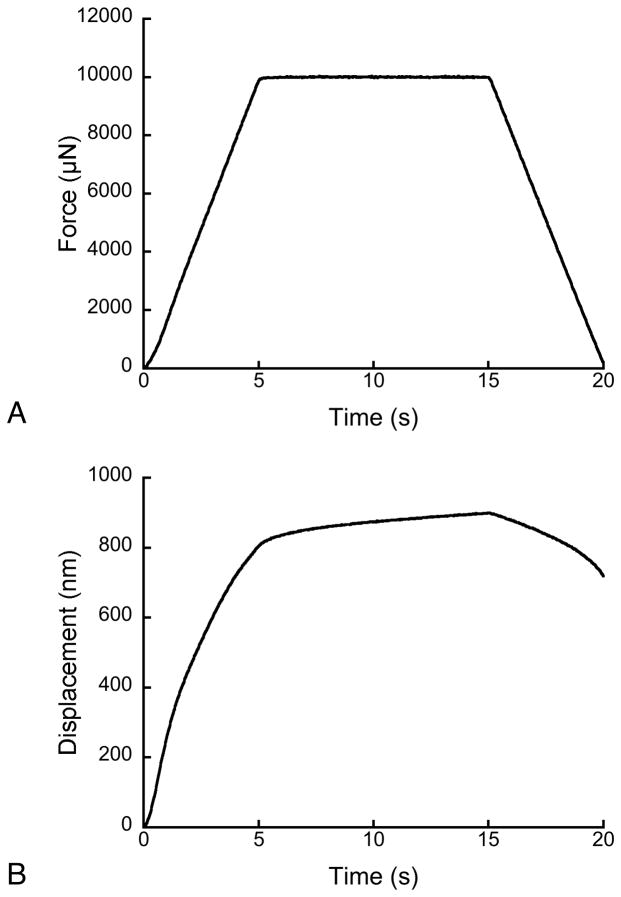
Each sample was indented 20 times in 20 different osteocytes using a Berkovich pyramidal indenter. All indentation locations were selected within osteons using the instrument’s internal microscope. After identifying a site, the indenter was advanced into the bone surface at a rate of 2.0 mN/s to a maximum load of 10 mN, then held at constant load for 10 seconds, and unloaded at 2.0 mN/s (Fig. 4). In some cases, the load-deformation curves exhibited obvious errors, probably due to indenting on or near an osteocyte lacuna or canalicula. These indents were identified and not used for further processing. The number of usable indentations in each sample ranged from 15 to 20, with a median of 18.
Figure 4.
The nanoindentation force signal (a) and the corresponding displacement history (b).
The elastic and creep properties were calculated for each indent. The reduced modulus was calculated by the Pharr–Oliver relationship, then converted to the elastic modulus by correcting for the modulus and Poisson’s ratio of the diamond tip (Pharr, 1992). The indenter tip shape was calibrated using fused quartz and aluminum calibration blocks in order to ensure that the depth and contact area were accurately measured. The viscoelastic parameters were calculated for the three creep relations, which were modified for the pyramidal indenter by including a factor for the indenter shape and assuming that the contact area increases with the square of depth (Fischer-Cripps, 2004; Huang et al., 2011; Oyen, 2005; Oyen and Cook, 2003; Oyen and Ko, 2007). For example the Burgers models is modified to:
| (1) |
where h is the indentation depth, P0 is the applied load, α is the equivalent cone semi-angle (70.3° for a Berkovich indenter), E1, E2, η1, and τσ = η2/E2 are the compliances and the viscous components associated with the Burgers model elements. The generalized Maxwell model and standard linear solid are similarly modified by replacing the stress on the right hand side with the applied load and tip angle function and the left hand side by the square of depth. The parameters for each sample were taken as the mean from all of the successful indents. Only the creep behavior was measured from nanoindentation, as calculation of the stress relaxation coefficients from the theoretical form assumes purely viscoelastic loading.
The elastic moduli cannot be determined directly from the hold phase of the indentation data when using a Berkovich indenter for two reasons. First, the equation assumes an instantaneous loading, while a ramp load is applied in reality. This can, however, be corrected for by multiplying the elastic constants in (1) by a ramp correction factor to account for the loading rate (Oyen, 2005). Second, the initial ramp loading includes significant permanent deformation and damage (Mullins et al., 2009; Zhang et al., 2010). This can only be corrected for using more complex models (Huang et al., 2011; Oyen and Cook, 2003). Instead E was determined from the unloading curve. However, if the deformation is assumed to be purely elastic during the holding period, the time constants are unaffected by these limitations.
To quantify the effect of drying during the nanoindentation process, which required from 30 to 45 minutes for 20 indents, the dependence of the elastic modulus and creep constant with the indentation sequence was also investigated.
In order to assess the effects of machine compliance in the mechanical tests, ultrasonic wave propagation was used to measure the elastic and shear moduli of the samples. The same samples used for nanoindentation were removed from the metal disks, and the glued surface was polished. Longitudinal and transverse ultrasonic (2.25 MHz) transducer-receiver pairs (Panametrics, Olympus NDT, Waltham, MA) were first calibrated using a metal gage block to ensure repeatability. The longitudinal and transverse wave speeds for each specimen were then measured using deionized water and honey, respectively, as the couplant fluids. The latter was used to compensate for the lower energy transmission of the transverse waves. Elastic wave theory was used to calculate the elastic coefficients from the measured wave speeds and the density of the test sample, which was measured by Archimedes’ principle (Ashman et al., 1984). The high frequency waves propagate as plane waves, resulting in the measurement of the elasticity tensor coefficient, C1111 or C1212. Young’s modulus was estimated from the elasticity coefficient by assuming that Poisson’s ratio was 0.3 in all directions, consistent with the assumptions for the nanoindentation measurements. For the shear waves, the elasticity tensor coefficient was taken as the shear modulus, assuming that the orthotropic axes of symmetry were coincident with the specimen axes.
Results
The torsion experiments resulted in a typical stress relaxation with exponential decay of the applied torque at fixed rotation. The residual torque was nearly constant after the 240 s hold period (Fig. 2B). The Burgers and generalized Maxwell models provided excellent fits to the data with squared correlation coefficients (R2) averaging 0.98 ± 0.01 (mean ± Std. Dev). The standard linear solid produced weaker, but acceptable fits with R2 averaging 0.92 ± 0.02.
The nanoindentation curves exhibited creep during the hold period at constant load (Fig. 4). As with the torsion measurements, the greater number of constants in the Burgers and Generalized Maxwell models provided improved fits to the data, although all three fits resulted in R2 > 0.98.
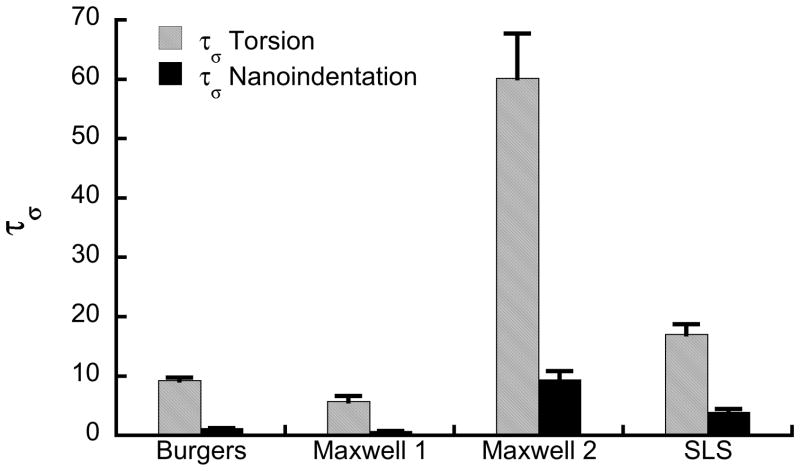
The time constants measured by nanoindentation were 4 to 8 times smaller than those measured by torsion testing (Fig. 5). The viscoelastic properties from nanoindentation and torsion were negatively correlated based on the Burgers model, but were uncorrelated when the generalized Maxwell or standard linear solid models were used (Fig. 6).
Figure 5.
The creep time constants measured by nanoindentation were an order of magnitude smaller than those measured in torsion (p<0.05).
Figure 6.
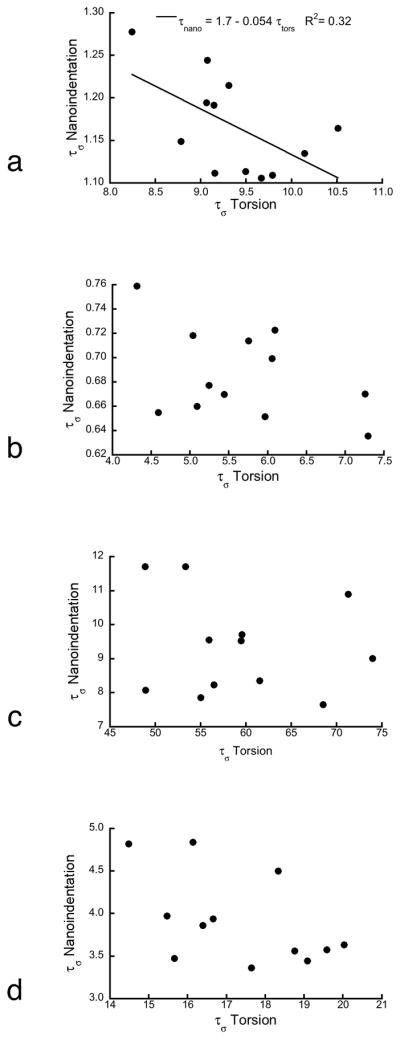
a) The fast time constant from nanoindentation was negatively correlated with that measured in torsion based on Burgers model (p < 0.02). b–d) The other two models exhibited no correlation in the time constants between length scales. b) Fast and c) slow time constants for generalized Maxwell model. d) Standard linear solid.
The shear and elastic moduli measured by torsion tests and nanoindentation, respectively, were consistent with the ultrasonic measurements. The instantaneous shear modulus measured in torsion was 5.85 ± 1.13 GPa (mean ± Std. Dev.), compared to 5.78 ± 1.11 measured by ultrasound (p=0.26, paired T-test), indicating that there was minimal error in the mechanical measurements due to machine compliance and sample geometry. The mean Young’s modulus measured by nanoindentation was 16.03 ± 1.39, compared to 15.85 ± 1.27 from ultrasonic measurements (p=0.20, paired T-test). The coefficient of variation (S.D./Mean) of the nanoindentation moduli was 0.14 ± 0.06, on average, indicating the consistency of the measurements for these load levels (Zhang et al., 2008).
Drying during testing did not appear to affect the modulus or creep time constant. The creep time constant for one of the twelve samples decreased by 16% over the course of 20 indentations (p < 0.05), while the remaining samples had no significant correlation between the creep constant and time. Similarly, the modulus was correlated with time for three samples, increasing by 24% during testing for one sample and decreasing by 28% and 16%, respectively, for two samples. The modulus was independent of time for the remaining nine samples.
Discussion
Nanoindentation has become an increasingly popular technique for analyzing the mechanical properties of bone at small length scales. However, interpretation of the results requires that the relationships between the nanoindentation measurements and traditional measurements are understood. The viscoelastic time constants measured by macroscopic torsion tests were weakly negatively correlated or uncorrelated with those measured by nanoindentation in osteons. Moreover, the time constants of the tissue were an order of magnitude smaller than the macroscopic time constants. This suggests that the macroscopic viscous behavior of bone is likely due to different mechanisms than the microscale behavior. For example, macroscopic viscoelasticity has been attributed to fluid flow in pores and interaction between microstructural interfaces (Lakes and Katz, 1979a), neither of which are captured in the small scale nanoindentation measurements. Due to the independence of macroscale and microscale viscoelasticity, care should be taken to use measures at the scale of interest when assessing the effects of viscoelasticity on bone mechanics.
The primary strength of this study was the direct comparison of viscoelastic parameters measured by torsion and nanoindentation on the same specimens. The direct comparison of the moduli measured by nanoindentation with the macroscopic modulus measured by ultrasound provided a validation of the nanoindentation method on the hydrated cortical bone samples. Similarly, the measurements of shear modulus by both torsion testing and ultrasound indicated that machine compliance did not affect the measurements. We also verified that there were no observable effects of drying on the samples during nanoindentation, although we used no additional measures to maintain hydration of the samples (Hoffler et al., 2005).
Some limitations must be considered in the interpretation of these results. The viscoelastic properties were measured on the macroscopic scale using torsion tests, while indentation assumes a triaxial stress state. It is a common assumption that viscoelastic behavior is primarily a deviatoric phenomenon in solids, with no effects on the dilatational stress (Holzapfel, 2000). Moreover, torsion testing was found to be more repeatable in preliminary testing, with less variation in the data between loading cycles than axial loading. As such, it was reasonable to compare the viscoelastic behavior measured by torsion testing to the nanoindentation behavior. Different viscoelastic parameters were also measured at the two length-scales, with stress relaxation measured at the macroscopic scale and creep measured at the microscale. In order to compare more directly, the torsion measurements were converted to find the equivalent creep constants based on each theoretical models. Finally, the time constants for nanoindentation were on the same order as the indentation time, but the loading phase was not considered while calculating the viscoelastic behavior. The holding time does affect the viscoelastic constants calculated (Wu et al., 2011), because the exponentials in the terms with small time constants tend to zero at later times and thereby become underweighted in the regression. In any case, the magnitude of the differences between the two cases is much greater than can be explained by the effect of the short holding time.
The differences in the viscoelastic properties at the two length scales are likely due to differences in structure, but could also be due to the different stress and loading states in each test. During the torsion test the samples stayed within the elastic regime and were thus only experiencing viscoelastic effects, while during the nanoindentation experiments they were deformed beyond the elastic limit such that damage and viscoplastic behavior may have affected the measurements, especially in the earliest part of the holding period. During the hold period of nanoindentation, the force, not the stress, is held constant. As such, the stress is continually decreasing during the creep process and should minimize plastic deformation and damage during the holding phase of the test. Moreover, in recent studies that employed semi-dynamic testing, there was clearly a viscoelastic component that was consistent with the creep measurements (Isaksson et al., 2010b), indicating that viscoplasticity is not the dominant factor in creep tests of bone.
The elastic properties measured by both torsion and nanoindentation are consistent with reports in the literature. The shear modulus of bovine cortical bone reported in the literature ranges from 5.0 (Jepsen and Davy, 1997; Sasaki and Enyo, 1995) to 8.71 GPa (Yoon and Katz, 1976), with the latter measurements performed on dry bone. The nanoindentation moduli are similarly consistent with reports for osteonal bone (Hengsberger et al., 2003a; Hoffler et al., 2005). While the agreement between the modulus measured by nanoindentation and by ultrasonic waves is consistent with previous studies (Turner et al., 1999), it is inconsistent with the differences in measurement scale and with the viscoelastic results. Nanoindentation measures the tissue level properties without pores (Hengsberger et al., 2003b), while ultrasound generally measures the homogenized properties. As such, the agreement between the composite modulus measured by ultrasonic waves and the microscale bone properties measured by nanoindentation may be a reflection of how waves propagate through the solid bone matrix or heterogeneity and imprecision in the density measures that might effect the wave propagation.
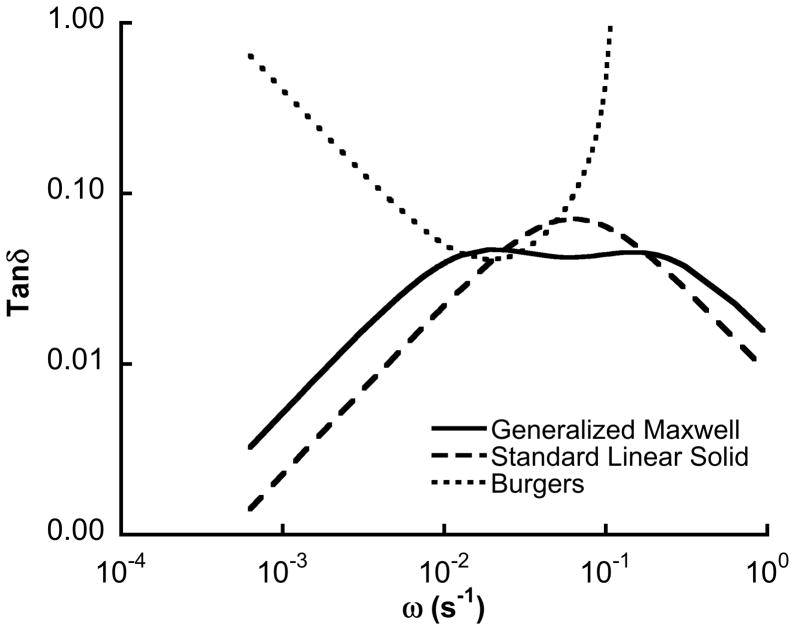
The seminal works on bone viscoelasticity by Lakes and Katz (Lakes and Katz, 1979a, b; Lakes et al., 1979) and Sasaki et al. (Sasaki and Enyo, 1995; Sasaki et al., 1993; Sasaki and Yoshikawa, 1993) suggest that the standard linear solid model is not appropriate for bone. The loss modulus for trabecular bone is relatively flat over a broad range of frequencies, indicating that simple linear models are not adequate to describe the viscoelastic behavior, and the relaxed shear modulus continues to decrease at times as long as 105 s (Lakes et al., 1979). As such, we employed the Burgers and generalized Maxwell models, which include two independent viscous parameters. A weakness of the Burgers model is that the loss tangent (tan δ) reaches a local minimum, followed by a local maximum and a monotonic decrease (Fig. 7). However, in the low frequency range relevant to stress relaxation, the loss tangent was consistent with literature reports (Lakes, 2001). In contrast, the loss tangent calculated based on the nanoindentation data was an order of magnitude higher for the same frequencies.
Figure 7.
The loss tangent calculated for the mean parameters measured in torsion. The loss tangent increases with decreasing frequency based on Burgers model, consistent with more complex models of creep (Lakes 2001). In comparison, the generalized Maxwell and standard linear solid models have a relatively narrow peak.
Overall, this study demonstrates that nanoindentation provides unique data regarding the viscoelasticity of bone, but it cannot be taken as a substitute for the macroscopic behavior. Along with other recent reports, the data indicate the utility of the Burgers rheological model to capture the nanoindentation behavior (Isaksson et al., 2010a; Isaksson et al., 2010b; Oyen and Ko, 2007; Wu et al., 2011)
Acknowledgments
This study was supported by the US National Institutes of Health (NIAMS) AR 500820
Footnotes
Publisher's Disclaimer: This is a PDF file of an unedited manuscript that has been accepted for publication. As a service to our customers we are providing this early version of the manuscript. The manuscript will undergo copyediting, typesetting, and review of the resulting proof before it is published in its final citable form. Please note that during the production process errors may be discovered which could affect the content, and all legal disclaimers that apply to the journal pertain.
References
- Ashman RB, Cowin SC, Van BWC, Rice JC. A continuous wave technique for the measurement of the elastic properties of cortical bone. J Biomech. 1984;17:349–361. doi: 10.1016/0021-9290(84)90029-0. [DOI] [PubMed] [Google Scholar]
- Fischer-Cripps AC. Materials Science and Engineering A. Vol. 385. 2004. A simple phenomenological approach to nanoindentation creep; pp. 74–82. [Google Scholar]
- Gupta HS, Schratter S, Tesch W, Roschger P, Berzlanovich A, Schoeberl T, Klaushofer K, Fratzl P. Two different correlations between nanoindentation modulus and mineral content in the bone-cartilage interface. J Struct Biol. 2005;149:138–148. doi: 10.1016/j.jsb.2004.10.010. [DOI] [PubMed] [Google Scholar]
- Hengsberger S, Enstroem J, Peyrin F, Zysset P. How is the indentation modulus of bone tissue related to its macroscopic elastic response? A validation study. J Biomech. 2003a;36:1503–1509. doi: 10.1016/s0021-9290(03)00131-3. [DOI] [PubMed] [Google Scholar]
- Hengsberger S, Enstroem J, Peyrin F, Zysset P. How is the indentation modulus of bone tissue related to its macroscopic elastic response? A validation study. J Biomech. 2003b;36:1503–1509. doi: 10.1016/s0021-9290(03)00131-3. [DOI] [PubMed] [Google Scholar]
- Hengsberger S, Kulik A, Zysset P. Nanoindentation discriminates the elastic properties of individual human bone lamellae under dry and physiological conditions. Bone. 2002;30:178–184. doi: 10.1016/s8756-3282(01)00624-x. [DOI] [PubMed] [Google Scholar]
- Hoffler CE, Guo XE, Zysset PK, Goldstein SA. An application of nanoindentation technique to measure bone tissue Lamellae properties. J Biomech Eng. 2005;127:1046–1053. doi: 10.1115/1.2073671. [DOI] [PubMed] [Google Scholar]
- Holzapfel GA. Nonlinear Solid Mechanics. John Wiley & Sons; New York: 2000. [Google Scholar]
- Huang CC, Wei MK, Lee S. Transient and steady-state nanoindentation creep of polymeric materials. International Journal of Plasticity. 2011;27:1093–1102. [Google Scholar]
- Huja SS, Beck FM, Thurman DT. Indentation properties of young and old osteons. Calcif Tissue Int. 2006;78:392–397. doi: 10.1007/s00223-006-0025-3. [DOI] [PubMed] [Google Scholar]
- Isaksson, Malkiewicz, Nowak, Helminen, Jurvelin Rabbit cortical bone tissue increases its elastic stiffness but becomes less viscoelastic with age. Bone. 2010;47:1030–1038. doi: 10.1016/j.bone.2010.08.015. [DOI] [PubMed] [Google Scholar]
- Isaksson Nagao, Ma≈Çkiewicz Julkunen, Nowak Jurvelin. Precision of nanoindentation protocols for measurement of viscoelasticity in cortical and trabecular bone. Journal of Biomechanics. 2010;43:2410–2417. doi: 10.1016/j.jbiomech.2010.04.017. [DOI] [PubMed] [Google Scholar]
- Jepsen KJ, Davy DT. Comparison of damage accumulation measures in human cortical bone. J Biomech. 1997;30:891–894. doi: 10.1016/s0021-9290(97)00036-5. [DOI] [PubMed] [Google Scholar]
- Lakes RS. Viscoelastic Properties of Cortical Bone. In: Cowin SC, editor. The Bone Mechanics Handbook. 2. CRC; New York: 2001. pp. 11.11–11.14. [Google Scholar]
- Lakes RS, Katz JL. Viscoelastic properties of wet cortical bone--II. Relaxation mechanisms. Journal of Biomechanics. 1979a;12:679–687. doi: 10.1016/0021-9290(79)90017-4. [DOI] [PubMed] [Google Scholar]
- Lakes RS, Katz JL. Viscoelastic properties of wet cortical bone--III. A non-linear constitutive equation. J Biomech. 1979b;12:689–698. doi: 10.1016/0021-9290(79)90018-6. [DOI] [PubMed] [Google Scholar]
- Lakes RS, Katz JL, Sternstein SS. Viscoelastic properties of wet cortical bone--I. Torsional and biaxial studies. Journal of Biomechanics. 1979;12:657–678. doi: 10.1016/0021-9290(79)90016-2. [DOI] [PubMed] [Google Scholar]
- Mullins, Bruzzi, McHugh Calibration of a constitutive model for the post-yield behaviour of cortical bone. Journal of the Mechanical Behavior of Biomedical Materials. 2009;2:460–470. doi: 10.1016/j.jmbbm.2008.11.003. [DOI] [PubMed] [Google Scholar]
- Odegard G, Gates T, Herring H. Characterization of viscoelastic properties of polymeric materials through nanoindentation. Exp Mech. 2005;45:130–136. [Google Scholar]
- Oliver WC, Pharr GM. Measurement of hardness and elastic modulus by instrumented indentation: advances in understanding and refinements to methodology. J Mater Res. 2004;19:3. [Google Scholar]
- Oyen Spherical indentation creep following ramp loading. Journal of Materials Research. 2005;20:2094–2100. [Google Scholar]
- Oyen Cook. Load-displacement behavior during sharp indentation of viscous-elastic-plastic materials. Journal of Materials Research. 2003;18:139–150. [Google Scholar]
- Oyen Ko. Examination of local variations in viscous, elastic, and plastic indentation responses in healing bone. Journal of materials science Materials in medicine. 2007;18:623–628. doi: 10.1007/s10856-007-2311-7. [DOI] [PubMed] [Google Scholar]
- Pharr GM. On the generality of the relationship among contact stiffness, contact area, and elastic modulus during indentation. J Mater Res. 1992;7:613. [Google Scholar]
- Rho JY, Currey JD, Zioupos P, Pharr GM. The anisotropic Young’s modulus of equine secondary osteones and interstitial bone determined by nanoindentation. J Exp Biol. 2001;204:1775–1781. doi: 10.1242/jeb.204.10.1775. [DOI] [PubMed] [Google Scholar]
- Rho JY, Roy ME, 2nd, Tsui TY, Pharr GM. Elastic properties of microstructural components of human bone tissue as measured by nanoindentation. J Biomed Mater Res. 1999a;45:48–54. doi: 10.1002/(sici)1097-4636(199904)45:1<48::aid-jbm7>3.0.co;2-5. [DOI] [PubMed] [Google Scholar]
- Rho JY, Tsui TY, Pharr GM. Elastic properties of human cortical and trabecular lamellar bone measured by nanoindentation. Biomaterials. 1997;18:1325–1330. doi: 10.1016/s0142-9612(97)00073-2. [DOI] [PubMed] [Google Scholar]
- Rho JY, Zioupos P, Currey JD, Pharr GM. Variations in the individual thick lamellar properties within osteons by nanoindentation. Bone. 1999b;25:295–300. doi: 10.1016/s8756-3282(99)00163-5. [DOI] [PubMed] [Google Scholar]
- Sasaki N, Enyo A. Viscoelastic properties of bone as a function of water content. J Biomech. 1995;28:809–815. doi: 10.1016/0021-9290(94)00130-v. [DOI] [PubMed] [Google Scholar]
- Sasaki N, Nakayama Y, Yoshikawa M, Enyo A. Stress relaxation function of bone and bone collagen. J Biomech. 1993;26:1369–1376. doi: 10.1016/0021-9290(93)90088-v. [DOI] [PubMed] [Google Scholar]
- Sasaki N, Yoshikawa M. Stress relaxation in native and EDTA-treated bone as a function of mineral content. J Biomech. 1993;26:77–83. doi: 10.1016/0021-9290(93)90615-l. [DOI] [PubMed] [Google Scholar]
- Turner CH, Rho J, Takano Y, Tsui TY, Pharr GM. The elastic properties of trabecular and cortical bone tissues are similar: results from two microscopic measurement techniques. J Biomech. 1999;32:437–441. doi: 10.1016/s0021-9290(98)00177-8. [DOI] [PubMed] [Google Scholar]
- Wu Z, Baker TA, Ovaert TC, Niebur GL. The effect of holding time on nanoindentation measurements of creep in bone. J Biomech. 2011;44:1066–1072. doi: 10.1016/j.jbiomech.2011.01.039. [DOI] [PMC free article] [PubMed] [Google Scholar]
- Yoon HS, Katz JL. Ultrasonic wave propagation in human cortical bone--II. Measurements of elastic properties and microhardness. J Biomech. 1976;9:459–464. doi: 10.1016/0021-9290(76)90089-0. [DOI] [PubMed] [Google Scholar]
- Zhang Michalenko, Kuhl Ovaert. Characterization of indentation response and stiffness reduction of bone using a continuum damage model. Journal of the Mechanical Behavior of Biomedical Materials. 2010;3:189–202. doi: 10.1016/j.jmbbm.2009.08.001. [DOI] [PMC free article] [PubMed] [Google Scholar]
- Zhang J, Niebur GL, Ovaert TC. Mechanical property determination of bone through nano- and micro-indentation testing and finite element simulation. J Biomech. 2008;41:267–275. doi: 10.1016/j.jbiomech.2007.09.019. [DOI] [PMC free article] [PubMed] [Google Scholar]
- Zioupos P. In vivo fatigue microcracks in human bone: material properties of the surrounding bone matrix. Eur J Morphol. 2005;42:31–41. doi: 10.1080/09243860500095463. [DOI] [PubMed] [Google Scholar]
- Zysset PK, Guo XE, Hoffler CE, Moore KE, Goldstein SA. Elastic modulus and hardness of cortical and trabecular bone lamellae measured by nanoindentation in the human femur. J Biomech. 1999;32:1005–1012. doi: 10.1016/s0021-9290(99)00111-6. [DOI] [PubMed] [Google Scholar]


