

Summary
Animal data demonstrate that the development of distinct cortical areas is influenced by genes that exhibit highly regionalized expression patterns. In this paper, we show genetic patterning of cortical surface area derived from MRI data from 406 adult human twins. We mapped genetic correlations of areal expansion between selected seed regions and all other cortical locations, with the selection of seed points based on results from animal studies. “Marching seeds” and a data-driven, hypothesis-free, fuzzy clustering approach provided convergent validation. The results reveal strong anterior-to-posterior graded, bilaterally symmetric patterns of regionalization, largely consistent with patterns previously reported in non-human mammalian models. Broad similarities in genetic patterning between rodents and humans may suggest a conservation of cortical patterning mechanisms while dissimilarities might reflect the functionalities most essential to each species.
Introduction
Cortical area development is controlled by the interplay of extrinsic and intrinsic mechanisms (O'Leary, 1989; Rakic, 1988). The former rely on subcortical afferents projecting to the developing cortex in a topographic manner (O'Leary et al., 2007). The latter include genetic regulation initiated by morphogens or signaling molecules that establish gradients of transcription factors across the ventricular zone (Rakic, 1988, reviewed in Rakic et al., 2009). It is now thought that intrinsic genetic mechanisms are major determinants of initial cortical area patterning (Bishop et al., 2000; Fukuchi-Shimogori and Grove, 2001; Mallamaci et al., 2000; O'Leary et al., 2007; Rakic, 1988; Rakic et al., 2009). In the early stages of development, highly regionalized gene expression patterns play a critical role in establishing cortical regionalization. The rudimentary genetically determined cortical regions serve as a template for selectively attracting afferents from appropriate thalamic nuclei and subsequently from other cortical regions to establish region-specific connections in order to refine areal features. The sequence of developmental events eventually gives rise to anatomically distinct and functionally specialized areas with unique connection features, a process known as cortical arealization (Monuki and Walsh, 2001; Sur and Rubenstein, 2005).
Animal studies have demonstrated at least two key regionalization phenomena. First, there is an anterior-posterior (A-P) gradient of gene expression of morphogens or transcription factors, such that specific genetic factors enlarge rostral/motor areas at the expense of caudal/somatosensory and visual areas and vice versa (Bishop et al., 2000; Fukuchi-Shimogori and Grove, 2001; Mallamaci et al., 2000). In addition to this A-P gradient, there is evidence for graded expression patterns along other distributions, including the medial-lateral and dorso-ventral (D-V) axes (Rakic et al., 2009). Second, these gradients of gene expression ultimately translate into discrete patterns, with alteration of the extent of expression patterns producing area boundary shifts with defined borders primarily along the A-P axis; these include the frontal/motor (F/M), primary somatosensory (S1), auditory (A1) and visual (V1) cortices (O'Leary et al., 2007), homologs of the human frontal lobe, postcentral cortex, temporal lobe and occipital lobe, respectively.
Though animal studies have shown that region-specific genetic influences are responsible for cortical regionalization, it is not known whether equivalent mechanisms govern the regionalization of the human brain. It might be that the patterning of genetic influences on regionalization corresponds to anatomical and functional connectivity, or hemispheric specialization (asymmetric patterns), given that each of these patterns plays an important role in human brain function (Kandel et al., 2000). We hypothesize, however, that genetic influences on regionalization in humans follow an A-P gradient, with bilaterally symmetric and defined boundaries corresponding to genetically based functional domains, similar to what has been observed in animal models.
The classical twin design combined with structural magnetic resonance imaging offers a unique approach to studying the aggregate genetic influences on brain phenotypic measures (see (Schmitt et al., 2007) for review). This approach is particularly advantageous for estimating genetic influences on a complex trait like human brain structure, which likely involves large numbers of genes and possibly gene-gene interactions. By examining the difference in similarity between monozygotic (MZ) and dizygotic (DZ) twins, the relative influence of genes (i.e., heritability) and the environment on variance of a phenotype can be determined (Eaves et al., 1978; Neale and Cardon, 1992). This method can be used further to determine the magnitude of genetic and environmental covariance between phenotypes; in other words, it is possible to estimate the degree to which phenotypes share common genetic and/or environmental influences. These estimates refer to genetic and environmental correlations, respectively.
Utilizing cortical surface reconstruction and spherical atlas mapping procedures developed by Dale and colleagues (Dale et al., 1999; Fischl et al., 1999b), we mapped each individual’s surface reconstruction into atlas space. Maps of subject-specific areal expansion or contraction were then computed based on the local stretching or compression needed to map the subject’s surface into atlas space (Rimol et al., 2010a). Next, to examine patterns of relative surface expansion, we divided the area measure at each location by the total surface area for each participant. The normalized data more directly correspond to the approach used in the animal literature (Bishop et al., 2000; Paxinos and Watson, 2007) and make it possible to examine genetic influences on cortical regionalization after accounting for global effects. Although registration with atlas space is driven by cortical folding patterns, there is evidence that the folds are good predictors of the locations of functionally distinct regions (Fischl et al., 1999b). Genetic correlations among measures of relative areal expansion at different points on the cortical surface reflect shared genetic influences on surface area between cortical regions, and for this reason were used to depict the genetic patterning of the cortex in this study.
We used three complementary approaches to explore the genetic patterns: (1) a hypothesis-driven, seed-based approach; (2) a “marching seed” approach; and (3) a hypothesis-free clustering approach. For the hypothesis-driven, seed-based approach, four seed points were placed at locations presumed homologous to the mouse “functional domains”. The V1 and S1 seed points were placed in the calcarine sulcus and postcentral gyrus, respectively. In order to adjust for the considerable expansion of human frontal and temporal cortices relative to those in the mouse, we also placed seed points in the rostral end of the frontal cortex (frontal pole) and temporal cortex (temporal pole). We then created maps of genetic correlations between each of these seed regions and all other locations in the cortex. To address potential bias due to the selection of seed regions, and to assess the sensitivity of the patterns to the exact locations of the seed points, we next used a grid of regularly spaced marching seeds distributed across the entire lateral aspect of one cortical hemisphere. Furthermore, we performed additional fine-grained 1-D marching seed analyses to identify gradual or abrupt transitions of the genetic patterning (Cohen et al., 2008). Finally, we employed a hypothesis-free approach—fuzzy clustering—that did not restrict the analysis to seed locations.
Results and Discussion
Genetic patterning shows an anterior-posterior division
The genetic correlations for the frontal pole seed point displayed a clear A-P division with a boundary separating positive and negative genetic correlations approximately aligned with the central sulcus (Figure S1 for anatomical location), a border between motor and sensory areas (Figure 1a). The positive genetic correlations in Figure 1a show that genetic factors associated with expansion of the surface area around the seed point (indicated by a black dot) are also associated with expansion of other frontal regions (indicated by the red-to-yellow color scale). The negative genetic correlations in the posterior regions show that genetic influences associated with areal expansion of the frontal pole seed region cause relative areal contraction in posterior regions (indicated by the blue-to-cyan color scale). Findings from several mouse studies using experimental inhibition or overexpression of specific genes support the antagonistic A-P genetic effects. For instance, the transcription factor Pax6 has anterior-high to posterior-low gradients of gene expression and promotes frontal/motor areal expansion (Bishop et al., 2000). Another transcription factor, Emx2, is expressed in an opposite gradient (Bishop et al., 2000; Mallamaci et al., 2000). Furthermore, Pax6 and Emx2 mutually suppress one another’s expression, regulating areal expansion.
Figure 1. Genetic patterning of the human cortex based on genetic correlations from the hypothesis-driven seed-based approach.
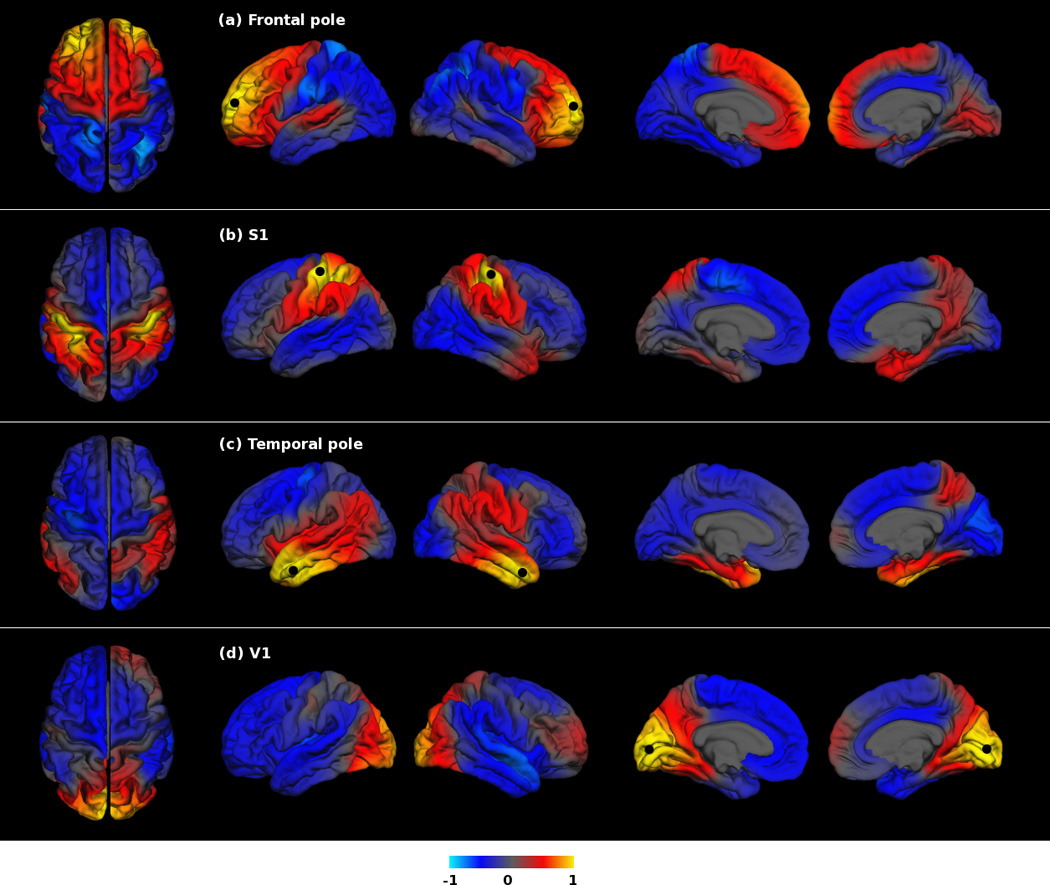
Genetic correlation maps with black dots indicating the frontal pole, S1, temporal pole and V1 seed regions. From left to right, the columns show the following views: superior, left hemisphere lateral, right hemisphere lateral, left hemisphere medial, right hemisphere medial. Color scale indicates the strength of genetic correlations between the surface area at the seed region and at all other locations on the cortical surface; these correlations range from positive to negative.
Genetic patterning corresponds to regions observed in rodent studies
In addition to the A-P division described above (Figure 1a), positive genetic correlations were observed around the S1 seed region in the primary sensory and superior parietal cortices, and partially in the primary motor cortex (Figure 1b). Genetic correlations with S1 resulted in a primarily postcentral division, with correlations becoming negative anterior to the precentral sulcus and roughly posterior and inferior to the parietal lobe. Area patterning for the anterior temporal pole seed point showed positive genetic correlations primarily in the temporal lobes, including the presumed human homolog of mouse A1, with negative genetic correlations in the rostral and caudal regions (Figure 1c). For the V1 seed region, we observed strong positive genetic correlations covering the occipital cortex. The correlations extended partially to the superior parietal cortex, which was suggestive of the dorsal stream of the visual system (Kandel et al., 2000). Genetic correlations with the V1 seed region were negative for anterior temporal and frontal cortices (Figure 1d). The boundaries of the genetic correlations corresponded substantially to known anatomical landmarks (e.g., major sulci such as the central sulcus). However, some boundaries did not match any traditional anatomical divisions. The observed patterns may reflect the combinatory actions of many other molecular gradients, including D-V and medial-lateral gradients in addition to A-P gradients.
The regionalized pattern of genetic influences was further confirmed by our analysis using a grid of 34 different seeds. As can be seen in Figure 2, the frontal cortex constituted one partition, comprising all regions anterior to the central sulcus. There were also occipital, temporal and postcentral partitions. In all cases, the highest genetic correlations were observed in the region closest to each seed. However, the pattern of positive (red/yellow) versus negative (blue/cyan) genetic correlations yielded essentially the same four divisions regardless of where in a division the seed was placed.
Figure 2. A grid placement of genetic correlation maps from 34 different seeds.
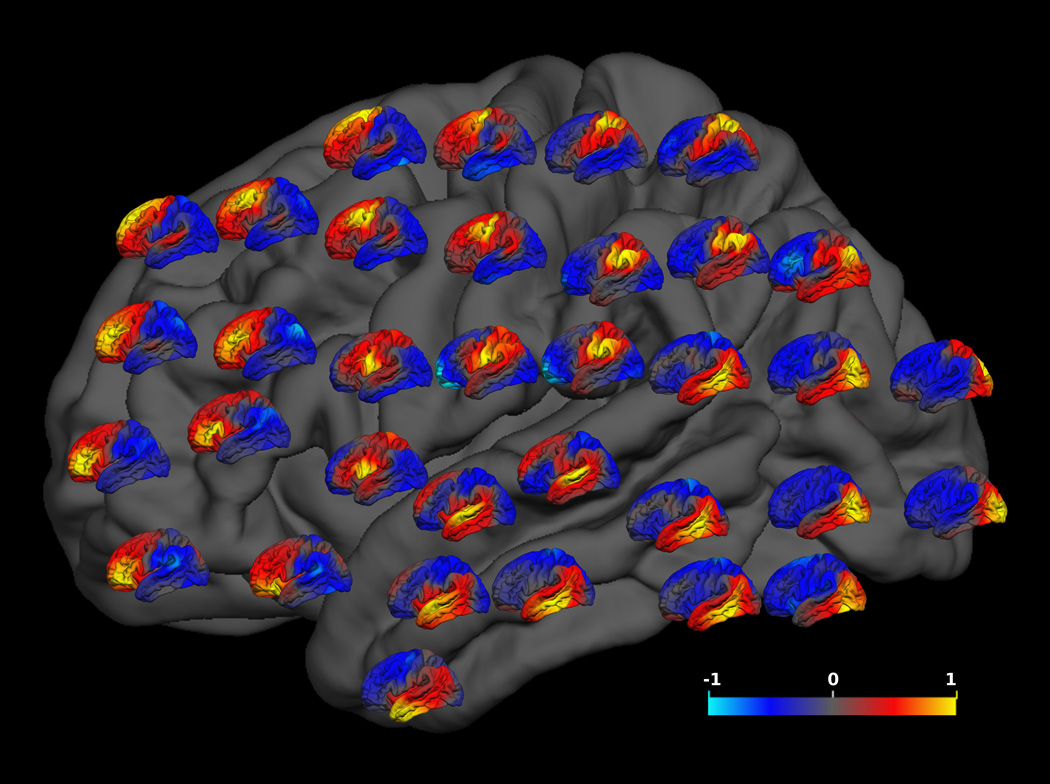
The location of each small genetic correlation map on the grey brain map represents the location of the seed for that correlation map. Conventions as in Figure 2
Next, we conducted additional fine-grained 1-D marching seed analyses to determine whether boundaries of genetic correlation patterns represented gradual or abrupt transitions. Notably, the genetic correlation patterns indicated relatively discrete regional domains, some with well-defined boundaries (e.g., with relatively abrupt transitions from positive to negative genetic correlations). The sharpest transitions were found along the A-P axis between frontal and posterior regions (Figure 3B) and along the D-V axis between parietal and temporal lobes (Figure 3C). Other boundaries had less abrupt transitions. It is possible that the boundaries in the genetic correlation patterns observed here are related to mechanisms that control the degree of compartment boundary restriction in gene expression data (Kiecker and Lumsden, 2005).
Figure 3. Fine-grained 1-D marching seed analysis.
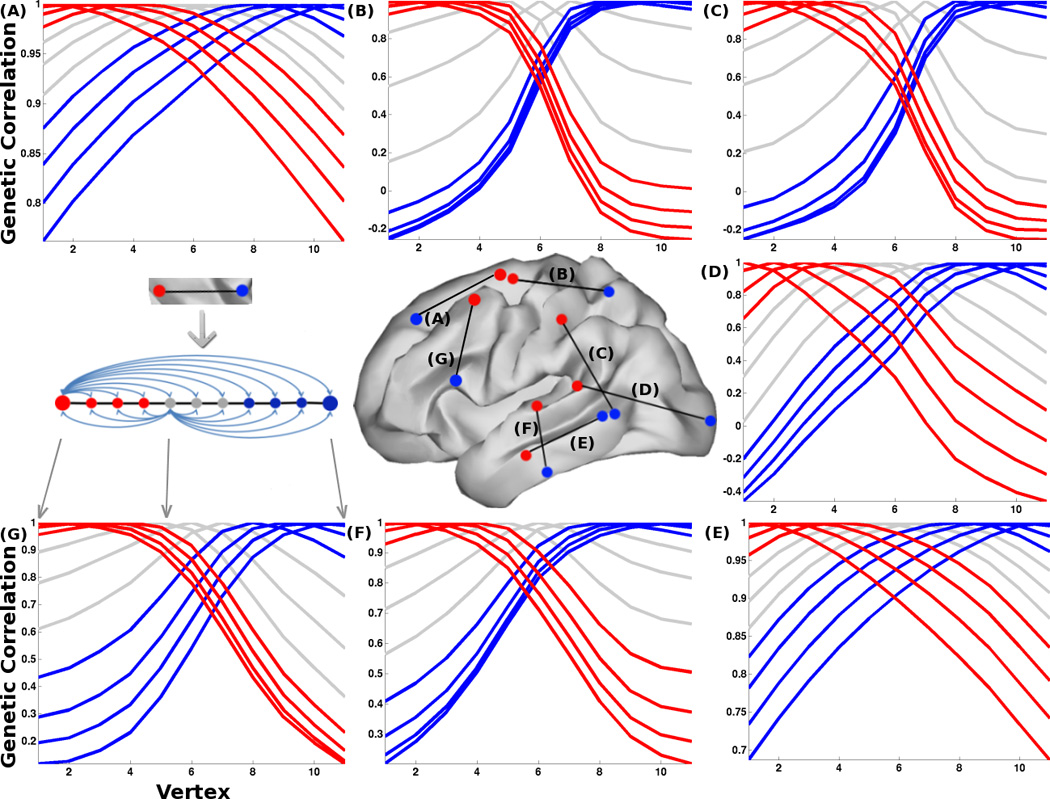
The brain map shows the anatomical locations of the 1-D paths that we sampled to determine the abruptness of the transitions of genetic correlation patterns. We sampled the boundaries between lobes (B, C, D) and between subdivisions within the frontal (A, G) and temporal (F, E) lobes. This includes presumed human-specific, language-related areal boundaries between auditory and inferior temporal cortex (F) and between inferior frontal gyrus/Broca’s Area and middle frontal gyrus (G). The positions of 1-D paths were also chosen to be roughly along the A-P or D-V axes. The line plots correspond to the transition trajectories of genetic correlations for each pair of cortical regions. Genetic correlations were calculated between all pairs of vertices on each path (illustrated for two sample locations on the left side of the second row). The red lines represent the points close to the red dot end and the blue lines represent the points close to the blue dot end. The grey lines represent the points in the middle. Because their locations are close to putative boundaries, the transition profile can be obscured substantially by MRI spatial smoothing. Path (B) shows a clear example of an abrupt transition, with steep slopes of genetic correlations and “bunching” of transition trajectories for different vertices. Paths (A) and (E) are examples of gradual transitions, where the genetic correlations fall off evenly with distance from each vertex along the paths. Genetic correlations between lobes range from positive to negative regardless of a gradual or sharp transition, whereas genetic correlations within lobes also show gradual or sharp transitions but remain positive.
One might still wonder if our choice of seed placement (either singly or in a grid) somehow influenced this mostly lobar organization. To address that question, we used fuzzy clustering to partition the cortex into four divisions, based on a distance matrix computed from pair-wise genetic correlations. Using this data-driven approach, making no a priori assumptions about the locations or shapes of the clusters, yielded a pattern remarkably similar to that found using the seed point approach (Figure 4; see Figure S2 for a correlation analysis between the maps). Note that the genetic correlation matrix, the input for the clustering analysis, did not contain any spatial information (e.g., distance between vertices).
Figure 4. Clustering map.
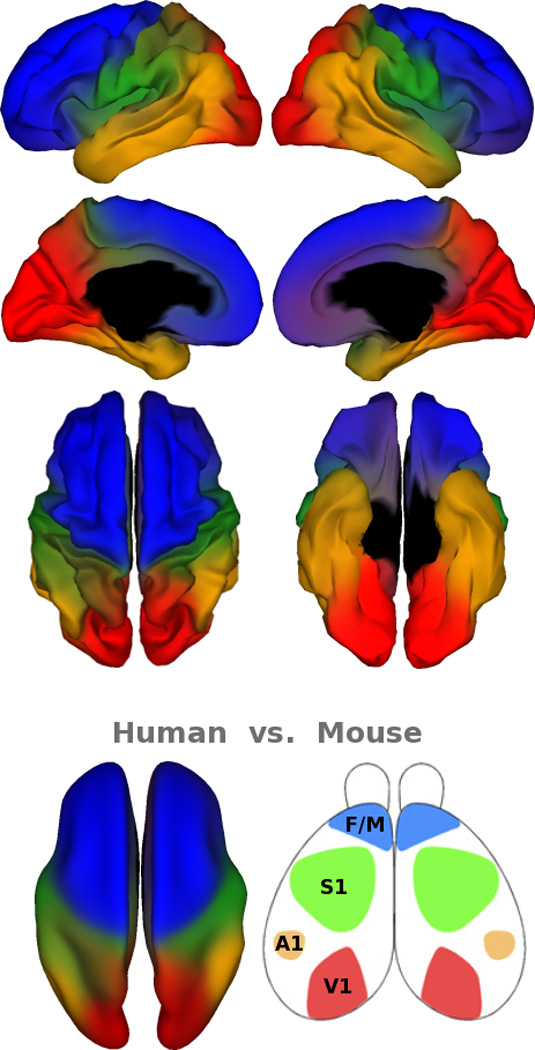
Clusters derived from a fuzzy cluster analysis show the four major genetic divisions. The bottom row compares cortical regionalization between mice and humans. The left side shows the human cortical regionalization displayed from an inflated top view. The right side shows cortical regionalization in the mouse model adapted from O’Leary et al. (2007).
Differences in genetic patterning between mice and humans
Although the broad organization of genetic patterning is substantially similar between mice and humans, our results provide clear evidence of important species-specific differences. Specifically, the proportional size of each region is different, indicating that the thousand-fold enlargement of cortical surface area in humans compared to mice is disproportionate across the cortex (Rakic et al., 2009). Changes in a region’s proportional size may have significant consequences with respect to brain function. For example, the genetic divisions of frontal and temporal cortices in humans are disproportionally expanded, which may be linked to the addition of cortical areas and the evolution of human traits such as language and social behavior. Interestingly, we noted a degree of inhomogeneity in genetic correlation patterns in the frontal lobe: One of sharpest borders was along the D-V axis of prefrontal cortex observed around the left inferior frontal gyrus, possibly corresponding to Broca’s area (Figure 3G). We also found an abrupt transition in genetic correlations across the superior temporal sulcus (Figure 3F). The relatively sharper boundaries observed with the genetic correlation patterns that define language-related regions are of interest, as they suggest the presence of genetic influences partially distinct from those of neighboring regions. Such genetic divergence could be the basis for evolving human specializations. This result, depicting region-specific and species-specific patterns, is comparable to findings from genomic studies. For example, the gene CNTNAP2, which is related to autism and language delay, exhibits highly regionalized expression in the frontal and anterior temporal cortices in humans but has no comparable analogue expression pattern in rodents (Abrahams et al., 2007; Alarcon et al., 2008). In addition to the frontotemporal expansion, our map shows a large occipital genetic partition. It is well established that primates—including humans—are highly visual, and have more functional areas in the visual cortex than mice do (Hill and Walsh, 2005). Conversely, mice rely more on the somatosensory modality, with a correspondingly expanded representation of the whiskers within area S1, while this region is disproportionally small in humans. In sum, the phenotypic differences in cortical area between mice and humans are marked not only by a dramatic increase in size, but also by differential expansion, greater hemispheric specialization and presumably the addition of specialized cortical areas (Rakic et al., 2009; Sun et al., 2005). We show here that the genetic patterning also reflects these species-specific differences.
Mostly symmetric genetic patterning between hemispheres
Our results show that the genetic patterning between the two hemispheres is primarily symmetric. First, our seed point analysis revealed strong genetic correlations between the seed and its equivalent location in the contralateral hemisphere (Figure S3). Second, we performed separate analyses of the left and right hemispheres—in addition to our main cluster analysis, in which we combined data from left and right hemispheres for partitioning—and the patterns identified in the left and right hemispheres were almost mirror images of one another (Figure S4). Although symmetry is a predominant feature of the genetic correlation patterns, there are indications of interhemispheric differences around the perisylvian and parietal regions. Hemispheric asymmetries in the perisylvian area observed here and in previous gene expression studies (Abrahams et al., 2007; Sun et al., 2005) are of particular interest because of the critical role that human language processing, which also tends to be lateralized, plays in this region. We also noted an interesting pattern of regional correlational asymmetry. Positive genetic correlations between the frontal cortex and superior temporal gyrus, regions implicated in language processing, are present exclusively on the left side, the language dominant hemisphere (Abrahams et al., 2007; Kandel et al., 2000).
Lack of long-distance correlation patterns
Strong long-distance or cross-region correlation patterns were not present in either the grid analysis or clustering analysis, although we observed some weak positive correlations between distal regions (Figure 1). The clustering algorithm finds one optimal clustering solution for all data points simultaneously (about 5,000 cortical vertices). Thus, while the most prominent features are captured, subtle patterns may be obscured. In contrast, the grid of seeds, based on extensive bivariate analyses implemented independently in every pair between the seed and each cortical location with finer spatial resolution (about 300,000 vertices), allows subtle patterns to emerge. The only strong evidence of long-distance genetic correlations was observed between the seed and its equivalent location in the contralateral hemisphere (Figure S3). The lack of strong long-range genetic correlations for cortical surface area measures is not simply a function of our methodology, however. Indeed, it stands in contrast with our previous cortical thickness findings, which did show long-distance genetic correlations, for example, between prefrontal and parietal regions (Rimol et al., 2010b). The evidence thus suggests different genetic patterning of cortical area and thickness regionalization. Such differences are consistent with evidence of distinct genetic influences on cortical surface area and thickness (Panizzon et al., 2009). It is worth clarifying that it has become almost automatic for correlations between brain regions to be referred to as connectivity, but here we avoid that terminology simply because genetic correlations between regions do not necessarily imply anatomical connectivity.
Evidence of regional genetic effects from other human data
Spontaneous mutations in humans offer a natural opportunity to glean insights into genetic control of cortical development. For example, polymicrogyria is a form of genetically determined cortical malformations in humans. An interesting feature of this disorder is that it often develops only in specific regions of the cortex, leaving others relatively intact, supporting the notion of regional genetic influences on cortical area development (Chang et al., 2003). Some specific genes, such as MECP2 and those in the MCPH family, have been linked to variations in human cortical surface area (Joyner et al., 2009; Rimol et al., 2010a).
With advances in genomic techniques, a recent report using exon microarrays to examine the human fetal brain found that almost one-third of expressed genes are regionally differentially expressed and/or differentially spliced (Johnson et al., 2009). Furthermore, using in situ hybridization, a human fetal study directly analyzed the genes implicated in arealization in rodent studies, revealing similar gradients of expression between humans and rodents (Bayatti et al., 2008). Post-mortem analysis of two human adult brains in the Allen Human Brain Atlas database showed regional gene expression, including genes studied in mouse models of arealization (http://www.brain-map.org/); this analysis suggested that some of the gene expression patterns established during corticogenesis may be retained into adulthood (Zapala et al., 2005).
Conclusions
Our multi-pronged approach provided convergent validation that genetically influenced cortical areal patterns are similar between humans and rodents, suggesting a conservation of broad patterning mechanisms across mammalian species. The patterning exhibits an A-P, D-V, and bilaterally symmetric organization defined by morphogenetic gradients, which give rise to a mostly lobar pattern in the human cortex. The key mechanism of such genetic regulation seems to be shared by various body parts and preserved throughout the animal kingdom, from those with a rudimentary nervous system (such as drosophila) to humans (Kandel et al., 2000; Nussleinvolhard and Wieschaus, 1980). Our study offered evidence in support of this notion in normally developed human cortex. Modifications in genetic patterning are essential to both region-specific and species-specific morphology, connection and function. Our results also showed differences in the genetic patterning between humans and rodents that are consistent with functional specializations for each species. Overall, these findings appear to be consistent with the idea that genetic patterning establishes a blueprint for evolutionary modification on heritable phenotypes, and for elaboration of distinct cortical maps over the course of development across individuals.
Experimental Procedures
The participants were 406 middle-aged men (55.8 (±2.6) years old) from the Vietnam Era Twin Study of Aging (VETSA) (Kremen et al., 2006). They included 110 MZ and 93 DZ twin pairs. T1-weighted MR images were acquired on Siemens 1.5 Tesla scanners at the University of California, San Diego or at Massachusetts General Hospital. The cortical surface was reconstructed to measure surface areas at each surface location (a total of more than 300,000 locations for both hemispheres) by FreeSurfer software (Dale et al., 1999; Fischl et al., 1999a). We estimated genetic correlations of surface area measures between regions using Mx, structural equation modeling software for genetically informative data (Neale et al., 2004). Fuzzy cluster analysis was performed using the cluster package implemented in R (http://www.r-project.org/) (Kaufman and Rousseeuw, 1990). Supplemental Data including Experimental Procedures and 3 figures can be found online.
Highlights.
Overall genetic regionalization in humans reflects general mammalian patterning
The patterns are largely bilaterally symmetric and correspond to lobar divisions
There are also regionalization differences consistent with species-specific features
The genetic patterns of the cortical surface area and thickness are different
Supplementary Material
Acknowledgments
Funded by National Institute on Aging (AG022381, AG018386, AG018384, AG022982, AG031224), National Institute of Drug Abuse (DA029475), and National Institute of Neurological Disorders and Stroke (NS056883). The US Department of Veterans Affairs has provided financial support for the development and maintenance of the Vietnam Era Twin (VET) Registry.
Footnotes
Publisher's Disclaimer: This is a PDF file of an unedited manuscript that has been accepted for publication. As a service to our customers we are providing this early version of the manuscript. The manuscript will undergo copyediting, typesetting, and review of the resulting proof before it is published in its final citable form. Please note that during the production process errors may be discovered which could affect the content, and all legal disclaimers that apply to the journal pertain.
Competing financial interests
Anders M. Dale is a founder and holds equity in CorTechs Laboratories, Inc., and also serves on its Scientific Advisory Board. The terms of this arrangement have been reviewed and approved by the University of California, San Diego, in accordance with its conflict of interest policies.
References
- Abrahams BS, Tentler D, Perederiy JV, Oldham MC, Coppola G, Geschwind DH. Genome-wide analyses of human perisylvian cerebral cortical patterning. Proc Natl Acad Sci U S A. 2007;104:17849–17854. doi: 10.1073/pnas.0706128104. [DOI] [PMC free article] [PubMed] [Google Scholar]
- Alarcon M, Abrahams BS, Stone JL, Duvall JA, Perederiy JV, Bomar JM, Sebat J, Wigler M, Martin CL, Ledbetter DH, et al. Linkage, association, and gene-expression analyses identify CNTNAP2 as an autism-susceptibility gene. Am J Hum Genet. 2008;82:150–159. doi: 10.1016/j.ajhg.2007.09.005. [DOI] [PMC free article] [PubMed] [Google Scholar]
- Bayatti N, Sarma S, Shaw C, Eyre JA, Vouyiouklis DA, Lindsay S, Clowry GJ. Progressive loss of PAX6, TBR2, NEUROD and TBR1 mRNA gradients correlates with translocation of EMX2 to the cortical plate during human cortical development. Eur J Neurosci. 2008;28:1449–1456. doi: 10.1111/j.1460-9568.2008.06475.x. [DOI] [PMC free article] [PubMed] [Google Scholar]
- Bishop KM, Goudreau G, O'Leary DD. Regulation of area identity in the mammalian neocortex by Emx2 and Pax6. Science. 2000;288:344–349. doi: 10.1126/science.288.5464.344. [DOI] [PubMed] [Google Scholar]
- Chang BS, Piao X, Bodell A, Basel-Vanagaite L, Straussberg R, Dobyns WB, Qasrawi B, Winter RM, Innes AM, Voit T, et al. Bilateral frontoparietal polymicrogyria: clinical and radiological features in 10 families with linkage to chromosome 16. Ann Neurol. 2003;53:596–606. doi: 10.1002/ana.10520. [DOI] [PubMed] [Google Scholar]
- Cohen AL, Fair DA, Dosenbach NU, Miezin FM, Dierker D, Van Essen DC, Schlaggar BL, Petersen SE. Defining functional areas in individual human brains using resting functional connectivity MRI. Neuroimage. 2008;41:45–57. doi: 10.1016/j.neuroimage.2008.01.066. [DOI] [PMC free article] [PubMed] [Google Scholar]
- Dale AM, Fischl B, Sereno MI. Cortical surface-based analysis. I: Segmentation and surface reconstruction. Neuroimage. 1999;9:179–194. doi: 10.1006/nimg.1998.0395. [DOI] [PubMed] [Google Scholar]
- Eaves LJ, Last KA, Young PA, Martin NG. Model-fitting approaches to the analysis of human behavior. Heredity. 1978;41:249–320. doi: 10.1038/hdy.1978.101. [DOI] [PubMed] [Google Scholar]
- Fischl B, Sereno MI, Dale AM. Cortical surface-based analysis. II: Inflation, flattening, and a surface-based coordinate system. Neuroimage. 1999a;9:195–207. doi: 10.1006/nimg.1998.0396. [DOI] [PubMed] [Google Scholar]
- Fischl B, Sereno MI, Tootell RBH, Dale AM. High-resolution inter-subject averaging and a coordinate system for the cortical surface. Human Brain Mapping. 1999b;8:272–284. doi: 10.1002/(SICI)1097-0193(1999)8:4<272::AID-HBM10>3.0.CO;2-4. [DOI] [PMC free article] [PubMed] [Google Scholar]
- Fukuchi-Shimogori T, Grove EA. Neocortex patterning by the secreted signaling molecule FGF8. Science. 2001;294:1071–1074. doi: 10.1126/science.1064252. [DOI] [PubMed] [Google Scholar]
- Hill RS, Walsh CA. Molecular insights into human brain evolution. Nature. 2005;437:64–67. doi: 10.1038/nature04103. [DOI] [PubMed] [Google Scholar]
- Johnson MB, Kawasawa YI, Mason CE, Krsnik Z, Coppola G, Bogdanovic D, Geschwind DH, Mane SM, State MW, Sestan N. Functional and evolutionary insights into human brain development through global transcriptome analysis. Neuron. 2009;62:494–509. doi: 10.1016/j.neuron.2009.03.027. [DOI] [PMC free article] [PubMed] [Google Scholar]
- Joyner AH, Roddey JC, Bloss CS, Bakken TE, Rimol LM, Melle I, Agartz I, Djurovic S, Topol EJ, Schork NJ, et al. A common MECP2 haplotype associates with reduced cortical surface area in humans in two independent populations. Proceedings of the National Academy of Sciences USA. 2009;106:15483–15488. doi: 10.1073/pnas.0901866106. [DOI] [PMC free article] [PubMed] [Google Scholar]
- Kandel ER, Schwartz JH, Jessell TM, editors. Principles of Neural Science. Fourth Edition. The McGraw-Hill Companies, Inc.; 2000. [Google Scholar]
- Kaufman L, Rousseeuw P. Finding Groups in Data An Introduction to Cluster Analysis. John Wiley & Sons, Inc.; 1990. [Google Scholar]
- Kiecker C, Lumsden A. Compartments and their boundaries in vertebrate brain development. Nat Rev Neurosci. 2005;6:553–564. doi: 10.1038/nrn1702. [DOI] [PubMed] [Google Scholar]
- Kremen WS, Thompson-Brenner H, Leung YJ, Grant MD, Franz CE, Eisen SA, Jacobson KC, Boake C, Lyons MJ. Genes, environment, and time: The Vietnam Era Twin Study of Aging (VETSA) Twin Research and Human Genetics. 2006;9:1009–1022. doi: 10.1375/183242706779462750. [DOI] [PubMed] [Google Scholar]
- Mallamaci A, Muzio L, Chan CH, Parnavelas J, Boncinelli E. Area identity shifts in the early cerebral cortex of Emx2−/− mutant mice. Nat Neurosci. 2000;3:679–686. doi: 10.1038/76630. [DOI] [PubMed] [Google Scholar]
- Monuki ES, Walsh CA. Mechanisms of cerebral cortical patterning in mice and humans. Nat Neurosci. 2001;4 Suppl:1199–1206. doi: 10.1038/nn752. [DOI] [PubMed] [Google Scholar]
- Neale MC, Boker SM, Xie G, Maes HH. Mx: Statistical Modeling. 6th edn. Richmond, VA: Department of Psychiatry, Medical College of Virginia; 2004. [Google Scholar]
- Neale MC, Cardon LR. Methodology for genetic studies of twins and families. Dordrecht, The Netherlands: Kluwer Academic Publishers; 1992. [Google Scholar]
- Nussleinvolhard C, Wieschaus E. Mutations Affecting Segment Number and Polarity in Drosophila. Nature. 1980;287:795–801. doi: 10.1038/287795a0. [DOI] [PubMed] [Google Scholar]
- O'Leary DD. Do cortical areas emerge from a protocortex? Trends Neurosci. 1989;12:400–406. doi: 10.1016/0166-2236(89)90080-5. [DOI] [PubMed] [Google Scholar]
- O'Leary DD, Chou SJ, Sahara S. Area patterning of the mammalian cortex. Neuron. 2007;56:252–269. doi: 10.1016/j.neuron.2007.10.010. [DOI] [PubMed] [Google Scholar]
- Panizzon MS, Fennema-Notestine C, Eyler LT, Jernigan TL, Prom-Wormley E, Neale MC, Jacobson KC, Lyons MJ, Grant MD, Franz CE, et al. Distinct genetic influences on cortical surface area and cortical thickness. Cerebral Cortex. 2009;19:2728–2735. doi: 10.1093/cercor/bhp026. [DOI] [PMC free article] [PubMed] [Google Scholar]
- Paxinos G, Watson C. The rat brain in stereotaxic coordinates. sixth edition. Academic Press; 2007. [Google Scholar]
- Rakic P. Specification of cerebral cortical areas. Science. 1988;241:170–176. doi: 10.1126/science.3291116. [DOI] [PubMed] [Google Scholar]
- Rakic P, Ayoub AE, Breunig JJ, Dominguez MH. Decision by division: making cortical maps. Trends Neurosci. 2009;32:291–301. doi: 10.1016/j.tins.2009.01.007. [DOI] [PMC free article] [PubMed] [Google Scholar]
- Rimol LM, Agartz I, Djurovic S, Brown AA, Roddey JC, Kähler AK, Mattingsdal M, Athanasiu L, Joyner AH, Schork NJ, et al. Sex-dependent association of common variants of microcephaly genes with brain structure. Proceedings of the National Academy of Sciences U.S.A. 2010a;108:384–388. doi: 10.1073/pnas.0908454107. [DOI] [PMC free article] [PubMed] [Google Scholar]
- Rimol LM, Panizzon MS, Fennema-Notestine C, Eyler LT, Fischl B, Franz CE, Hagler DJ, Lyons MJ, Neale MC, Pacheco J, et al. Cortical thickness is influenced by regionally-specific genetic factors. Biological Psychiatry. 2010b;67:493–499. doi: 10.1016/j.biopsych.2009.09.032. [DOI] [PMC free article] [PubMed] [Google Scholar]
- Schmitt JE, Eyler LT, Giedd JN, Kremen WS, Kendler KS, Neale MC. Review of twin and family studies on neuroanatomic phenotypes and typical neurodevelopment. Twin Research and Human Genetics. 2007;10:683–694. doi: 10.1375/twin.10.5.683. [DOI] [PMC free article] [PubMed] [Google Scholar]
- Sun T, Patoine C, Abu-Khalil A, Visvader J, Sum E, Cherry TJ, Orkin SH, Geschwind DH, Walsh CA. Early asymmetry of gene transcription in embryonic human left and right cerebral cortex. Science. 2005;308:1794–1798. doi: 10.1126/science.1110324. [DOI] [PMC free article] [PubMed] [Google Scholar]
- Sur M, Rubenstein JL. Patterning and plasticity of the cerebral cortex. Science. 2005;310:805–810. doi: 10.1126/science.1112070. [DOI] [PubMed] [Google Scholar]
- Zapala MA, Hovatta I, Ellison JA, Wodicka L, Del Rio JA, Tennant R, Tynan W, Broide RS, Helton R, Stoveken BS, et al. Adult mouse brain gene expression patterns bear an embryologic imprint. Proc Natl Acad Sci U S A. 2005;102:10357–10362. doi: 10.1073/pnas.0503357102. [DOI] [PMC free article] [PubMed] [Google Scholar]
Associated Data
This section collects any data citations, data availability statements, or supplementary materials included in this article.