

Abstract
Synonymous codons are used with different frequencies both among species and among genes within the same genome and are controlled by neutral processes (such as mutation and drift) as well as by selection. Up to now, a systematic examination of the codon usage for the chicken genome has not been performed. Here, we carried out a whole genome analysis of the chicken genome by the use of the relative synonymous codon usage (RSCU) method and identified 11 putative optimal codons, all of them ending with uracil (U), which is significantly departing from the pattern observed in other eukaryotes. Optimal codons in the chicken genome are most likely the ones corresponding to highly expressed transfer RNA (tRNAs) or tRNA gene copy numbers in the cell. Codon bias, measured as the frequency of optimal codons (Fop), is negatively correlated with the G + C content, recombination rate, but positively correlated with gene expression, protein length, gene length and intron length. The positive correlation between codon bias and protein, gene and intron length is quite different from other multi-cellular organism, as this trend has been only found in unicellular organisms. Our data displayed that regional G + C content explains a large proportion of the variance of codon bias in chicken. Stepwise selection model analyses indicate that G + C content of coding sequence is the most important factor for codon bias. It appears that variation in the G + C content of CDSs accounts for over 60% of the variation of codon bias. This study suggests that both mutation bias and selection contribute to codon bias. However, mutation bias is the driving force of the codon usage in the Gallus gallus genome. Our data also provide evidence that the negative correlation between codon bias and recombination rates in G. gallus is determined mostly by recombination-dependent mutational patterns.
Keywords: Gallus gallus, codon usage, mutation, selection
1. Introduction
Synonymous codons are used with different frequencies both among species and among genes within the same genome. Highly expressed genes (such as those encoding translation elongation factors and ribosomal proteins) tend to use optimal (preferred) codons and exhibit very high levels of codon bias.1–5 The optimal codons also tend to correspond to highly expressed tRNAs and tRNA gene copy numbers.4–13 These patterns have been interpreted as natural selection for more efficient and accurate translation.6,14–18 In contrast, some studies have demonstrated that the first factor shaping codon usage is nucleotide composition (G + C content) of genes and intergenic regions.12,19–22 As G + C content is more likely determined by genome-wide processes rather than by selective forces acting specifically on coding sequence, these findings have been inferred to reflect the genome-wide patterns of codon usage by mutational biases. Based on the fact that both mutational pressures and selective forces are involved in the phenomenon of codon bias in a variety of organisms, an integrated model, known as the mutation–selection–drift balance model, has been proposed.15,23–25 This model proposes that selection favours optimal codons over minor codons, while mutational pressure and genetic drift allow the minor codons to persist.17 Population genetics has shown that the selection of codon bias is generally weak17,23,26 (|Nes| ≈ 1), therefore, selection coefficients are expected to be more efficient in species with large effective population sizes (Ne) such as prokaryotes and unicellular eukaryotes.6,27 In species with low Ne values, genetic drift should be the main force shaping codon usage and overpowering translational selection of codon variants.
Codon bias has been determined to be positively correlated with recombination rates in Drosophila, as well as in many other species.28–35 This observation has been explained by two hypotheses. The first proposed that the reduction of codon bias in the regions with limited recombination is consistent with Hill–Robertson interference.28,30 However, another hypothesis, called the GC-biased gene conversion model, suggested that the correlation between recombination and codon usage patterns is caused by recombination-related mutational bias rather than by Hill–Robertson interference, as the heteroduplex DNA appears to be biased toward the preferential fixation of AT → GC mutations.32,36 Except for nucleotide composition, gene expression and recombination rates, other additional parameters such as protein length, gene length and intron length also have been found to play an important role in shaping codon usage in a wide variety of organisms.2,5,37–39
The chicken (Gallus gallus) is an important model organism that bridges the evolutionary gap between mammals and other vertebrates. The chicken karyotype comprises 39 pairs of chromosomes, which are divided into 8 pairs of cytologically distinct macro-chromosomes, Z and W sex chromosomes, and 30 pairs of micro-chromosomes.40 Compared to other vertebrate genomes, the chicken genome has many distinctive characteristics such as a smaller genome size (less than half of humans and mouse), higher recombination rates and higher G + C content.41,42 Base composition is found to vary greatly between different genomic regions in many eukaryotes. In vertebrates, such as mammalian and birds, one of the most striking features of their genomes is the variation of G + C content that occurs over scales of hundreds of kilobases to megabases, the so-called ‘isochore structure’.43,44 Although subsequent study indicated that the isochore model might need slight revision,45 it is clear that the genomes of vertebrates are highly heterogeneous in G + C content and have acquired GC-rich regions.42 This results in that a large proportion of variance in codon usage bias is explained by G + C content.20,21 Mank et al. investigated the chicken's properties of sex-biased genes (female biased genes 155, male biased genes 286) through a microarray data. They found that the codon usage of sex-biased genes showed some sex-biased effects, primarily for autosomal genes expressed in the gonad. Codon bias is greatest when GC3 (the G + C content at third coding positions) is skewed away from equal usage of GC or AT.46 Up to now, a systematic examination of the codon usage for the G. gallus genome has not been performed. In the present study, we carried out a whole analysis of the chicken genome and showed that codon bias is negatively correlated with G + C content and recombination rates, but positively correlated with tRNA abundance, gene expression, protein length, gene length and intron length. Our data clearly displayed that regional G + C content explains a large proportion of the variance of codon bias in G. gallus genome. This study will benefit our understanding of how natural selection and mutation impacts codon usage in the G. gallus genome.
2. Materials and methods
2.1. Sequence data
Only nuclear genes with complete information on protein-coding sequences (CDSs) with no evidence of multiple-splicing forms were included in this study. CDSs corresponding to all annotated genes in the chicken genome were downloaded from http://www.ncbi.nlm.nih.gov/sites/gquery and peptide information coded by the genes was derived from http://www.ncbi.nlm.nih.gov/protein. Some CDSs lengths are obviously not consistent with the total length of corresponding exons and these genes were defined as annotation errors and were not included for analysis. CDSs that did not begin with an ATG start codon, did not have a length of >300 bp, did not contain a multiple of three or that contained an internal stop codon were also ruled out. The final sequence collection contained 8631 CDSs with each corresponding to a unique gene in the G. gallus genome. For each gene, total gene length, protein length, first intron length and average intron length were determined.
2.2. Expression data
Expression databases were taken from the NCBI FTP website (http://www.ncbi.nlm.nih.gov/sites/entrez) and a total of 633 321 expressed sequence tag (EST) sequences were available. We used the number of EST sequences in this database that align unequivocally to a given gene, and compared the set of chicken mRNA/cDNA sequences with the ESTs using the program BLASTN. We accepted EST hits of >400 nt and with >96% identity to a mRNA/cDNA sequence as matches. If they showed >98% identity, we accepted hits of 100–400 nt and discarded hits of <100 nt.47,48 An EST matched to multiple genes was discarded. After excluding genes with multiple-splicing forms and genes with obvious annotation errors, the data on the 8631 genes from 18 tissues (including the blood, brain, bursa of fabricius, cecum, connective tissue, embryonic tissue, epiphyseal growth plate, gonad, head, heart, limb, liver, muscle, ovary, pancreas, spleen, testis and thymus) were taken into account. Tags per million were then calculated for each gene in each tissue. Total expression levels are defined as ESTs of a gene in the total number of tissues. Expression breadth is defined as the number of tissues in which the ESTs were found. The tissue specificity index (τ) is measured by both qualitative (i.e. presence/absence) and quantitative variations of expression levels among tissues, and is defined as:
where N is the number of tissue samples examined, xi is the expression level of the gene in sample i and xmax is the highest expression level of the gene across the N samples examined.49
2.3. Identification of optimal codons and synonymous codon usage
Optimal codons are defined as those that occur significantly more often in highly expressed genes relative to their frequency in lower expressed genes. We used 5% of the total genes with extremely high and low expression levels inferred from EST counts, as the high and low data set, respectively, and calculated the average RSCU (relative synonymous codon usage) of the two gene samples. RSCU was calculated by dividing the observed codon usage by that expected when all codons for the same amino acid are used equally. RSCU values close to 1.0 indicate a lack of bias. Putative optimal codons were inferred based on departures from equal codon usage by sets of loci with high and low gene expression.2,50 ΔRSCU for a given codon is the difference between the average RSCU of genes with high and low expression [significance tested using the one-way analysis of variance (ANOVA) by SAS]. If ΔRSCU is >0.1 at P< 0.05, this codon will be identified as an optimal codon. Then, we calculated Fop values using the codonW 1.4.2 program with customized optimal codon tables (J Peden, http://codonw.sourceforge.net). Fop is the ratio of optimal codons to synonymous codons, ranging from 0 (where no optimal codons are used) to 1 (where only optimal codons are used). The nucleotide composition indices including GC3 and G + C content of CDSs were also calculated using codonW 1.4.2.
2.4. tRNA gene copy number data
The tRNA gene copy numbers for each codon in the G. gallus genome was taken from http://gtrnadb.ucsc.edu/Ggall/. In these data, pseudogenes have already been removed. We used tRNA gene copy numbers as an assumed estimate of cellular tRNA abundance. The relative gene frequency (RGF) of tRNAs is the observed frequency of an isoacceptor tRNA gene in the genome divided by the frequency expected if all isoacceptor tRNA genes for that amino acid occurred with equal frequencies.11
2.5. Recombination rate estimation
The recombination rates for 1 Mbp windows were estimated. The versions of the genome assemblies (NCBI build 2.1, released November, 2006) and the latest chicken consensus linkage map (sex-averaged map) were used.51 This high-resolution consensus map included 9268 markers, consisting of 34 linkage groups. It enabled us to estimate the local recombination rates using a narrower region. Locations of individual markers were determined based on alignments of the full sequence of the markers using BLAST. The linear function was fitted to the points representing genetic and physical map positions in the 1 Mbp windows. The slope of this line was interpreted as an estimate of recombination rates.52 Windows were removed that contained >50% ‘N’ in the sequence assembly, as were windows at the beginning, end and centromere of chromosomes with no markers detected in them. Some windows with large discrepancies between the genetic map and the sequence assembly were also removed. A total of 745 windows were included, which covered ∼70% of the chicken genome.
2.6. Statistical analysis
Correlation analysis between variables was performed by SAS Proprietary Software Release 8.1. In order to assess the actual strength of association, correlation coefficients reported in this study were obtained using all genes independently and avoided the approach of subdividing genes into groups to later investigate relationships among them. The significance tests were corrected for multiple testing by the Bonferroni step-down correction.53 To determine the variables contributing to codon bias and how they may interact, we performed multiple linear regressions with the variables, excluding those not contributing significantly through the use of the t-statistical logarithm with backward stepwise regression.
3. Results
3.1. Putative optimal codons and tRNA abundance
A total of 8631genes were included in this study. As shown in Table 1, 11 codons have been identified as putatively optimal. Interestingly, all putative optimal codons in the chicken genome are ended by uracil (U). Previous studies suggested that the nucleotide composition (G + C content) plays an important role in the identities of optimal codons as selection for optimal codons for transcription and translation is not high enough to overcome compositional skews.12,20,21 Base composition is found to vary greatly between different genomic regions in many eukaryotes. In vertebrates, such as mammalian and birds, one of the most striking features of their genomes is the variation of G + C content that occurs over scales of hundreds of kilobases to megabases.43,44 In order to further test whether the G + C content had a significant effect on the identities of optimal codons in the G. gallus genome, we produced a high G + C content sample (20% of the highest G + C content of the CDSs) and a low G + C content sample (20% of the lowest G + C content of the CDSs) and inferred the optimal codons by the use of the ΔRSCU method as described above. For the low G + C content sample, 11 codons were identified as optimal and 9 overlapped with the result of the whole data analysis, lacking the alanine (coded by CGU), the threonine (coded by ACU), plus the glutamine (coded by CAG) and the threonine (coded by ACA). For high G + C content sample, 13 codons were identified as optimal and among them, 10 codons overlapped with the result of the whole data analysis, lacking only the cysteine (coded by UGU), plus the phenylalanine (coded by UUU), the serine (coded by UCA) and the proline (coded by CCG, see additional files, Supplementary Tables S1 and S2). The analyses of samples of high and low G + C content revealed that G + C content of CDS has a significant effect on the identities of the optimal codons in the chicken genome. However, it should be noted that most putative optimal codons (9–10 codons) occurred coincidently in three samples. We believe that large samples can give more accurate estimates and, therefore, the codon bias (Fop, the ratio of optimal codons to synonymous codons) estimate next was based on the putatively optimal codons identified by the whole data set of 8631 genes.
Table 1.
The putative optimal codons and tRNA abundance
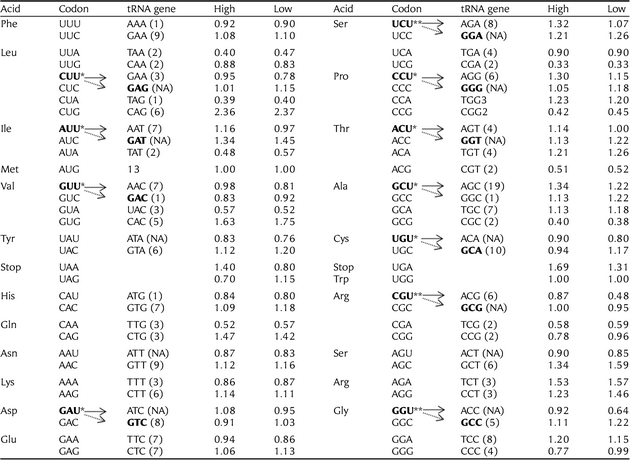 |
Putative optimal codons were inferred based on departures from equal codon usage by sets of loci with high (5% top) and low (5% down) gene expression (▵RSCU). ▵RSCU for a given codon is the difference between the average RSCU of genes with high and low expression (significance tested using the one-way ANOVA). If ▵RSCU is >0.1 at P< 0.05, this codon will be identified as optimal codon. Total optimal codons identified in this study are 11. The transfer RNA gene (tRNA) copy numbers for each codon was taken from http://gtrnadb.ucsc.edu/Ggall/. There is a good correspondence between tRNA abundance and optimal codons within codon classes. However, the above correlation reflects only partially the real co-adaptation of tRNA abundance and codon usage, as the same tRNA can decode several codons. Since we have no experimental data on base modifications in Gallus gallus tRNAs, we predicted the codons decoded by the different anticodons according to the ‘parsimony of wobbling’ criterion. The putative optimal codons with ▵RSCU is >0.1 at P< 0.05 and ▵RSCU >0.2 at P< 0.05 are denoted by ‘*’ and ‘**’, respectively.
For any given set of synonymous codons, the relevant isoacceptor tRNAs might not be equally abundant. Previous studies suggested that the most abundant tRNA for a given amino acid is predominantly recruited by the codons of highly expressed genes.54 The optimal codons are most likely the ones corresponding to the most abundant and efficient cognate aa-tRNAs present in the cell.7,13 This trend also existed in the human genome but with lower coefficient.55–57 We conducted an analysis to test whether this trend also exists in the chicken genome. As tRNA gene copy numbers are generally correlated with cellular levels of tRNAs in both prokaryotes and eukaryotes,9,58,59 we used the abundance of tRNA genes as a substitute for the levels of tRNAs in the cell. We found that there is a good correspondence between tRNA abundance and optimal codons within codon classes (see Table 1). We also computed the RGF of each isoacceptor tRNA and made a regression analysis between the RGF and RSCU in highly expressed genes and lesser expressed genes. As shown in Fig. 1, there is a significant correlation between RGF and the RSCU of complementary codons in highly expressed genes (r = 0.4599, P= 0.0013). This positive trend also existed in lesser expressed genes, but with a lower correlation coefficient (r = 0.3548, P= 0.0121).
Figure 1.

Scatter plots of RGF versus RSCU. The RGF of tRNA genes is the observed frequency of an isoacceptor tRNA gene in Gallus gallus genome divided by the frequency expected if all isoacceptor tRNA genes for that amino acid were equally frequent in the genome. The RSCU is the observed frequency of a codon divided by the frequency expected if all synonyms for that amino acid were used equally. (a) RSCU was measured in the highly expressed genes and (b) RSCU was measured in the lowly expressed genes.
3.2. Relationships between codon bias and GC3, G + C content of CDSs and G + C content of intronic sequences
Codon bias, measured as Fop, averaged 0.2560 ± 0.0042 (ranging from 0.0100 to 0.6183) across the 8631 genes in the G. gallus genome. The Fop values for genes residing on the macro-chromosomes, micro-chromosomes and Z chromosome are 0.2736 ± 0.0011, 0.2236 ± 0.0015 and 0.2992 ± 0.0032, respectively. There is a significant difference among them (P< 0.0001, using the one-way ANOVA). This means that genes residing on the Z chromosome have the highest codon bias. The reasons for this significant difference is most likely owing to the different G + C content, CpG island motifs, gene density and recombination rates of the three types of chromosomes.
Regression analysis demonstrated that Fop is highly correlated with GC3 and G + C content of CDSs, respectively (r = −0.8308, P< 0.0001; r = −0.8264, P< 0.0001, see Fig. 2a and b). It appears that variation in GC mutational bias explains over 60% of the variation of the codon usage bias. This negative correlation is expected, as all putative optimal codons inferred in this study ended with U. We also retrieved all intronic sequences for each gene and provided the combined length of all introns for a particular gene exceeding 200 bp and calculated the G + C content of the intronic sequences. We found that Fop values also negatively correlated with the G + C content of the intronic sequences significantly (r = −0.5399, P< 0.0001, see Fig. 2c).
Figure 2.

Scatter plots of GC3, G + C content of coding sequences, G + C content of intronic sequences versus the frequency of optimal codons (Fop). Total gene included is 8631. Fop was estimated by codonW 1.4.2 with customized optimal codon table (see Table 1). (a) Fop versus GC3; (b) Fop versus G + C content of CDSs and (c) Fop versus G + C content of intronic sequences.
3.3. Relationships between codon bias and gene expression
We assessed the effect of expression levels and expression breadth on codon usage bias in our samples. Our data demonstrated that codon bias is positively correlated with gene expression levels (r = 0.1735, P< 0.0001). The correlation between codon bias and expression breadth was also positive and significant (r = 0.1982, P< 0.0001, see Fig. 3a and b). These results suggest that the genes with broader expression breadth and higher expression levels show a higher degree of codon usage bias. Total gene expression is known to be highly influenced by the number of different tissues where a gene is expressed (expression breadth) when expression data are calculated from pooled EST libraries.60,61 If expression breadth is the predominant force affecting codon usage, a spurious correlation between codon bias and gene expression is more likely to be generated. In order to alleviate this problem, we divided genes into ubiquitously or narrowly expressed groups, if they were expressed in ≥15 tissues or ≤3 tissues. We regressed expression levels on codon bias for each group, and found that this significant trend also existed for the ubiquitous group (r = 0.1855, P= 0.0016) and for narrowly expressed groups (r = 0.0497, P= 0.0101). When the parameters were expanded to ≥16 or ≤2, we obtained similar results.
Figure 3.

Scatter plots of Fop versus expression level, expression breadth and the tissue specificity index τ. Expression data on 8631 genes for 18 tissues, blood, brain, bursa of fabricius, cecum, connective tissue, embryonic tissue, epiphyseal growth plate, gonad, head, heart, limb, liver, muscle, ovary, pancreas, spleen, testis and thymus, were taken into account. Expression level is defined as the total expression level of a gene, which is the sum of the total 18 tissues' EST (transformed to logarithm with base 10). Expression breadth defined as the numbers of tissues in which EST was found. The calculation of τ can be seen from materials and methods. (a) Fop versus expression level; (b) Fop versus expression breadth and (c) Fop versus the tissue specificity index τ.
The tissue specificity index τ measures both qualitative and quantitative variations of expression levels amongst tissues.49 Obviously, τ is more representative than the expression breadth and expression levels alone for the expression pattern of a gene. We calculated the tissue specificity index τ for each gene, and made regression analyses between codon bias and the tissue specificity index τ. As shown in Fig. 3c, codon bias is significantly correlated with the tissue specificity index τ (r = −0.1660, P< 0.0001).
3.4. Relationships between codon bias and protein, gene and intron length
Our data demonstrated that codon bias is significantly and positively correlated with protein length (r = 0.2358, P< 0.0001) and gene length (r = 0.2256, P< 0.0001, Fig. 4a and b). Since protein length and expression levels displayed a strong correlation with codon bias,48 we tested whether the correlation between protein length and codon bias can be explained by gene expression levels. We fitted linear models of protein length and codon bias against expression levels. The results from these models correlated at the same levels as uncorrected protein lengths and codon bias. In the narrowly expressed gene samples as described above (breadth is three or less than three tissues), we conducted a regression analysis between codon bias and protein length at similar expression levels (EST counts ranging from 57 to 60) and found that the positive trend also existed (r = 0.2823, P< 0.0001). The negative correlation between codon usage and protein length and gene length has been observed in many organisms, such as yeast, Caenorhabditis elegans, Drosophila melanogaster, Arabidopsis thaliana, Populus tremula and Silene latifolia.5,29,36,62–64 However, the positive correlation identified in this study has been found only in Saccharomyces cerevisiae and Escherichia coli, and was been explained through the model of selection on translational accuracy.37,65
Figure 4.

Scatter plots of Fop versus protein length, gene length, average intron length and first intron length (logarithmically transformed). (a) Fop versus protein length; (b) Fop versus gene length; (c) Fop versus average intron length and (d) Fop versus first intron length.
As shown in Fig. 4c and d, codon bias also shows a positive correlation with average intron length and first intron length (r = 0.2337, P< 0.0001; r = 0.1806, P< 0.0001, respectively). The opposite trend has been found in D. melanogaster, C. elegans and P. tremula.5,66,67 This positive trend between codon bias and intron length has been only found in unicellular organisms;68 however, the underlying mechanism for this is not clear. Stoletzki and Eyre-Walker69 and Stoletzki70 suggested that this trend (negative/positive) is related to whose optimal codons are biased towards codons that end with GC or AU. We found that the G + C content of introns is significantly and negatively correlated with average intron length and first intron length (r = −0.4024, P< 0.0001; r = −0.2432, P< 0.0001, respectively). Obviously, the positive trend between codon bias and intron length is related to the G + C content of intronic sequences. If mutation bias is the driving force of the codon usage in the G. gallus genome, the mutation bias hypotheses seems reasonable to explain this result.
3.5. Relationship between codon bias and recombination rate
Fig. 5 shows that there is a negative correlation between the Fop values and the local recombination rates (r = −0.4546, P< 0.0001). We also found that the relationship between codon usage bias and recombination rate is independent of the expression levels and protein length (data not shown). This significant trend seems to be expected, since the mutagenic effects of recombination result in a mutational bias toward G and C bases in regions of high recombination rates (GC-biased gene conversion).
Figure 5.

Scatter plots of Fop versus recombination rate. The recombination rates for 1 Mb windows were estimated. The versions of the genome assemblies (NCBI build 2.1, released November, 2006) and the latest chicken consensus linkage map were used. Total windows included is 745, covering ∼70% of the chicken genome. For each window, the average Fop for all genes residing in this window was calculated.
4. Discussion
4.1. The identities of optimal codons in the G. gallus genome
In the present study, we carried out a systematic examination of the codon usage in the chicken genome. By the use of the ΔRSCU method, we identified 11 codons as putatively optimal. All putative optimal codons in the chicken genome end with U. This is significantly departing from the pattern observed in other eukaryotes genomes, such as Schizosaccharomyces pombe, D. melanogaster, C. elegans and Homo sapiens. The rules governing the identities of optimal codons in different organisms remain obscure. Recently, Hershberg and Petrov21 investigated the optimal codons in 675 bacteria, 52 archea and 10 fungi. They found that across all studied organisms, the identities of optimal codons mirrors the G + C content of the genomes. GC-rich organisms tend to have GC-rich optimal codons, while AT-rich organisms tend to have AT-rich optimal codons. However, in Drosophila, C. elegance and Populus tremula, most optimal codons end with G or C (majority are C ending), while their genomes contain 35, 36 and 45% G + C-rich content, respectively.5,71,72 In humans, optimal codons seem to be driven in two opposite directions, toward AT richness and GC richness. In other words, genes in the GC-rich regions of the genome preferentially use G and C ending codons, while those in the AT-rich regions use A and T ending codons.73 The human genome comprises a mosaic of long stretches of GC-rich and AT-rich regions, the so-called isochore structure. Not only do they occur in silent sites of coding regions but also introns and flanking regions in the gene have a similar base composition.43 This isochore structure was also found in the avian genomes.41 Recently, some studies have suggested that the G + C content is becoming homogenized in humans.45,55 However, Webster et al.42 found that heterogeneity in the G + C content is being reinforced in the chicken genome. In order to test whether the G + C content influences the identities of optimal codons in G. gallus, we produced a high G + C content sample (20% of the highest G + C content of the CDSs) and a low G + C content sample (20% of the lowest G + C content of the CDSs), and inferred the optimal codons by the use of the ΔRSCU method. We found that most putative optimal codons (9–10 codons) occur coincidently in three samples. Using the abundance of tRNA genes as a substitute for the levels of tRNAs in the cell, we found that there is a good correspondence between tRNA abundance and optimal codons within codon classes. This implies that the optimal codons in the chicken genome are most likely the ones corresponding to the highly expressed tRNAs or tRNA gene copy numbers in the cell.
4.2. Mutation bias is the driving force of the codon usage in the G. gallus genome
Codon bias, as measured by Fop, is significantly correlated with GC3, G + C content of CDS and G + C content of the intronic sequences. Our data clearly displayed that regional G + C content explains a large proportion of the variance of codon bias in chicken. Our data also provide strong evidence for the mutational bias hypothesis. However, we found that the G + C content of the intronic sequences is significantly lower than that of CDSs, which are not fully consistent with this hypothesis, as it predicts that G + C content is determined by genome-wide processes rather than by selective forces acting specifically on coding regions. It also should be noted that although the G + C content of intronic sequences show a negative trend with codon usage, the correlation is significantly lower than that between codon usage and G + C content of CDSs. These findings indicate that, except for mutation bias, other factors (such as selection) may have contribution to the codon usage.
Our data also show that codon bias is significantly and positively correlated with gene expression. The positive correlations between gene expression and codon bias have been shown in many organisms.1–2,4–5 In vertebrates such as mammals, data also support a weak relationship between gene expression and codon usage.56,61 Both the match between tRNA abundance and optimal codons, and the high codon bias of the highly expressed genes, has been interpreted as natural selection for more efficient and accurate translation.14–18 Our data provide evidence that natural selection also plays an important role in shaping the codon usage in the chicken genome.
Codon bias also shows a significant trend with protein length, intron length and recombination rate. To determine what all variables (G + C content of CDS, expression level, expression breadth, protein length, intron length and recombination rate) were contributing to the differences in codon bias and how they may interact, we performed multiple linear regressions with the above variables, excluding those not contributing significantly through the use of the t-statistical analysis and with backward stepwise regression. The best combinations of variables were G + C content of CDSs and expression breadth (R2 = 0.7829, P< 0.0001). Stepwise selection model analyses indicated that the G + C content of CDSs are the most important factor responsible for codon bias (R2 = 0.6831, P< 0.0001). It appears that variation in the G + C content of CDSs explains over 60% of the variation of codon bias. Recently, a continuous-time Markov chain model to quantify the contribution of GC-biased synonymous substitution on codon usage was developed by Palidwor et al.73 Although many other important factors such as selection, GC skew, did not included in their model, it also provided an informative clue to understand the mechanism of codon usage across a broad variety of organisms. This model indicated that GC bias is the dominant factor in determining codon bias for prokaryotes, plants and human. In the present study, our data suggested that both mutation bias and selection contributed to the codon bias. This seems to be consistent with the few studies in other vertebrates such as Xenopus laevis and fishes of Cyprinidae.74–75 However, it should be noticed that mutation bias is the driving force of the codon usage in the G. gallus genome.
4.3. The negative association between codon bias and recombination in G. gallus is determined by recombination-dependent mutational patterns
In contrast to D. melanogaster and C. elegans, a negative correlation between codon bias and local recombination rates was found in the chicken genome. The positive pattern in D. melanogaster and C. elegans has been interpreted by Hill–Robertson effects (hitchhiking and background selection)28,29 or by recombination-dependent mutational patterns (gene conversion).32,36 The C. elegans has 21 optimal codons, of which 16 end in G or C bases, and D. melanogaster has 22 optimal codons, of which 21 end in G or C bases. Marais et al. demonstrated that, in C. elegans, the frequency of GC-ending optimal codons (Fop-GC) increases with recombination rate, whereas the frequency of AU-ending optimal codons (Fop-AU) decreases with recombination rate. In Drosophila, the frequency of AU-ending non-optimal codons (Fnop-AU) decreases with recombination rate, whereas the frequency of GC ending non-optimal codons (Fnop-GC) increases with recombination rate.32 In yeasts, about 60% of the optimal codons end by GC, an overall positive correlation is also observed between recombination rate and Fop. However, there is a strong negative correlation between Fop-AU and recombination rate.35 Marais and Piganeau32 suggested that the positive correlation between the frequency of optimal codons and recombination rates in C. elegans and D. melanogaster is not due to improved selection but to a mutational bias toward G and C bases in regions of high recombination rates (GC-biased gene conversion). If mutation bias variation patterns do occur, they should affect all base positions within the gene, including coding and non-coding sequences. We surely found this positive trend between recombination rate and G + C content of introns in the chickens (r = 0.2467, P< 0.0001). The mutational bias explanation seems to be the case in G. gallus. As 11 putative optimal codons identified in this study all ended in U, a negative association between codon bias and recombination rate is expected.
Another question that should be addressed is whether the correlation between the codon usage bias and recombination rate in G. gallus is a direct consequence of the recombination process. Based on the chicken consensus linkage map,51 we selected some chromosome centromere region (chromosome 1–13, chromosome 17, chromosome 23, chromosome 25, chromosome 28 and chromosome Z), and some non-centromere regions where the estimated recombination rate is null (chromosome 1: 96.4173–99.0780 Mbp and 102.5560–105.82 39 Mbp; chromosome 2: 24.8946–27.1233 Mbp; chromosome 3: 62.328–65.3834 and 91.8723–93.5081 Mbp; chromosome 4: 20.8076–22.4734 and 72.3143–75.3621 and, 76.1848–79.2 626 Mbp; chromosome 5: 31.8527–33.3023 Mbp; 33.3360–35.0246 Mbp; chromosome 6: 13.24 26–16.2627 Mbp; chromosome 7: 8.8062–11.1527 Mbp; chromosome 8: 11.7298–12.7 581 Mbp; chromosome 19: 7.8870–8.84 82 Mbp; chromosome 20: 7.1329–8.3848 Mbp), and compared their G + C content of CDSs, G + C content of introns with those of the top recombination regions (same number of intervals on the same chromosome were selected). Although the recombination rates are likely to vary in different populations, the above non-centromere regions have been identified in that no recombination occurred in a outbreed chicken population established from a crossbreeding between a Xinghua line and a White Recessive Rock line by a high-density SNP microarray (556 individuals, unpublished data). We found that the G + C content of CDSs at the high recombination regions (0.5164 ± 0.0056) is significantly higher than that of the regions incurring no recombination (0.4695 ± 0.0056; P < 0.0001, t-test). The G + C content of introns of genes residing in the high recombination regions (0.4489 ± 0.0061) is also significantly higher than that of regions having no recombination(0.3912 ± 0.0044; P< 0.0001, t-test). This implies that the correlation between codon usage bias and recombination rates in G. gallus is determined predominantly by recombination-dependent mutational patterns. However, this does not mean that selection did not act on the synonymous sites. It is more likely that their impact on codon usage has been masked by variations in mutation pressures associated with the high recombination rates in chickens.
4. Conclusion
In this whole genome analysis of the chicken, we identified 11 putative optimal codons, which all ended with U. There is a good correspondence between tRNA abundance and optimal codons within codon classes. Codon bias is negatively correlated with G + C content and recombination rates, but positively correlated with gene expression, protein length and intron length. The G + C content of coding sequences are the most important factors responsible for codon bias. It appears that variation in the G + C content of CDSs explains over 60% of the variation of codon bias. Our study suggests that both mutation bias and selection contribute to the codon bias. However, mutation bias is the driving force of the codon usage in the G. gallus genome. Our data also provide evidence that the negative correlation between codon bias and recombination rates in G. gallus is determined predominantly by recombination-dependent mutational patterns.
Supplementary data
Supplementary data are available at www.dnaresearch.oxfordjournals.org.
Funding
This work was supported by the Science and Technology Program of Jiangxi Education Department, Project No. GJJ8469, and the High Tech Program (863), China, Project No. 2006AA10A120.
Supplementary Material
Acknowledgements
We thank three reviewers for their helpful comments on the manuscript.
References
- 1.Gouy M., Gautier C. Codon usage in bacteria: correlation with gene expressivity. Nucleic Acids Res. 1982;10:7055–74. doi: 10.1093/nar/10.22.7055. [DOI] [PMC free article] [PubMed] [Google Scholar]
- 2.Duret L., Mouchiroud D. Expression pattern and, surprisingly, gene length shape codon usage in Caenorhabditis, Drosophila, and Arabidopsis. Proc. Natl. Acad. Sci. 1999;96:4482–7. doi: 10.1073/pnas.96.8.4482. [DOI] [PMC free article] [PubMed] [Google Scholar]
- 3.Ghaemmaghami S., Huh W.K., Bower K.R., et al. Global analysis of protein expression in yeast. Nature. 2003;425:737–41. doi: 10.1038/nature02046. [DOI] [PubMed] [Google Scholar]
- 4.Goetz R.M., Fuglsang A. Correlation of codon bias measures with mRNA levels: analysis of transcriptome data from Escherichia coli. Biochem. Biophys. Res. Commun. 2005;327:4–7. doi: 10.1016/j.bbrc.2004.11.134. [DOI] [PubMed] [Google Scholar]
- 5.Ingvarsson P.K. Gene expression and protein length influence codon usage and rates of sequence evolution in Populus tremula. Mol. Biol. Evol. 2007;24:836–44. doi: 10.1093/molbev/msl212. [DOI] [PubMed] [Google Scholar]
- 6.Ikemura T. Codon usage and tRNA content in unicellular and multi-cellular organisms. Mol. Biol. Evol. 1985;2:13–34. doi: 10.1093/oxfordjournals.molbev.a040335. [DOI] [PubMed] [Google Scholar]
- 7.Andersson S.G.E., Kurland C.G. Codon preferences in free-living microorganisms. Microbiol. Rev. 1990;54:198–210. doi: 10.1128/mr.54.2.198-210.1990. [DOI] [PMC free article] [PubMed] [Google Scholar]
- 8.Percudani R., Pavesi A., Ottonello S. Transfer RNA gene redundancy and translational selection in Saccharomyces cerevisiae. J. Mol. Biol. 1997;268:322–30. doi: 10.1006/jmbi.1997.0942. [DOI] [PubMed] [Google Scholar]
- 9.Kanaya S., Yamada Y., Kudo Y., Ikemura T. Studies of codon usage and tRNA genes of 18 unicellular organisms and quantification of Bacillus subtilis tRNAs: gene expression level and species-specific diversity of codon usage based on multivariate analysis. Gene. 1999;238:143–55. doi: 10.1016/s0378-1119(99)00225-5. [DOI] [PubMed] [Google Scholar]
- 10.Yamao F., Andachi Y., Muto A., Ikemura T., Osawa S. Levels of tRNAs in bacterial cells as affected by amino acid usage in proteins. Nucleic Acids Res. 1991;19:6119–22. doi: 10.1093/nar/19.22.6119. [DOI] [PMC free article] [PubMed] [Google Scholar]
- 11.Duret L. tRNA gene number and codon usage in the C. elegans genome are co-adapted for optimal translation of highly expressed genes. Trends Genet. 2000;16:287–9. doi: 10.1016/s0168-9525(00)02041-2. [DOI] [PubMed] [Google Scholar]
- 12.Kanaya S., Yamada Y., Kinouchi M., Kudo Y., Ikemura T. Codon usage and tRNA genes in eukaryotes: correlation of codon usage diversity with translation efficiency and with CG-dinucleotide usage as assessed by multivariate analysis. J. Mol. Evol. 2001;53:290–8. doi: 10.1007/s002390010219. [DOI] [PubMed] [Google Scholar]
- 13.Rocha E.P. Codon usage bias from tRNA's point of view: redundancy, specialization, and efficient decoding for translation optimization. Genome Res. 2004;14:2279–86. doi: 10.1101/gr.2896904. [DOI] [PMC free article] [PubMed] [Google Scholar]
- 14.Sorensen M.A., Kurland C.G., Pedersen S. Codon usage determines translation rate in Escherichia coli. J. Mol. Biol. 1989;207:365–77. doi: 10.1016/0022-2836(89)90260-x. [DOI] [PubMed] [Google Scholar]
- 15.Duret L. Evolution of synonymous codon usage in metazoans. Curr. Opin. Genet. Dev. 2002;12:640–9. doi: 10.1016/s0959-437x(02)00353-2. [DOI] [PubMed] [Google Scholar]
- 16.Stoletzki N., Eyre-Walker A. Synonymous codon usage in Escherichia coli: selection for translational accuracy. Mol. Biol. Evol. 2007;24:374–81. doi: 10.1093/molbev/msl166. [DOI] [PubMed] [Google Scholar]
- 17.Hershberg R., Petrov D.A. Selection on codon bias. Annu. Rev. Genet. 2008;42:287–99. doi: 10.1146/annurev.genet.42.110807.091442. [DOI] [PubMed] [Google Scholar]
- 18.Sharp P.M., Fmery L., Zeng K. Forces that influence the evolution of codon bias. Phil. Trans. R. Soc. B. 2010;1544:1203–12. doi: 10.1098/rstb.2009.0305. [DOI] [PMC free article] [PubMed] [Google Scholar]
- 19.Knight R.D., Freeland S.J., Landweber L.F. A simple model based on mutation and selection explains trends in codon and amino-acid usage and GC composition within and across genomes. Genome Biol. 2001;2 doi: 10.1186/gb-2001-2-4-research0010. RESEARCH0010. [DOI] [PMC free article] [PubMed] [Google Scholar]
- 20.Chen S.L., Lee W., Hottes A.K., Shapiro L., McAdams H.H. Codon usage between genomes is constrained by genome-wide mutational processes. Proc. Natl. Acad. Sci. 2004;101:3480–5. doi: 10.1073/pnas.0307827100. [DOI] [PMC free article] [PubMed] [Google Scholar]
- 21.Hershberg R., Petrov D.A. General rules for optimal codon choice. PLoS Genet. 2009;5:1–10. doi: 10.1371/journal.pgen.1000556. [DOI] [PMC free article] [PubMed] [Google Scholar]
- 22.Guo X., Bao J., Fan L. Evidence of selectively driven codon usage in rice: implications for G + C content evolution of Gramineae genes. FEBS Lett. 2007;581:1015–21. doi: 10.1016/j.febslet.2007.01.088. [DOI] [PubMed] [Google Scholar]
- 23.Bulmer M. The selection-mutation-drift theory of synonymous codon usage. Genetics. 1991;129:897–907. doi: 10.1093/genetics/129.3.897. [DOI] [PMC free article] [PubMed] [Google Scholar]
- 24.Akashi H. Inferring weak selection from patterns of polymorphism and divergence at ‘silent’ sites in Drosophila DNA. Genetics. 1995;139:1067–76. doi: 10.1093/genetics/139.2.1067. [DOI] [PMC free article] [PubMed] [Google Scholar]
- 25.Akashi H., Kliman R.M., Eyre-Walker A. Mutation pressure, natural selection, and the evolution of base composition in Drosophila. Genetica. 1998;102–103:49–60. [PubMed] [Google Scholar]
- 26.dos Reis M., Wernisch L. Estimating translational selection in eukaryotic genomes. Mol. Biol. Evol. 2009;26:451–61. doi: 10.1093/molbev/msn272. [DOI] [PMC free article] [PubMed] [Google Scholar]
- 27.Sharp P.M., Li W.H. An evolutionary perspective on synonymous codon usage in unicellular organisms. J. Mol. Evol. 1986;24:28–38. doi: 10.1007/BF02099948. [DOI] [PubMed] [Google Scholar]
- 28.Kliman R.M., Hey J. Reduced natural selection associated with low recombination in Drosophila melanogaster. Mol. Biol. Evol. 1993;10:1239–58. doi: 10.1093/oxfordjournals.molbev.a040074. [DOI] [PubMed] [Google Scholar]
- 29.Comeron J.M., Kreitman M., Aguade M. Natural selection on synonymous sites is correlated with gene length and recombination in Drosophila. Genetics. 1999;151:239–49. doi: 10.1093/genetics/151.1.239. [DOI] [PMC free article] [PubMed] [Google Scholar]
- 30.Comeron J.M., Kreitman M. Population, evolutionary and genomic consequences of interference selection. Genetics. 2002;161:389–410. doi: 10.1093/genetics/161.1.389. [DOI] [PMC free article] [PubMed] [Google Scholar]
- 31.Hey J., Kliman R.M. Interactions between natural selection, recombination and gene density in the genes of Drosophila. Genetics. 2002;160:595–608. doi: 10.1093/genetics/160.2.595. [DOI] [PMC free article] [PubMed] [Google Scholar]
- 32.Marais G., Piganeau G. Hill-Robertson interference is a minor determinant of variations in codon bias across Drosophila melanogaster and Caenorhabditis elegans genome. Mol. Biol. Evol. 2002;19:1399–406. doi: 10.1093/oxfordjournals.molbev.a004203. [DOI] [PubMed] [Google Scholar]
- 33.Marais G., Mouchiroud D., Duret L. Neutral effect of recombination on base composition in Drosophila. Genet. Res. 2003;81:79–87. doi: 10.1017/s0016672302006079. [DOI] [PubMed] [Google Scholar]
- 34.Haddrill P.R., Halligan D.L., Tomaras D., Charlesworth B. Reduced efficacy of selection in regions of the Drosophila genome that lack crossing over. Genome Biol. 2007;8:R18. doi: 10.1186/gb-2007-8-2-r18. [DOI] [PMC free article] [PubMed] [Google Scholar]
- 35.Harrison R., Charlesworth B. Biased gene conversion affects patterns of codon usage and amino acid usage in the Saccharomyces sens stricto group of yeasts. Mol. Biol. Evol. 2010;28:117–29. doi: 10.1093/molbev/msq191. [DOI] [PubMed] [Google Scholar]
- 36.Marais G., Mouchiroud D., Duret L. Does recombination improve selection on codon usage? Lessons from nematode and fly complete genomes. Proc. Natl. Acad. Sci. 2001;98:5688–92. doi: 10.1073/pnas.091427698. [DOI] [PMC free article] [PubMed] [Google Scholar]
- 37.Moriyama E.N., Powell J.R. Gene length and codon usage bias in Drosophila melanogaster, Saccharomyces cerevisiae and Escherichia coli. Nucleic Acids Res. 1998;26:3188–93. doi: 10.1093/nar/26.13.3188. [DOI] [PMC free article] [PubMed] [Google Scholar]
- 38.Lemos B., Bettencourt B.R., Meiklejohn C.D., Hartl D.L. Evolution of proteins and gene expression levels are coupled in Drosophila and are independently associated with mRNA abundance, protein length and number of protein-protein interactions. Mol. Biol. Evol. 2005;22:1345–54. doi: 10.1093/molbev/msi122. [DOI] [PubMed] [Google Scholar]
- 39.Stenoien H.K. Adaptive basis of codon usage in the haploid moss Physcomitrella patens. Heredity. 2005;94:87–93. doi: 10.1038/sj.hdy.6800547. [DOI] [PubMed] [Google Scholar]
- 40.Groenen M.A., Cheng H.H., Bumstead N., et al. A consensus linkage map of the chicken genome. Genome Res. 2000;10:137–47. doi: 10.1101/gr.10.1.137. [DOI] [PMC free article] [PubMed] [Google Scholar]
- 41.International Chicken Genome Sequencing Consortium (ICGSC). Sequence and comparative analysis of the chicken genome provide unique perspectives on vertebrate evolution. Nature. 2004;432:695–716. doi: 10.1038/nature03154. [DOI] [PubMed] [Google Scholar]
- 42.Webster M.T., Axelsson E., Ellegren H. Strong regional biases in nucleotide substitution in the chicken genome. Mol. Biol. Evol. 2006;23:1203–216. doi: 10.1093/molbev/msk008. [DOI] [PubMed] [Google Scholar]
- 43.Bernardi G. Isochores and the evolutionary genomics of vertebrates. Gene. 2000;241:3–17. doi: 10.1016/s0378-1119(99)00485-0. [DOI] [PubMed] [Google Scholar]
- 44.Costantini M., Bernardi G. Correlations between coding and contiguous non-coding sequences in isochore families from vertebrate genomes. Gene. 2008;410:241–8. doi: 10.1016/j.gene.2007.12.016. [DOI] [PubMed] [Google Scholar]
- 45.International Human Genome Sequencing Consortium. Initial sequencing and analysis of the human genome. Nature. 2001;409:860–921. doi: 10.1038/35057062. [DOI] [PubMed] [Google Scholar]
- 46.Mank J.E., Hultin-Rosenberg L., Axelsson E., Ellegren H. Rapid evolution of female-biased, but not male-biased, genes expressed in the avian brain. Mol. Biol. Evol. 2007;24:2698–706. doi: 10.1093/molbev/msm208. [DOI] [PubMed] [Google Scholar]
- 47.Castillo-Davis C.I., Mekhedov S.L., Hartl D.L., Koonin E.V., Kondrashov F.A. Selection for short introns in highly expressed genes. Nat. Genet. 2002;31:415–8. doi: 10.1038/ng940. [DOI] [PubMed] [Google Scholar]
- 48.Rao Y.S., Wang Z.F., Chai X.W., et al. Selection for the compactness of highly expressed genes in Gallus gallus. Biology Direct. 2010;5:35. doi: 10.1186/1745-6150-5-35. [DOI] [PMC free article] [PubMed] [Google Scholar]
- 49.Yanai I., Benjamin H., Shmoish M., et al. Genome-wide midrange transcription profiles reveal expression level relationships in human tissue specification. Bioinformatics. 2005;21:650–9. doi: 10.1093/bioinformatics/bti042. [DOI] [PubMed] [Google Scholar]
- 50.Cutter A.D., Charlesworth B. Selection intensity on preferred codons correlates with overall codon usage bias in Caenorhabditis remanei. Curr. Biol. 2006;16:2053–7. doi: 10.1016/j.cub.2006.08.067. [DOI] [PubMed] [Google Scholar]
- 51.Groenen M.A., Wahlberg P., Foglio M., et al. A high-density SNP-based linkage map of the chicken genome reveals sequence features correlated with recombination rate. Genome Res. 2009;19:510–9. doi: 10.1101/gr.086538.108. [DOI] [PMC free article] [PubMed] [Google Scholar]
- 52.Payseur B.A., Nachman M.W. Microsatellite variation and recombination rate in the human genome. Genetics. 2000;156:1285–98. doi: 10.1093/genetics/156.3.1285. [DOI] [PMC free article] [PubMed] [Google Scholar]
- 53.Holm S. A simple sequentially rejective Bonferroni test procedure. Scand. J. Stat. 1979;6:65–70. [Google Scholar]
- 54.Dong H., Nilsson L., Kurland C.G. Co-variation of tRNA abundance and codon usage in Escherichia coli at different growth rates. J. Mol. Biol. 1996;260:649–63. doi: 10.1006/jmbi.1996.0428. [DOI] [PubMed] [Google Scholar]
- 55.Comeron J.M. Selective and mutational patterns associated with gene expression in humans: influences on synonymous composition and intron presence. Genetics. 2004;167:1293–1304. doi: 10.1534/genetics.104.026351. [DOI] [PMC free article] [PubMed] [Google Scholar]
- 56.Lavner Y., Kotlar D. Codon bias as a factor in regulating expression via translation rate in the human genome. Gene. 2005;345:127–38. doi: 10.1016/j.gene.2004.11.035. [DOI] [PubMed] [Google Scholar]
- 57.Shah P., Gilchrist M.A. Effect of correlated tRNA abundances on translation errors and evolution of codon usage bias. PLoS Genet. 2010;6:e1001128. doi: 10.1371/journal.pgen.1001128. [DOI] [PMC free article] [PubMed] [Google Scholar]
- 58.Cognat V., Deragon J.M., Vinogradova E., Salinas T., Remacle C., Maréchal-Drouard L. On the evolution and expression of Chlamydomonas reinhardtii nucleus-encoded transfer RNA genes. Genetics. 2008;179:113–23. doi: 10.1534/genetics.107.085688. [DOI] [PMC free article] [PubMed] [Google Scholar]
- 59.Parmley J.L., Huynen M.A. Clustering of codons with rare cognate tRNAs in human genes suggests an extra level of expression regulation. PLoS Genet. 2009;5:e1000548. doi: 10.1371/journal.pgen.1000548. [DOI] [PMC free article] [PubMed] [Google Scholar]
- 60.Akashi H. Gene expression and molecular evolution. Curr. Opin. Genet. Dev. 2001;11:660–6. doi: 10.1016/s0959-437x(00)00250-1. [DOI] [PubMed] [Google Scholar]
- 61.Urrutia A.O., Hurst L.D. Codon usage bias covaries with expression breadth and the rate of synonymous evolution in humans, but this is not evidence for selection. Genetics. 2001;159:1191–9. doi: 10.1093/genetics/159.3.1191. [DOI] [PMC free article] [PubMed] [Google Scholar]
- 62.Mouchiroud D., Duret L. Expression pattern and, surprisingly, gene length shape codon usage in Caenorhabditis, Drosophila, and Arabidopsis. Proc. Natl. Acad. Sci. 1999;96:4482–7. doi: 10.1073/pnas.96.8.4482. [DOI] [PMC free article] [PubMed] [Google Scholar]
- 63.Charlesworth B., Loewe L. Background selection in single genes may explain patterns of codon bias. Genetics. 2007;175:1381–93. doi: 10.1534/genetics.106.065557. [DOI] [PMC free article] [PubMed] [Google Scholar]
- 64.Qiu S., Bergero R., Zeng K., Charlesworth D. Patterns of codon usage bias in Silene latifolia. Mol. Biol. Evol. 2010;28:771–80. doi: 10.1093/molbev/msq251. [DOI] [PubMed] [Google Scholar]
- 65.Walker A.E. Synonymous codon bias is related to gene length in Escherichia coli: selection for translational accuracy? Mol. Biol. Evol. 1996;13:864–72. doi: 10.1093/oxfordjournals.molbev.a025646. [DOI] [PubMed] [Google Scholar]
- 66.Marais G., Nouvellet P., Keightley P.D., Charlesworth B. Intron size and exon ewolution in Drosophila. Genetics. 2005;170:481–85. doi: 10.1534/genetics.104.037333. [DOI] [PMC free article] [PubMed] [Google Scholar]
- 67.Stenico M., Lloyd A.T., Sharp P.M. Codon usage in Caenorhabditis elegans: delineation of translational selection and mutational biases. Nucleic Acids Res. 1994;13:2437–46. doi: 10.1093/nar/22.13.2437. [DOI] [PMC free article] [PubMed] [Google Scholar]
- 68.Vinogradov A.E. Intron length and codon usage. J. Mol. Evol. 2001;52:2–5. doi: 10.1007/s002390010128. [DOI] [PubMed] [Google Scholar]
- 69.Stoletzki N., Eyre-Walker A. Synonymous codon usage in Escherichia coli: selection for translational accuracy. Mol. Biol. Evol. 2007;24:374–81. doi: 10.1093/molbev/msl166. [DOI] [PubMed] [Google Scholar]
- 70.Stoletzki N. The surprising negative correlation of gene length and optimal codon use—disentangling translational selection from GC-biased gene conversion in yeast. BMC Evol. Biol. 2011;11:93. doi: 10.1186/1471-2148-11-93. [DOI] [PMC free article] [PubMed] [Google Scholar]
- 71.Vicario S., Moriyama E.N., Powell J.R. Codon usage in twelve species of Drosophila. BMC Evol. Biol. 2007;7:226. doi: 10.1186/1471-2148-7-226. [DOI] [PMC free article] [PubMed] [Google Scholar]
- 72.Nekrutenko A., Li W.H. Assessment of compositional heterogeneity within and between eukaryotic genomes. Genome Res. 2000;10:1986–95. doi: 10.1101/gr.10.12.1986. [DOI] [PMC free article] [PubMed] [Google Scholar]
- 73.Palidwor G.A., Perkins T.J., Xia X. A general model of codon bias due to GC mutational bias. PLoS One. 2010;5:e13431. doi: 10.1371/journal.pone.0013431. [DOI] [PMC free article] [PubMed] [Google Scholar]
- 74.Musto H., Cruveiller S., D'Onofrio G., Romero H., Bernardi G. Translational selection on codon usage in Xenopus laevis. Mol. Biol. Evol. 2001;18:1703–07. doi: 10.1093/oxfordjournals.molbev.a003958. [DOI] [PubMed] [Google Scholar]
- 75.Romero H., Zavala A., Musto H., Bernardi G. The influence of translational selection on codon usage in fishes from the family Cyprinidae. Gene. 2003;317:141–7. doi: 10.1016/s0378-1119(03)00701-7. [DOI] [PubMed] [Google Scholar]
Associated Data
This section collects any data citations, data availability statements, or supplementary materials included in this article.