

ABSTRACT
Leydig cells are the testosterone-producing cells in the adult male. Adult Leydig cells (ALCs) develop from stem Leydig cells (SLCs) through at least two intermediate cells, progenitor Leydig cells (PLCs) and immature Leydig cells (ILCs). Microarray gene expression was used to identify the transcriptional changes that occur with the differentiation of SLCs to PLCs and, thus, with the entry of SLCs into the Leydig cell lineage; to comprehensively examine differentiation through the development of ALCs; and to relate the pattern of gene expression in SLCs to that in a well-established stem cell, bone marrow stem cells (BSCs). We show that the pattern of gene expression by SLCs was more similar to the expression by BSCs, an established stem cell outside the male reproductive tract, than to any of the cells in the Leydig cell developmental lineage. These results indicated that the SLCs have many of the molecular characteristics of other stem cells. Pathway analysis indicated that development of Leydig cells from SLCs to PLCs was associated with decreased expression of genes related to adhesion and increased expression of genes related to steroidogenesis. Gene expression changes between PLCs and ILCs and between ILCs and ALCs were relatively minimal, suggesting that these cells are highly similar. In contrast, gene expression changes between SLCs and ALCs were quite distinct.
Keywords: gene expression, Leydig cells, stem cells, testis
Using microarray gene expression analysis, changes during the transition of stem to adult Leydig cells in the rat can be identified, and differences between stem Leydig cells and bone marrow stem cells can be demonstrated.
INTRODUCTION
Leydig cells in the adult testis synthesize and secrete testosterone. In the Sprague Dawley rat, cells of the adult Leydig cell (ALC) lineage first become apparent by Day 11 postpartum [1, 2]. These cells, the progenitor Leydig cells (PLCs), are characterized by their spindle shape and their expression of luteinizing hormone receptor (LHR); aldo-keto reductase family 1, member C14 (AKR1C14; previously 3α-hydroxysteroid dehydrogenase); and hydroxy-delta-5-steroid dehydrogenase, 3 beta- and steroid delta-isomerase 1 (HSD3B1; previously 3β-hydroxysteroid dehydrogenase) [1, 3]. The PLCs proliferate and secrete steroids, mainly androsterone [4]. These cells gradually enlarge, become rounded, and give rise to another intermediate, the immature Leydig cell (ILC). ILCs are most commonly seen in the testis during Days 28–56 postpartum [4]. They have high lipid content, secrete high levels of 5α-reduced androgens due to high 5α-reductase activity, and have reduced proliferative capacity compared to PLCs. ILCs undergo one or two population doublings before ALC function develops at Postnatal Day 56 [3]. ALCs have reduced lipid content, and due to reduced levels of testosterone-metabolizing enzymes in comparison to ILCs, they produce high levels of testosterone as their major steroid product [5].
The PLCs have been shown to arise from undifferentiated stem Leydig cells (SLCs), the latter being seen 1 wk postpartum as spindle-shaped cells in the testicular interstitium that differ from the PLCs in that they are HSD3B1- and LHR-negative [6]. The SLCs were shown to be platelet-derived growth factor receptor alpha (PDGFRA)-positive and to contain proteins involved in Leydig cell development, including GATA-binding protein 4, c-kit receptor, and leukemia-inhibitory factor receptor. They were capable of expansion for at least 6 mo without differentiating but became HSD3B1-positive and produced testosterone when treated with media containing thyroid hormone, insulin-like growth factor I, and luteinizing hormone. Moreover, when transplanted into ALC-deficient host rat testes, SLCs colonized the interstitium and subsequently expressed HSD3B1, demonstrating their ability to differentiate in vivo as well as in vitro.
In an early study designed to elucidate the genes that may contribute to the development of ALCs, differential gene expression by PLCs, ILCs, and ALCs was analyzed using Clontech Rat Atlas cDNA microarrays, an approach that evaluated 1176 known genes [7]. The development of ALCs was characterized by decreased expression of cell-cycle regulators, growth factors, growth factor-related receptors, oncogenes and transcription factors, and by increased expression of genes related to differentiated cell function, including steroidogenic enzymes, neurotransmitter receptors, stress response factors, and protein turnover enzymes. At the time of the previous study, SLCs had not yet been isolated or characterized.
In the present study, Affymetrix Rat Genome RAE230 2.0 arrays were used to conduct DNA microarray analysis of RNA isolated from purified SLCs, PLCs, ILCs, ALCs, and bone marrow stem cells (BSCs). This analysis complements and expands on the previous microarray analysis through its focus on the initial differentiation from SLCs to PLCs, the use of an array that monitors a more complete genome, and the comparison between SLCs and BSCs. Our objectives were to identify the transcriptional changes that occur with the differentiation of SLCs to PLCs and, thus, with the entry of SLCs into the Leydig cell lineage; to comprehensively examine differentiation through the development of ALCs; and to relate the pattern of gene expression in SLCs to gene expression in a well-established stem cell and determine if SLCs share molecular characteristics of other stem cells.
MATERIALS AND METHODS
Animals
All animal protocols were approved by the Institutional Animal Care and Use Committee of the Rockefeller University. Sprague Dawley rat dams with litters of male pups, as well as prepubertal and adult males, were purchased from Charles River Laboratories. Male rats were killed by asphyxiation with CO2 on Postnatal Days 7, 21, 35, and 90.
Cell Isolation
Complete descriptions of the cell isolation procedures have been published previously [7–9]. In brief, SLCs were isolated from 7-day-old rats, PLCs from 21-day-old rats, ILCs from 35-day-old rats, and ALCs from 90-day-old rats. Decapsulated testes were dispersed with 0.25 mg/ml of collagenase D (Boehringer Mannheim Biochemicals) in Gibco Medium 199 (Invitrogen). Cells were resuspended in 55% isotonic Percoll and centrifuged. SLCs were collected from the Percoll gradient between 1.045 and 1.090 g/ml, placed on LHR antibody-coated plates to remove contaminating fetal Leydig cells, and then plated on PDGFRA-coated plates [6] to further purify the PDGFRA-positive cells. PLCs and ILCs were collected from the Percoll gradient between densities of 1.070 and 1.088 g/ml [4, 8]. For ALCs, collagenase-dispersed interstitial cells were elutriated in a Beckman JE-6B elutriation chamber at a flow rate of 16 ml/min at 2000 rpm. The cells then were further purified by Percoll density-gradient centrifugation, with collection from the gradient between densities of 1.070 and 1.090 g/ml [10]. Leydig cell purity was evaluated by histochemical staining for HSD3B1 activity using 0.4 mM etiocholanolone as the steroid substrate [11]. Purities were at least 95% in all preparations. BSCs were collected by flushing bone marrow from the femurs and tibias of 60-day-old adult rats with Minimal Essential Media (Sigma-Aldrich), followed by Percoll density-gradient centrifugation. BSCs were collected from the gradient between densities of 1.070 and 1.090 g/ml (60 min) [12]. Following their isolation, cells were solubilized in RNALater (Ambion) and frozen at −80°C until RNA purification. Independent isolations for each cell type were performed, resulting in five replicates for SLCs, three each for PLCs and BSCs, and four each for ILCs and ALCs.
RNA Preparation and Processing
Total RNA was purified by TRIzol (Invitrogen Life Technologies) extraction and further purified on an RNeasy column (Qiagen). For all samples, RNA quantity was determined by absorbance at 260 nm (NanoDrop), and quality was determined using an Agilent Bioanalyzer. All samples were treated with DNase on the column and eluted with water. Labeled cRNA (10 μg) was hybridized to RAE230 2.0 arrays (Affymetrix) representing greater than 31 000 transcripts. Raw expression data can be found in the Gene Expression Omnibus database as accession number GSE26703 (http://www.ncbi.nlm.nih.gov/projects/geo/query/acc.cgi?acc=GSE26703). For each array, all probe sets were normalized to a mean signal intensity value of 100. The default Affymetrix GeneChip operating software (GCOS) statistical values were used for all analyses [13]. Signal values and absolute detection calls were imported into Expressionist 5.0 (GeneData). A transcript was considered to be detectable if the normalized expression of the samples from any lineage was greater than 20 signal units and the percentage of samples with a Present call as determined by GCOS default settings was 80% or greater. Normalized signal values were transformed to the log base 10, and an ANOVA analysis was performed. Data from Expressionist 5.0 was imported into Decision Site 9.0 (Spotfire) for generation of Figures 1 and 2. A transcript was considered to be regulated if the difference between two segments met the following criteria: 1) the transcript was detected in at least one of the cell types, 2) the fold-change between at least two cell types was 1.7 or greater, and 3) the P-value based on an ANOVA test was 0.01 or less with correction for false-discovery rate. Genes that met these criteria were visualized using hierarchical clustering.
FIG. 1.

Correlative relationships through Leydig development. Scatterplots and correlation analysis of expression profiling data as determined by microarray analysis for SLCs to BSCs (A), SLCs to PLCs (B), PLCs to ILCs (C), ILCs to ALCs (D), and ALCs to SLCs (E) are shown. r2 = 1 indicates perfect correlation. A dendrogram (F) is also shown to visualize the hierarchy of relationships for all cells.
FIG. 2.
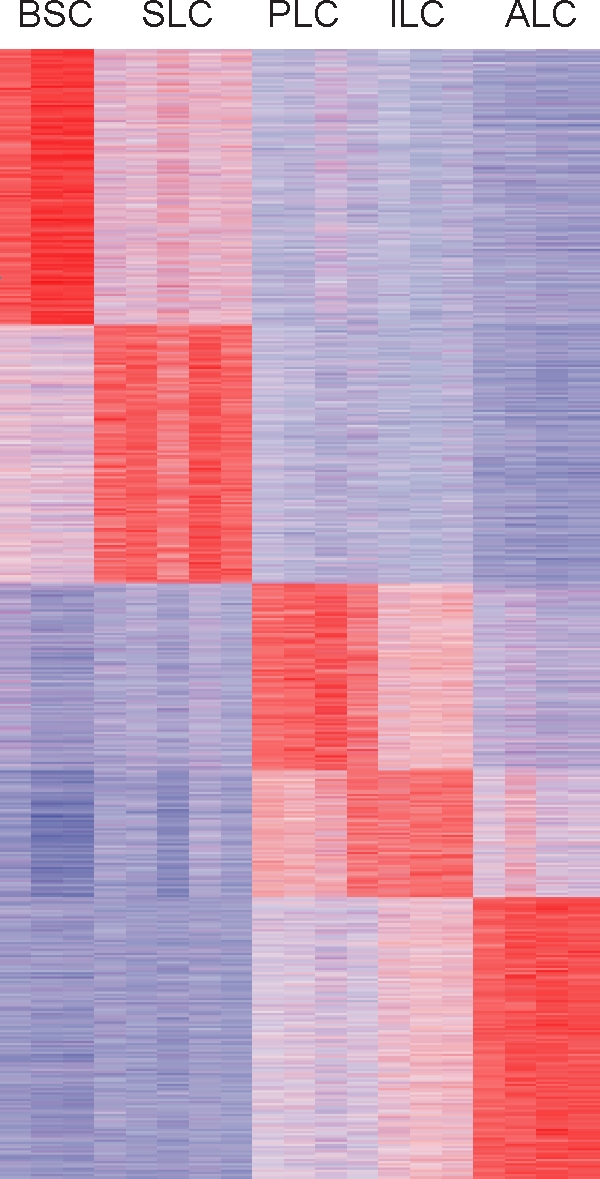
The 11 470 transcripts regulated (ANOVA, P < 0.01; fold-change, >1.7) through Leydig cell differentiation are ordered based on the cell type with the highest expression. Expression data were z-score normalized and color coded (red indicates relatively high expression, and blue indicates relatively low expression).
RESULTS
Overall Pattern of Developmental Changes from SLCs to ALCs
Microarray analysis was conducted using purified SLCs, PLCs, ILCs, ALCs, and BSCs. Highly correlated gene expression patterns were seen between BSCs and SLCs (r2 = 0.87) (Fig. 1A), indicating that the transcriptome of the SLCs is quite similar to that of BSCs. Highly correlated expression patterns also were seen between PLCs and ILCs (r2 = 0.96) (Fig. 1C) and between ILCs and ALCs (r2 = 0.87) (Fig. 1D). In contrast, greater differences were seen in gene expression between SLCs and PLCs (r2 = 0.67) (Fig. 1B) and between SLCs and ALCs (r2 = 0.51) (Fig. 1E). Two-way hierarchical clustering using a Euclidean distance metric indicated a closer relationship of the SLCs to the BSCs than to any of the cells in the Leydig cell lineage (Fig. 1F). The more differentiated PLCs, ILCs, and ALCs, on the other hand, shared a distinct branch with a subbranching pattern that reiterated the intimate relationship between PLCs and ILCs.
More than 11 470 transcripts were found to be differentially regulated (ANOVA, P < 0.01; fold-change, >1.7) between at least two of the five cell types under study (SLCs, PLCs, ILCs, ALCs, and BSCs), representing approximately 37% of the transcripts that were monitored on the array. A heat map of the regulated transcripts, ordered by maximal expression and cell type, identified transcripts with selective expression in a specific cell type and highlighted the similarities and differences among the five cell types (Fig. 2). Gene expression patterns in SLCs and ALCs differed considerably, but those in PLCs and ILCs appeared to be quite similar. Moreover, as also suggested by the correlation analysis (Fig. 1, A–E), the gene expression patterns in SLCs and BSCs were far more similar to each other than those between SLCs and any of the cell types in the Leydig cell lineage (PLCs, ILCs, and ALCs).
Comparison of SLCs to BSCs
Most genes expressed in SLCs also were expressed in BSCs. However, we found that the expression of 2418 transcripts differed quantitatively between SLCs and BSCs, including 1258 with higher expression in BSCs and 1160 with higher expression in SLCs. The expression of a number of these genes differed by greater than 50-fold (Supplemental Table S1, all Supplemental Data are available online at www.biolreprod.org). Gene-by-gene and pathway analyses identified a number of pathways that were differentially expressed between SLCs and BSCs, including the higher expression in SLCs of genes involved in extracellular matrix (ECM; Col6a3 and Fbn2) and adhesion (Cdh2). BSCs showed higher expression of marker genes for leukocytes (Cd53 and Lsp1), monocytes (Cd68), myeloid cells (Trem2), and others involved in immune response (Cfh). In addition, SLCs had higher expression of the Notch signaling genes Furin, Fhl1, and Mcam, whereas the BSCs had higher expression of the Notch signaling genes Notch1 and Mfap5 (Supplemental Table S2).
Gene Expression Profiling from SLCs Through ALC Differentiation
Our analysis identified 5701 transcripts that were regulated through the three transitions involved in producing ALCs: SLCs to PLCs, PLCs to ILCs, and ILCs to ALCs (Fig. 3). Among these, 4456 transcripts were regulated in the SLC-to-PLC transition, with 3594 specific to this transition (i.e., not regulated in the other transitions). The PLC-to-ILC transition had 160 regulated transcripts, with 57 specific to that transition, and 2002 genes were regulated in the ILC-to-ALC transition, with 1161 specific to that transition. The most regulated genes for each transition are shown in Supplemental Table S3. Only 28 transcripts were regulated in each of the three transitions from SLCs to ALCs.
FIG. 3.

Genes regulated through the Leydig cell pathway. Venn diagram shows the number of genes regulated in each of the three transitions of Leydig cell development: SLCs to PLCs, PLCs to ILCs, and ILCs to ALCs. The numbers of regulated genes that are unique to each transition, and overlapping with others, are depicted.
Of the 14 345 transcripts detected in SLCs and the 14 418 transcripts detected in PLCs, 4456 were significantly different, with 2350 increased and 2106 decreased in expression in the PLCs. The transition from SLCs to PLCs was characterized by decreased expression of genes involved in adhesion, ECM, vascular endothelial growth factor (VEGF) signaling, cell-cycle progression, and lipid metabolism (Supplemental Tables S4 and S5). This transition also was characterized by increased expression of genes involved in steroid biosynthesis, including Cyp17a1, Cyp11a1, Hsd3b1, Lhcgr, Srd5a1, and Hsd17b4 (Fig. 4; also see Supplemental Table S5). Genes involved in lipid transport, arachidonic acid metabolism, mitochondrial function, fatty acid metabolism, and lipase activity, among others, also were increased (Supplemental Tables S4 and S5). A subset of these genes was selectively expressed in SLCs (Supplemental Table S4); therefore, we reasoned that at least some might be among those responsible for maintaining “stemness.” We reasoned further that genes expressed at higher levels in PLCs compared to SLCs might be involved in the commitment of stem cells to the Leydig cell differentiation pathway. Of the 2350 genes that were up-regulated in the SLC-to-PLC transition, more than 70% remained up-regulated in ILCs and ALCs (Supplemental Table S5).
FIG. 4.

Fold-increases in genes involved in testosterone synthesis in the transition from SLCs to PLCs.
DISCUSSION
The postnatal development of Leydig cells in the rat involves four distinct stages: SLCs, PLCs, ILCs, and ALCs. SLCs do not express steroidogenic enzymes or produce steroids [6]. PLCs express LHR and HSD3B1, though steroidogenic activity in these cells is low [4]. ILCs produce increased steroid levels, but due to the presence of 5α-reductase, these cells secrete higher levels of 5α-reduced androgen than testosterone [4]. The primary steroid product of ALCs is testosterone. In addition to steroidogenic enzyme activity differences, mitotic activity also differs in the four cell types, with SLCs typically showing relatively low activity, PLCs high mitotic activity, ILCs much lower activity, and ALCs virtually none [5, 6] (for review, see [14]).
The factors controlling the proliferation and differentiation of Leydig cells remain largely unknown. A previous study [7] addressed changes in gene expression during Leydig cell development from PLCs to ALCs through the use of cDNA microarrays with a limited number of genes. The current study expands on this earlier study through the use of a much more comprehensive array and a focus on the recently discovered SLCs. Many, though not all, of the previously identified changes in gene expression through PLCs to ALCs were mirrored in our study. Some genes, including Cdc20, Ptma, Igf2r, and Hmgb2, decreased in expression from SLCs or PLCs to ALCs in both studies, whereas others, including Chrna4, Gsta4, Hsd3b1, and Cyp17a1, increased in expression from SLCs to ALCs in the current study and from PLCs to ALCs in the previous array study. It should be noted that the previous study used an assay system (Clontech) comprised of only 6% of the gene coverage of the Affymetrix arrays used in the current study and that more rigorous criteria, including a P-value of 0.01 with correction for false-discovery rate, were used in the present study to identify regulated genes.
BSCs Versus SLCs
One of our objectives was to determine the extent to which the SLCs have molecular characteristics that also typify other stem cells. The SLCs were found to have a molecular profile very similar to that of the well-established BSCs [15, 16], with gene expression patterns very well correlated (r2 = 0.87). In fact, the patterns of gene expression were more similar between SLCs and BSCs than between SLCs and any of the other cell types in the Leydig cell lineage (PLCs, ILCs, or ALCs). However, though the genes expressed by SLCs and BSCs were similar, quantitative differences were found in the expression of approximately 2400 transcripts. Among these, SLCs were found to have higher expression levels of ECM and adhesion molecules, which may imply a necessity for high levels of adherence by SLCs to elements in their niche. In addition, Notch signaling was increased in the SLCs compared to the BSCs. A main regulator in Notch signaling, Hes1, was found to be expressed by both SLCs and BSCs, though at higher levels in SLCs (6.3-fold, P < 0.039). HES1 is a transcriptional repressor that, when overexpressed in various stem cells, decreases stem cell differentiation (for review, see [17, 18]). Activation of the Notch receptor causes receptor cleavage and allows the intracellular domain to initiate transcription of Hes1 [19, 20]. Transcription of Hes1 in other tissues has been shown to negatively regulate differentiation [21]. The high levels of Hes1 seen in SLCs suggest an inhibitory mechanism for maintenance in the SLC population. It also indicates that Notch signaling may be among the regulatory mechanisms involved in maintaining the undifferentiated state of SLCs. Notch signaling also has been implicated in the development of precursors in the fetal testis [22]. We do not mean to imply that fetal Leydig cells and ALCs are derived from the same precursor cell, but mechanisms for the maintenance and differentiation of these cells may be shared.
The higher expression in SLCs compared to BSCs of genes related to steroidogenesis, including Star and nuclear receptor subfamily 5 group A member 1 (Nr5a1, also known as SF-1), suggests that SLCs already express some Leydig cell-related genes and implies that SLCs may be more likely than BSCs to undergo steroidogenic differentiation. It is important to note that Lhcgr, Hsd3b1, and Cyp11a1 (also known as P450scc), but not Star or Nr5a1, are the genes that are classically used to define cells in the Leydig cell lineage (for review, see [3, 14]) and are not expressed in the SLCs. This indicates that the SLCs are undifferentiated cells that have not yet entered the Leydig cell lineage. Nr5a1 is a transcription factor that has been shown to be necessary for adrenal and gonadal development [23]. STAR is involved in cholesterol transport to and into the mitochondria in steroidogenic cells (for review, see [24]), and Star homologues are found in cells throughout the body, including brain, intestines, breast, and skin (for review, see [25]). An interesting finding was that whereas Star levels were higher in SLCs, StAR-related lipid transfer domain 3 (Stard3) levels were expressed approximately 2.0-fold higher in BSCs. STARD3 has been shown to bind cholesterol and to be closely related to STAR, but it is proposed to be involved in cholesterol transport from mitochondria to endosomes (for review, see [25]). When overexpressed, STARD3 has also been shown to be capable of inducing steroidogenesis. This could indicate that cholesterol transport within stem cell populations may be important for other processes.
Leydig Cell Differentiation
The differentiation of the SLCs to PLCs signals the onset of ALC differentiation. In contrast to SLCs, the PLCs express HSD3B1 [6]. Due to high levels of 5α-reductase and AKR1C14 activity as well as low levels of HSD17B1, androsterone is the major steroid product of the PLCs [3]. The mechanism by which SLCs are stimulated to differentiate to PLCs is currently unclear. Our study begins to elucidate the changes that occur and to identify candidate regulatory genes associated with the transition. Increased expression was seen in PLCs of genes involved in mitochondrial function and in steroid biosynthesis. Many of these changes have been well established in Leydig cell development. For example, we observed a significant, greater than 300-fold increase in Hsd3b1 mRNA expression from SLCs to PLCs, which correlates well with previous immunohistochemistry and enzymatic activity studies [6]. In addition, the well-established Leydig cell markers Lhcgr, Cyp17a1, and Hsd17b4 (for review, see [3, 14]) also were up-regulated in the PLCs compared to the SLCs. The consistency of these results with those obtained by other methods supports the validity of the array analysis approach.
The transition from SLCs to PLCs was found to be associated with the altered expression of genes involved in VEGF signaling. SLCs expressed higher levels of Vegfa, Vegfb, Vegfc, and Fms-like tyrosine kinase 1 (Flt1), but PLCs had increased expression of kinase domain region receptor (Kdr) and neuropilin1 (Nrp1). VEGF signaling is an important signaling pathway for the development of the testis; VEGF and one of the receptors, KDR, are expressed by Sertoli cells before cord formation [26] (for review, see [27]). FLT1, another receptor for VEGF signaling, is a decoy receptor that acts as a negative regulator and attenuates the binding of VEGFA to KDR [28, 29]. NRP, a coreceptor for VEGFA, helps to stabilize binding to KDR. The VEGF signaling expression pattern is similar to the expression pattern during testis formation, in which KDR and NRP are expressed and FLT1 is not (for review, see [27]). These results imply that VEGF signaling may be important for the initiation of differentiation into the Leydig cell line or for the maintenance of the SLCs.
Genes involved in cellular adhesion decreased in PLCs compared to SLCs. For example, integrin alpha 5 (Itga5), the alpha subunit of the fibronectin receptor, and the ligand fibronectin had significantly lower expression in PLCs than in SLCs (12.9- and 4.4-fold, respectively). ITGA5 colocalizes with integrin beta 1 (ITGB1) to form a functional receptor [30], whereas fibronectin is a large component of the ECM and surrounds the peritubular myoid cells [31]. The large decrease seen in PLCs suggests that there may be a loss of functional dimerized receptor and a loss of adhesion to fibronectin and to the ECM of the tubule. It may be that a loss of adhesion signals the cells to initiate differentiation. Alternatively, loss of adhesion could be a consequence of differentiation, allowing the cells to expand into the interstitial space. Regardless of how adhesion is changed, the coordinated decrease in transcripts for cell adhesion, ECM, and actin cytoskeleton may be indicative of a transition away from physical attachment to the cells and/or structures of the niche. One widely held view on stem cell differentiation has been that asymmetric division leads to one daughter cell no longer being physically attached to the niche, thus initiating differentiation [32]. Our data do not prove this relationship, but they do imply this type of mechanism.
More than 2000 genes were found to be selectively expressed in SLCs, and some may prove to be markers to specifically identify the SLCs in future studies. Analysis of the differentiation of SLCs to PLCs identified genes with relatively low expression in SLCs and increased expression in PLCs through ALCs. Among these were genes specific to steroidogenesis, including those involved in lipid metabolism, whereas others, including those in the immune response and inflammatory response pathways, had broader involvement in cell differentiation. Still others likely are responsible for initiating the differentiation of SLCs into steroidogenic cells.
We were surprised by the low number of genes regulated in the transition from PLCs to ILCs. Of the 57 genes regulated specifically in this transition, several were down-regulated and associated with immune response. Two of these genes, complement component 4B (C4b) and complement component 2 (C2), encode proteins involved in the formation of a complex that activates the complement pathway (for review, see [33]). Complement is important in the immune response and is involved in antigen presentation, humoral immune response, and inflammatory response. The identification of C2 and C4b is the first identification of complement components in the Leydig cells. The decrease in transcription for these genes in the PLC-to-ILC transition may indicate a potential role for immune response in PLCs.
The final stage in the differentiation of ALCs is the transition from ILCs. This transition was characterized by 1161 genes regulated exclusively in the differentiation of ILCs to ALCs. Genes involved in cellular assembly and organization and in cell cycle were down-regulated in this transition. These genes are typically found in dividing cells; because ALCs do not divide, the decrease in these functions is consistent with the quiescence of these cells. The genes that were up-regulated in the final transition to ALCs were involved in lipid metabolism, small molecule biochemistry, and vitamin and mineral metabolism. These functions likely support steroid production. Because ALCs produce more testosterone than ILCs, this increase is not surprising. Steroid production increases reactive oxygen species in the ALCs [34, 35]. Thus, as might be expected, increases in genes to deal with the additional oxidative stress also were seen.
In summary, the data reported herein reveal differential gene expression in cells as they progress from the earliest phases of the Leydig cell developmental lineage to the ALCs. Importantly, the data indicate clearly that the SLCs are very similar to the BSCs. Distinctive changes occur as the SLCs differentiate to the first cells of the Leydig cell lineage, the PLCs. Thereafter, gradual changes ultimately result in testosterone-producing ALCs. Our data indicate potential pathways to investigate, but the mechanisms that ultimately regulate these transitions remain uncertain.
Supplementary Material
ACKNOWLEDGMENTS
We wish to express our gratitude to the Johns Hopkins Malaria Research Institute for granting access to and assistance with Partek Genomics Suite and Ingenuity Pathway Analysis software. We dedicate this work to Dr. Matthew P. Hardy, who was integrally involved in its initial design.
Footnotes
Supported by National Institutes of Health grants R37 AG21092 (B.R.Z.), R01 HD050570 (R.-S.G.), and RO1 AG030598 (R.-S.G.) and National Institute of Environmental Health Sciences training grant ES07141 (E.L.S.). Data have been deposited in the National Center for Biotechnology Information Gene Expression Omnibus under the accession number GSE26703.
REFERENCES
- Haider SG, Passia D, Overmeyer G. Studies on the fetal and postnatal development of rat Leydig cells employing 3β-hydroxysteroid dehydrogenase activity. Acta Histochem Suppl 1986; 32: 197 202 [PubMed] [Google Scholar]
- Shan LX, Hardy MP. Developmental changes in levels of luteinizing hormone receptor and androgen receptor in rat Leydig cells. Endocrinology 1992; 131: 1107 1114 [DOI] [PubMed] [Google Scholar]
- Benton L, Shan X, Hardy MP. Differentiation of adult Leydig cells. J Steroid Biochem Mol Biol 1995; 53: 61 68 [DOI] [PubMed] [Google Scholar]
- Ge RS, Hardy MP. Variation in the end products of androgen biosynthesis and metabolism during postnatal differentiation of rat Leydig cells. Endocrinology 1998; 139: 3787 3795 [DOI] [PubMed] [Google Scholar]
- Hardy MP, Zirkin BR, Ewing LL. Kinetic studies on the development of the adult population of Leydig cells in testes of the pubertal rat. Endocrinology 1989; 124: 762 770 [DOI] [PubMed] [Google Scholar]
- Ge RS, Dong Q, Sottas CM, Papadopoulos V, Zirkin BR, Hardy MP. In search of rat stem Leydig cells: identification, isolation, and lineage-specific development. Proc Natl Acad Sci U S A 2006; 103: 2719 2724 [DOI] [PMC free article] [PubMed] [Google Scholar]
- Ge RS, Dong Q, Sottas CM, Chen H, Zirkin BR, Hardy MP. Gene expression in rat Leydig cells during development from the progenitor to adult stage: a cluster analysis. Biol Reprod 2005; 72: 1405 1415 [DOI] [PubMed] [Google Scholar]
- Hardy MP, Kelce WR, Klinefelter GR, Ewing LL. Differentiation of Leydig cell precursors in vitro: a role for androgen. Endocrinology 1990; 127: 488 490 [DOI] [PubMed] [Google Scholar]
- Klinefelter GR, Kelce WR, Hardy MP. Isolation and culture of Leydig cells from adult rats. Methods Toxicol 1993; 3A: 166 181 [Google Scholar]
- Klinefelter GR, Hall PF, Ewing LL. Effect of luteinizing hormone deprivation in situ on steroidogenesis of rat Leydig cells purified by a multistep procedure. Biol Reprod 1987; 36: 769 783 [DOI] [PubMed] [Google Scholar]
- Payne AH, Downing JR, Wong KL. Luteinizing hormone receptors and testosterone synthesis in two distinct populations of Leydig cells. Endocrinology 1980; 106: 1424 1429 [DOI] [PubMed] [Google Scholar]
- Rosca AM, Burlacu A. Isolation of a mouse bone marrow population enriched in stem and progenitor cells by centrifugation on a Percoll gradient. Biotechnol Appl Biochem 2010; 55: 199 208 [DOI] [PubMed] [Google Scholar]
- Barenco M, Stark J, Brewer D, Tomescu D, Callard R, Hubank M. Correction of scaling mismatches in oligonucleotide mircroarray data. BMC Bioinformatics 2006; 7: 251 [DOI] [PMC free article] [PubMed] [Google Scholar]
- Chen H, Ge RS, Zirkin BR. Leydig cells: from stem cells to aging. Mol Cell Endocrinol 2009; 306: 9 16 [DOI] [PMC free article] [PubMed] [Google Scholar]
- Chagastelles PC, Nardi NB, Camassola M. Biology and applications of mesenchymal stem cells. Sci Prog 2010; 93: 113 127 [DOI] [PMC free article] [PubMed] [Google Scholar]
- Laird DJ, von Andrian UH, Wagers AJ. Stem cell trafficking in tissue development, growth and disease. Cell 2008; 132: 612 630 [DOI] [PubMed] [Google Scholar]
- Othsuka T, Sakamoto M, Guillemot F, Kageyama R. Roles of the basic helix-loop-helix genes Hes1 and Hes5 in expansion of neural stem cells of the developing brain. J Biol Chem 2001; 276: 30467 30474 [DOI] [PubMed] [Google Scholar]
- Kageyama R, Ohtuska T, Kobayashi T. Roles of Hes genes in neural development. Dev Growth Differ 2008; 50 (Suppl 1): S97 S103 [DOI] [PubMed] [Google Scholar]
- Jarriault S, Brou C, Logeat F, Schroeter EH, Kopan R, Israel A. Signaling downstream of activated mammalian Notch. Nature 1995; 377: 355 358 [DOI] [PubMed] [Google Scholar]
- Schroeter EH, Kisslinger JA, Kopan R. Notch-1 signaling requires ligand-induced proteolytic release of intracellular domain. Nature 1998; 393: 382 386 [DOI] [PubMed] [Google Scholar]
- Zine A, Aubert A, Qiu J, Therianos S, Guillemot F, Kageyama R, de Ribaupierre F. Hes1 and Hes5 activities are required for the normal development of the hair cells in the mammalian inner ear. J Neurosci 2001; 21: 4712 4720 [DOI] [PMC free article] [PubMed] [Google Scholar]
- Tang H, Brennan J, Karl J, Hamada Y, Raetzman L, Capel B. Notch signaling maintains Leydig progenitor cells in the mouse testis. Development 2008; 135: 3745 3753 [DOI] [PMC free article] [PubMed] [Google Scholar]
- Luo X, Ikeda Y, Parker KL. A cell-specific nuclear receptor is essential for adrenal and gonadal development and sexual differentiation. Cell 1994; 77: 481 490 [DOI] [PubMed] [Google Scholar]
- Rone MB, Fan J, Papadopoulos V. Cholesterol transport in steroid biosynthesis: role of protein-protein interactions and implications in disease states. Biochim Biophys Acta 2009; 1791: 646 658 [DOI] [PMC free article] [PubMed] [Google Scholar]
- Alpy F, Tomasetto C. Give lipids a START: the StAR-related lipid transfer (START) domain in mammals. J Cell Sci 2005; 118: 2791 2801 [DOI] [PubMed] [Google Scholar]
- Bott RC, McFee RM, Clopton DT, Toombs C, Cupp AS. Vasculature endothelial growth factor and kinase domain region receptor are involved in both seminiferous cord formation and vascular development during testis morphogenesis in the rat. Biol Reprod 2006; 75: 56 67 [DOI] [PMC free article] [PubMed] [Google Scholar]
- Bott RC, Clopton DT, Cupp AS. A proposed role for VEGF isoforms in sex-specific vasculature development in the gonad. Reprod Domest Anim 2008; 43 (Suppl 2): 310 316 [DOI] [PMC free article] [PubMed] [Google Scholar]
- Ferrara N. VEGF: an update on biological and therapeutic aspects. Curr Opin Biotechnol 2000; 11: 617 624 [DOI] [PubMed] [Google Scholar]
- Olsson AK, Dimberg A, Freuger J, Claesson-Welch L. VEGF receptor signaling—in control of vascular function. Nature Rev 2006; 7: 359 371 [DOI] [PubMed] [Google Scholar]
- Beattie J, McIntosh L, van der Walle CF. Cross-talk between the insulin-like growth factor (IGF) axis and membrane integrins to regulate cell physiology. J Cell Physiol 2010; 224: 605 611 [DOI] [PubMed] [Google Scholar]
- Maekawa M, Kamimura K, Nagano T. Peritubular myoid cells in the testis: their structure and function. Arch Histol Cytol 1996; 59: 1 13 [DOI] [PubMed] [Google Scholar]
- Muller-Sieburg CE, Deryugina E. The stromal cells' guide to the stem cell universe. Stem Cells 1995; 13: 477 486 [DOI] [PubMed] [Google Scholar]
- Le Friec G, Kemper C. Complement: coming full circle. Arch Immunol Ther Exp 2009; 57: 393 407 [DOI] [PubMed] [Google Scholar]
- Hornsby PJ, Crivello JF. The role of lipid peroxidation and biological antioxidants in the function of the adrenal cortex. Mol Cell Endocrinol 1983; 30: 123 147 [DOI] [PubMed] [Google Scholar]
- Peltola V, Huhtaniemi I, Metsa-Ketela T, Ahotupa M. Induction of lipid peroxidation during steroidogenesis in the rat testis. Endocrinology 1996; 137: 105 112 [DOI] [PubMed] [Google Scholar]
Associated Data
This section collects any data citations, data availability statements, or supplementary materials included in this article.