Introduction
Heart failure (HF) diagnosis and treatment is a frequent emergency department (ED) presentation. ED evaluation and treatment has traditionally used global assessors of cardiac function such as serum B-type natriuretic peptide (BNP) measurement, chest radiographs and urine output. However, they poorly reflect treatment response.1-4
From a physiological standpoint, regional tissue oxygenation abnormalities should precede global abnormalities and therefore allow earlier identification of HF severity and response to treatment. Prior work demonstrated microvascular perfusion is severely altered in HF patients.5 The microvascular oxygen extraction ratio (OERM) utilizes noninvasive technology that quantitatively measures microvascular tissue oxygen utilization. Our study objective was to assess microvascular oxygenation in HF patients by measuring peripheral tissue OERM in acutely decompensated HF patients before and after treatment, which were compared to stable outpatient HF patients.
Methods
This prospective, observational study was approved by our IRB and randomly enrolled non-consecutive patients from November 2004 to January 2008 at an urban tertiary care hospital. Decompensated HF patients were enrolled after ED presentation. Inclusion criteria included a prior HF diagnosis, serum B-type natriuretic peptide (BNP) >100 ng/mL (ADVIA Centaur BNP, Bayer AG, Leverkusen, Germany) and a Boston Heart Failure Criteria score ≥8 (Appendix 1). These criteria were chosen because they could be applied in a uniform, previously validated manner.6,7 In the interest of collecting pre-treatment baseline data, patients who had a score ≥8 prior to reviewing the chest radiograph and BNP results were monitored. Patients were excluded if they were given an admission or discharge diagnosis other than HF, and the final discharge diagnosis was used to determine the presence of HF.
The stable HF group was enrolled from our outpatient HF clinic (approximately 600 visits annually). Patients were enrolled if they were at their clinical baseline and did not have medication changes.
Exclusion criteria included factors that could alter microvascular oxygen dynamics: temperature < 35°C or > 38°C, severe peripheral vascular disease, sepsis, active hemorrhage or acute coronary syndrome.
Once consented, patients had tissue hemoglobin saturation (StO2) measured using a differential absorption spectrometer (O2C Monitor, LEA, Inc., Gießen, Germany), which uses a white light source with filters to determine the ratio of oxy- and deoxy- hemoglobin8 within a volume of tissue containing arterial, capillary and venous vessels. Direct noninvasive measurement of the arterio-venous oxygen saturation difference (a-v SO2 difference) to determine the OERM is not possible. But a related surrogate is the arterial to tissue difference (a-t SO2 difference) given by (SaO2 - StO2), in which SaO2 is pulse oximetry-measured arterial hemoglobin oxygen content. For commonly accepted values of these volume fractions, Farterial = 0.1, Fcapillary = 0.2 and Fvenous = 0.7,9 OERM can be calculated by OERM = (SaO2 − StO2) / 0.8*SaO2.
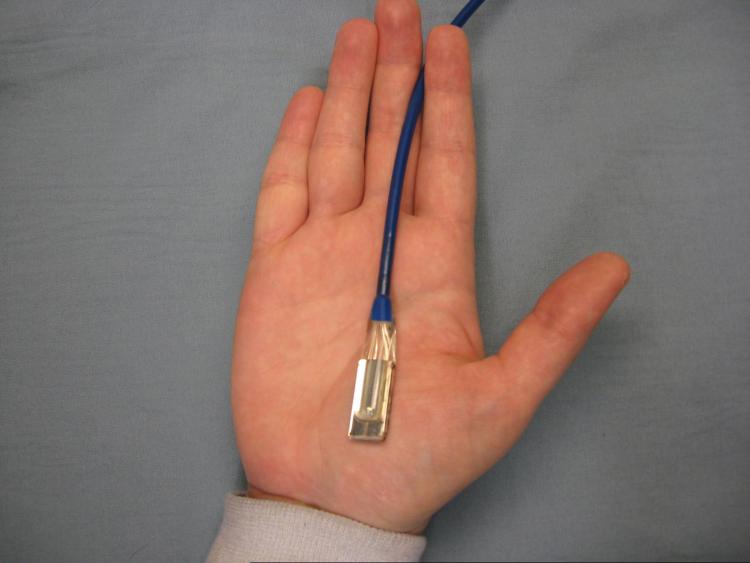
The StO2 was measured on the palmar crease with the O2 See Monitor probe taped into position (Figure 1), which takes measurements once per second. From this, 10-minute average was used for analysis. Bedside monitor blood pressure and pulse oximetry were measured twice and averaged during the same interval. Pulse oximetry was measured on the same hand as the StO2 measurement, while blood pressure was measured in the contra lateral arm to prevent interruptions in blood flow during StO2. Serum hemoglobin and BNP measurements, if completed in the clinical evaluation, were recorded. Decompensated patients had OERM and MAP measurements repeated three hours after treatment initiation.
Figure 1.
The O2C Monitor percutaneous probe in position on the hypothenar eminence.
Significant cardiac co-morbidities were recorded along with gender, age and ethnicity. The etiology of HF (preserved versus reduced ejection fraction, with an EF < 50% considered abnormal) was determined from subsequent inpatient evaluation for the decompensated group and from record review for the stable group. During ED treatment, the medication dosage and method of delivery were recorded.
To assess HF severity in a uniform, quantitative manner, two visual analogue scale (VAS) tools were administered at each monitoring session (Appendix 2). The first VAS asked patients to rate their current degree of dyspnea and level of activity, ranging from asymptomatic to severe distress using a 100 mm scale (0 = no difficulty; 100 = severe difficulty). The VAS was completed by the investigators and research personnel. To ensure uniform scoring, research personnel first observed the investigator VAS administration process, then were subsequently observed prior to independently assessing patients. The second VAS, completed by research personnel, assessed the degree of observed patient diaphoresis and dyspnea using a 100 mm scale (0 represents no obvious diaphoresis or dyspnea; 100 represents severe dyspnea and diaphoresis).
To determine if pre- and post-treatment OERM during ED treatment changed over time or differed from stable HF patients, a repeated measures analysis of variance (SAS version 9.2, SAS, Inc., Cary, NC) was used with an unstructured variance-covariance structure, reported with standard error. Simulation results suggested that for an alpha of 0.05 and a minimum power of 80%, a sample size of 45 patients per group was required. Secondary analysis determined if patient characteristics differed between the stable and decompensated groups using chi-square testing (nominal data) or a student t-test (categorical data).
Data distribution for continuous variables was analyzed with a normal quantile plot, and if found to be normally distributed were reported as means +/− 95% confidence intervals. Frequency analysis was done for patient co-morbidities, gender, race, HF etiology and medications, and reported as percentages. Median values with 25th and 75th percentiles were also reported.
Results
Ninety-six patients were enrolled. Three decompensated patients later had non-HF diagnoses and two had incomplete data, leaving 45 stable and 46 decompensated patients for analysis. The stable and decompensated groups had similar demographics, except for increased prevalence of hypertension (p < 0.0l), hypercholesterolemia (p = 0.05) and reduced ejection fraction (p = 0.05) in the decompensated group. Mean arterial pressure was also higher in the decompensated group (Table 1). With the exception of vasoactive medications, the treatment regimens did not significantly differ. Continuous data appeared to be normally distributed.
Table 1.
Patient demographics, co-morbidities and characteristics.
| Group N |
Stable 45 |
Decompensated 46 |
Significance |
|---|---|---|---|
| Age, years (95% CI) | 56.1 (51.8—60.4) | 60.7 (57.1—64.3) | 0.11 |
| Gender: Female | 20 (44.4) | 20 (43.5) | 0.93 |
| Male | 25 (55.6) | 26 (56.5) | |
| African-American | 29 (64.4) | 39 (84.5) | 0.08 |
| White | 14 (31.1) | 6 (13.4) | |
| Hispanic | 2 (0.02) | 1 (2.1) | |
| Diabetes | 13 (28.9%) | 14 (30.4%) | 0.87 |
| Hypertension | 38 (84.4%) | 46 (100%) | <0.01* |
| High Cholesterol | 21 (46.7%) | 31 (67.4%) | 0.05 |
| Coronary Artery Disease | 23 (51.1%) | 32 (69.6%) | 0.07 |
| Hemoglobin, g/dL (95% CI) | 13.0 (12.6—13.5) | 12.5 (12.0—13.0) | 0.08 |
| EF, % (95% CI) | 35.3 (30.4—40.1) | 30.7 (26.2—35.2) | 0.17 |
| HF Etiology: Preserved | 15 (33.3%) | 8 (17.4%) | 0.05 |
| Reduced | 30 (66.7%) | 38 (82.6%) | |
|
Mean Arterial Pressure, mmHg
(95% CI) |
90.3 (85.7—94.9) | Pre-Tx: 110.4 (102.6—118.2)) Post- Tx: 96.7 (90.8—101.8) |
<0.01* <0.01* |
| Diuresis | 40 (88.9) | 43 (93.4) | 0.46 |
| Nitrates | 31 (68.9) | 27 (58.7) | 0.18 |
| Sublingual/PO | 45 (100) | 3 (11.1) | |
| Percutaneous | - | 18 (66.7) | |
| Intravenous | - | 6 (22.2) | |
| Inotropes | 1 (2.2) | 9 (19.6) | <0.01* |
| Dobutamine | 1 (100) | 3 (33.3) | |
| Nesiritide | - | 6 (66.6) |
denotes p < 0.05
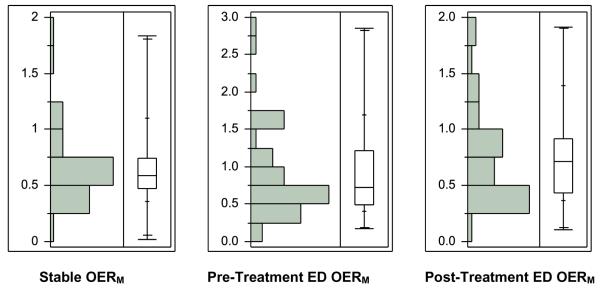
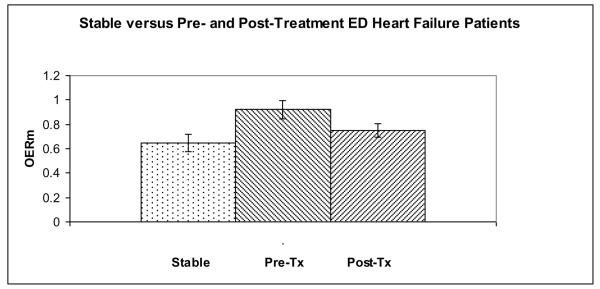
While the pre-treatment OERM (Table 2) differed from the stable patient OERM (p < 0.01), the post-treatment OERM (Figures 2 and 3) was not different from the stable patient OERM (p = 0.27). The stable patient MAP was significantly different from the pre-treatment and post-treatment ED measurements (p < 0.01 for both).
Table 2.
The results of the repeated measures analysis of variance model for OERM between the stable (Clinic), emergency department pre-treatment (ED Pre-Tx) and emergency department post-treatment (ED Post-Tx) groups.
| Group | Estimate (Standard Error) | DF | t-value | p |
|---|---|---|---|---|
| Clinic | 0.649 (0.072) | 89 | 9.0 | <0.01 |
| ED Pre-Tx | 0.920 (0.072) | 89 | 12.8 | <0.01 |
| ED Post-Tx | 0.751 (0.057) | 89 | 13.2 | <0.01 |
Figure 2.
Distribution and box-and-whisker plots of the stable, decompensated HF pre-treatment and post-treatment group microvascular oxygen extraction ratios (OERM).
Figure 3.
The microvascular oxygen extraction ratio (OERM) of the stable and decompensated HF pre-treatment (Pre-Tx) and post-treatment (Post-Tx) groups.
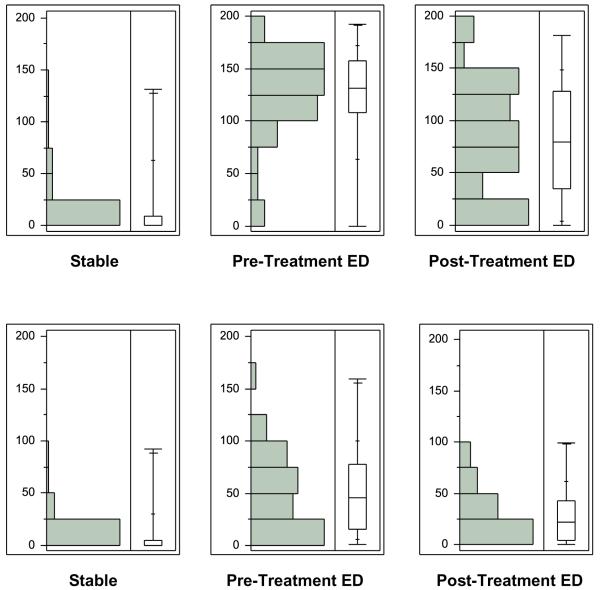
The decompensated group serum BNP was 1497 ng/dL (95% CI: 1098—1896) and had no stable group comparison. The mean time from pre- to the post-treatment monitoring in the decompensated group was 150 +/− 126 minutes, and inpatient length of stay was 5.4 +/− 5.2 days. The stable patient-scored VAS (Table 3) significantly differed from the pre-treatment (p < 0.01) and post-treatment ED patient VAS (p < 0.01), and the patient-scored VAS decreased after ED treatment (p < 0.01). Stable patients had a significantly lower observer-scored VAS than the ED patients both at pre-treatment (p < 0.01) and post-treatment (p = 0.01)(Figure 4).
Table 3.
Patient and observer visual analogue scale (VAS) scores and standard error (SE) for clinic and emergency department pre-treatment (Pre-Tx) and post-treatment (Post-Tx).
| Group | Patient VAS (SE) |
DF | t-value | p | Observer VAS (SE) |
DF | t-value | p |
|---|---|---|---|---|---|---|---|---|
| Clinic | 15.2 (5.6) | 85 | 2.7 | <0.01* | 50.1 (4.5) | 85 | 1.7 | 0.09 |
| ED Pre-Tx | 125.2 (5.8) | 85 | 21.7 | <0.01* | 28.0 (4.0) | 85 | 11.2 | <0.01* |
| ED Post-Tx | 84.0 (8.0) | 85 | 10.5 | <0.01* | 7.4 (4.3) | 85 | 7.0 | <0.02* |
Figure 4.
a: Distribution and box-and-whisker plots of the stable, decompensated HF pre-treatment and post-treatment group patient visual analogue scales (mm).
b: Distribution and box-and-whisker plots of the stable, decompensated HF pre-treatment and post-treatment group observer visual analogue scales (mm).
Discussion
Aside from serum BNP, HF assessment in the ED setting has not materially changed in 50 years. Physical exam findings, vital signs, chest radiographs,10 urine output and patient symptoms have poor accuracy in determining HF severity and response to treatment.1, 11 While diagnosing HF has been improved by measuring serum BNP,12 it is only accurate for guiding treatment when high or low, as intermediate levels have less utility,4 particularly in those with chronic HF, and the utility of BNP to guide treatment is unclear.13, 14 This heterogeneity in assessment results in the inability in an individual patient to determine whether the primary problem is volume overload with adequate perfusion, or at the other end of the spectrum, inadequate tissue delivery of oxygen.
Differential absorption spectroscopy is a reliable technique that filters white light for wavelengths between 500 and 650 nm to determine the ratio of oxy- and deoxy- hemoglobin within tissue 1-2 mm below the skin surface.8 The OERM derived from this measurement is a reflection of the balance between tissue oxygen delivery and oxygen consumption. Reductions in oxygen delivery are reflected as an increased OERM as tissues extract a greater proportion of oxygen to meet metabolic needs. In the setting of HF, the OERM represents tissue oxygen consumption in peripheral tissue that is subject to the vasoconstriction, endothelial dysfunction, diminished cardiac output and fluid overload.15 The directly measured StO2 value itself has been investigated in the outpatient HF population16 and in the acutely decompensated ED population17 with promising results. The advantage of OERM measurement is the ability to take into account arterial blood oxygen content entering the tissue, important as hypoxemia often results from severe HF.
We found that microvascular oxygen utilization abnormalities exist in acutely decompensated HF ED patients when compared to stable out-patient HF patients. Peripheral tissue oxygen extraction was highest prior to ED treatment, which then decreased after treatment, approaching values found in the stable HF population. Physiologically, the oxygen extraction ratio is a measure of how much oxygen has been extracted by peripheral tissue in HF. The wide variation we found likely reflects the severity of the disease and/or the ability of individual patients to compensate for decreased the tissue perfusion. Based on the degree of variation in the OERM measure, an individual absolute OERM value may not be as important as the relative change in the value during treatment. The elevated pre-treatment values likely represent increased extraction due to decreased tissue oxygen delivery from the HF decompensation.
The decompensated and stable groups were similar in terms of age, gender and ethnicity. Because serum hemoglobin levels were similar between the two groups, the difference between oxygen extraction are likely not from differences in erythrocyte concentration. Although not statistically significant, the stable group had a higher incidence of preserved ejection fraction HF, although measured EF was similar.
The need for an accurate guide to HF treatment, particularly in the ED setting, has become more pressing because delay in HF treatment has been associated with increased in-hospital mortality,18 and earlier intervention positively impacts patient outcomes and costs.19 The OERM is a reproducible, noninvasive, quantitative measure of microvascular oxygen utilization that might fit this role.
Limitations
Although the stable and decompensated group demographics and co-morbidities were similar, hypertension was more prevalent in the decompensated group. This could have affected results, as hypertension can affect arterial and arteriole compliance, potentially impacting microvascular tissue perfusion. MAP and pulse oximetry was measured only twice during each monitoring period. Because within a 10-minute period there was very little StO2 variation (1 to 2% standard deviation), we thought continuous blood pressure and pulse oximetry measurement was not necessary and adequately reflected by the average of two measurements over the 10-minute period.
Although the goal reassessment timeframe was within 180 minutes, this did not always occur, as a result of monitor, personnel or patient unavailability for re-monitoring. This could have introduced a time effect on OERM measurement.
Some patients with stable HF had ejection fractions used for analysis that were obtained up to 3 months before or after enrollment. It is possible that EF changed during the time between the last EF determination and enrollment.
We did not control for medication regimens during treatment, although the stable and decompensated patients had a similar frequency of diuretics and nitrates. Patients received commonly-used, ED treatment for acutely decompensated HF and were monitored over a reasonable time period for these interventions to take effect. Future studies will examine OERM as specific medications are used.
Although physical exam and symptoms are poor indicators of HF treatment response, and represent a study limitation, they remain the non-invasive gold standard for assessing treatment and response. We used the VAS to assess patient response to treatment. Although subjective it has been used previously in the acutely decompensated HF population.7, 20.
Our population had a high proportion of African Americans, who may respond differently to HF therapy.21, 22 Because the Boston heart failure criteria was validated in predominantly white HF patients6 the accuracy of this scoring system may be limited in our population.
Conclusions
This preliminary study of the use of novel technology to assess HF, indicates that OERM is increased in patients with acutely decompensated HF, and decreases after treatment to values found in the stable HF population. More study is needed to determine its roll in the assessment and management of HF in the ED.
Acknowledgments
This study was supported by a General Clinical Research Center Clinical Research Feasibility Fund (NCRR, NIH M01 RR00065).
Appendix I
Boston Inclusion Criteria
| ●Patient History: | 4 | Dyspnea at rest |
| 4 | Orthopnea | |
| 3 | Paroxysmal nocturnal dyspnea | |
| 2 | Dyspnea while walking on level area | |
| 1 | Dyspnea while climbing stairs | |
| Total: ____ | ||
| ●Physical Exam Findings: | Heart Rate | |
| 1 | If 91 to 110 beats per minute | |
| 2 | If more than 110 beats per minute | |
| Jugular Venous Distention | ||
| 2 | > 6 cm H2O | |
| 3 | > 6 cm H2O plus hepatomegaly or edema | |
| Chest Exam | ||
| 1 | Basilar crackles | |
| 2 | If crackles ascultated more than basilar | |
| 3 | Wheezing | |
| 3 | Third heart sound | |
| Total: ____ | ||
| ●Chest Radiograph Findings: | 4 | Alveolar pulmonary edema |
| 3 | Interstitial pulmonary edema | |
| 3 | Bilateral pleural effusion | |
| 3 | Cardiothoracic ratio greater than 0.50 | |
| 2 | Upper zone flow redistribution | |
| Total: ____ | ||
| Grand Total: ____ (Note: Only a maximum of 4 points from each category allowed.) | ||
APPENDIX 2
Subject Visual Analogue Scale
| Patient: Please mark on the following scale how you feel: | |
| 1. Patient-reported Dyspnea | |
| 0 mm | 100 mm |
| _________________________________________________________ | |
| “I can breath as I normally do” | “I cannot breath at all” |
| 2. Patient-reported Level of Activity | |
| 0 mm | 100 mm |
| _________________________________________________________ | |
| “I can move around as I normally do” | “I am short of breath just sitting here” |
| Observer: Rate the following observations: | |
| 3. Observer-reported Dyspnea: | |
| 0 mm | 100 mm |
| _________________________________________________________ | |
| No respiratory distress | Needs intubation |
| 4. Observer-reported Diaphoresis | |
| 0 mm | 100 mm |
| _________________________________________________________ | |
| Skin is dry. | Dripping with sweat |
Footnotes
Publisher's Disclaimer: This is a PDF file of an unedited manuscript that has been accepted for publication. As a service to our customers we are providing this early version of the manuscript. The manuscript will undergo copyediting, typesetting, and review of the resulting proof before it is published in its final citable form. Please note that during the production process errors may be discovered which could affect the content, and all legal disclaimers that apply to the journal pertain.
Preliminary parts of this study were presented in abstract form at the Society of Academic Emergency Medicine Annual Meeting on May 17, 2007 in Chicago, IL
References
- 1.Chang AM, Maisel AS, Hollander JE. Diagnosis of heart failure. Heart Fail Clin. 2009;5:25–35. vi. doi: 10.1016/j.hfc.2008.08.013. [DOI] [PubMed] [Google Scholar]
- 2.Dickstein K, Cohen-Solal A, Filippatos G, et al. ESC guidelines for the diagnosis and treatment of acute and chronic heart failure 2008: The task force for the diagnosis and treatment of acute and chronic heart failure 2008 of the European society of cardiology. Developed in collaboration with the heart failure association of the ESC (HFA) and endorsed by the European society of intensive care medicine (ESICM) Eur J Heart Fail. 2008;10:933–989. doi: 10.1016/j.ejheart.2008.08.005. [DOI] [PubMed] [Google Scholar]
- 3.Collins SP, Lindsell CJ, Storrow AB, Abraham WT. Prevalence of negative chest radiography results in the emergency department patient with decompensated heart failure. Ann Emerg Med. 2006;47:13–18. doi: 10.1016/j.annemergmed.2005.04.003. [DOI] [PubMed] [Google Scholar]
- 4.Wang CS, FitzGerald JM, Schulzer M, Mak E, Ayas NT. Does this dyspneic patient in the emergency department have congestive heart failure? JAMA. 2005;294:1944–56. doi: 10.1001/jama.294.15.1944. [DOI] [PubMed] [Google Scholar]
- 5.De Backer D, Creteur J, Dubois MJ, Sakr Y, Vincent JL. Microvascular alterations in patients with acute severe heart failure and cardiogenic shock. Am Heart J. 2004;147:91–9. doi: 10.1016/j.ahj.2003.07.006. [DOI] [PubMed] [Google Scholar]
- 6.Di Bari M, Pozzi C, Cavallini MC, et al. The diagnosis of heart failure in the community. comparative validation of four sets of criteria in unselected older adults: The ICARe Dicomano study. J Am Coll Cardiol. 2004;44:1601–8. doi: 10.1016/j.jacc.2004.07.022. [DOI] [PubMed] [Google Scholar]
- 7.Nazerian P, Vanni S, Zanobetti M, et al. Diagnostic accuracy of emergency doppler echocardiography for identification of acute left ventricular heart failure in patients with acute dyspnea: Comparison with boston criteria and N-terminal prohormone brain natriuretic peptide. Acad Emerg Med. 2010;17:18–26. doi: 10.1111/j.1553-2712.2009.00630.x. [DOI] [PubMed] [Google Scholar]
- 8.Beilman GJ, Groehler KE, Lazaron V, Ortner JP. Near-infrared spectroscopy measurement of regional tissue oxyhemoglobin saturation during hemorrhagic shock. Shock. 1999;12:196–200. doi: 10.1097/00024382-199909000-00005. [DOI] [PubMed] [Google Scholar]
- 9.Guyton AC. The Systemic Circulation. 6th ed W.B. Saunders; Philadelphia: 1981. p. 257. [Google Scholar]
- 10.Collins SP, Lindsell CJ, Storrow AB, Abraham WT, ADHERE Scientific Advisory Committee. Investigators and Study Group Prevalence of negative chest radiography results in the emergency department patient with decompensated heart failure. Ann Emerg Med. 2006;47:13–18. doi: 10.1016/j.annemergmed.2005.04.003. [DOI] [PubMed] [Google Scholar]
- 11.Ander DS, Jaggi M, Rivers E, et al. Undetected cardiogenic shock in patients with congestive heart failure presenting to the emergency department. Am J Cardiol. 1998;82:888–91. doi: 10.1016/s0002-9149(98)00497-4. [DOI] [PubMed] [Google Scholar]
- 12.Maisel A, Hollander JE, Guss D, et al. Primary results of the rapid emergency department heart failure outpatient trial (REDHOT). A multicenter study of B-type natriuretic peptide levels, emergency department decision making, and outcomes in patients presenting with shortness of breath. J Am Coll Cardiol. 2004;44:1328–33. doi: 10.1016/j.jacc.2004.06.015. [DOI] [PubMed] [Google Scholar]
- 13.Singer AJ, Birkhahn RH, Guss D, et al. Rapid emergency department heart failure outpatients trial (REDHOT II): A randomized controlled trial of the effect of serial B-type natriuretic peptide testing on patient management. Circ Heart Fail. 2009;2:287–293. doi: 10.1161/CIRCHEARTFAILURE.108.826685. [DOI] [PubMed] [Google Scholar]
- 14.Pfisterer M, Buser P, Rickli H, et al. BNP-guided vs symptom-guided heart failure therapy: The trial of intensified vs standard medical therapy in elderly patients with congestive heart failure (TIME-CHF) randomized trial. JAMA. 2009;301:383–392. doi: 10.1001/jama.2009.2. [DOI] [PubMed] [Google Scholar]
- 15.Gheorghiade M, Follath F, Ponikowski P, et al. Assessing and grading congestion in acute heart failure: A scientific statement from the acute heart failure committee of the heart failure association of the european society of cardiology and endorsed by the European society of intensive care medicine. Eur J Heart Fail. 2010;12:423–433. doi: 10.1093/eurjhf/hfq045. [DOI] [PubMed] [Google Scholar]
- 16.Hogan CJ, Hess ML, Ward KR, Gennings C. The utility of microvascular perfusion assessment in heart failure: A pilot study. Journal of Cardiac Failure. 2005;11:713–719. doi: 10.1016/j.cardfail.2005.07.005. [DOI] [PubMed] [Google Scholar]
- 17.Hogan CJ, Hess ML, Ward KR, Kontos MC, Pittman RN. Quantitative tissue hemoglobin oxygen saturation measurement in decompensated heart failure. Journal of Cardiothoracic-Renal Research. 2006;1:153–157. [Google Scholar]
- 18.Maisel AS, Peacock WF, McMullin N, et al. Timing of immunoreactive B-type natriuretic peptide levels and treatment delay in acute decompensated heart failure: An ADHERE (acute decompensated heart failure national registry) analysis. J Am Coll Cardiol. 2008;52:534–540. doi: 10.1016/j.jacc.2008.05.010. [DOI] [PubMed] [Google Scholar]
- 19.Peacock WF, Emerman CL, Costanzo MR, Berkowitz RI, Cheng M. Early initiation of intravenous vasoactive therapy improves heart failure outcomes: An analysis from the ADHERE registry database. Ann Emerg Med. 2003;42:S26. [Google Scholar]
- 20.Hamilton RJ, Carter WA, Gallagher EJ. Rapid improvement of acute pulmonary edema with sublingual captopril. Acad Emerg Med. 1996;3:205–12. doi: 10.1111/j.1553-2712.1996.tb03422.x. [DOI] [PubMed] [Google Scholar]
- 21.Taylor AL, Ziesche S, Yancy C, et al. Combination of isosorbide dinitrate and hydralazine in blacks with heart failure. N Engl J Med. 2004;351:2049–57. doi: 10.1056/NEJMoa042934. [DOI] [PubMed] [Google Scholar]
- 22.Yancy CW. Heart failure in african americans: Unique etiology and pharmacologic treatment responses. J Natl Med Assoc. 2003;95:1–9. [PMC free article] [PubMed] [Google Scholar]


