

Abstract
High-speed photomicrography was used to study the translational dynamics of single microbubbles in microvessels of ex vivo rat mesenteries. The microbubbles were insonated by a single 2 μs ultrasound pulse with a center frequency of 1 MHz and peak negative pressures spanning the range of 0.8–4 MPa. The microvessel diameters ranged from 10 – 80 μm. The high-speed image sequences show evidence of ultrasound-activated microbubble translation away from the nearest vessel wall; no microbubble showed a net translation toward the nearest vessel wall. Microbubble maximum translational displacements exceeded 20 μm. Microjets with the direction of the jets identifiable were also observed; all microjets appear to have been directed away from the nearest vessel wall. These observations appear to be characteristic of a strong coupling between ultrasound-driven microbubbles and compliant microvessels. Although limited to mesenteric tissues, these observations provide an important step in understanding the physical interactions between microbubbles and microvessels.
Keywords: Microbubbles, Microvessels, Ultrasound, Microbubble translation, Microjets, Inertial cavitation, Acoustic cavitation, Mechanical bioeffects, Ultrasound contrast agent, Mesentery blood vessels, High speed photomicrography, Microbubble dynamics
INTRODUCTION
Most ultrasound contrast agents (UCAs) are micron-sized gas bubbles stabilized by various coatings. Through intravenous injection, they are used in clinical diagnostic ultrasound to enhance contrast of cardiographic or radiologic features. The success of microbubbles in the clinics has spurred their development for new applications in both diagnostic and therapeutic ultrasound, including molecular imaging and drug and gene delivery therapies (Cosgrove and Harvey 2009; Pichon et al. 2008; Villanueva and Wagner 2008). In molecular imaging, microbubbles are conjugated with site-specific targeting ligands that allow binding of the microbubbles to disease markers expressed on the endothelium of blood vessels. They have been explored for screening, diagnosing, and monitoring diseases at the molecular level (Pysz et al. 2010). For drug and gene delivery therapies, microbubbles can be loaded with pharmaceutical agents such as chemotherapeutic drugs and large genetic materials, monitored during perfusion using diagnostic ultrasound, and then forced to release the carried materials at the targeted location by higher power ultrasound. Moreover, interactions between ultrasound-activated microbubbles and the vessel wall can increase the permeability of the endothelium, thus enhancing the delivery of pharmaceutical agents through the vessel wall (Ferrara 2008; Skyba et al. 1998). In both applications, the proximity of microbubbles to the endothelium is important. This close proximity can lead to mechanical interactions between microbubbles and vessels during exposure to ultrasound.
It has long been known that mechanical interactions between a cavitation bubble and a nearby boundary can induce bubble translation and jetting, where the direction of bubble translation and jetting depends on the properties of the boundary. A bubble oscillating near a rigid flat surface translates toward the surface and can form a liquid jet, directed toward the surface (Benjamin and Ellis 1966; Lauterborn and Bolle 1975; Plesset and Chapman 1971). The water hammer pressure associated with the impact of the liquid jet can damage hard surfaces (Blake and Gibson 1987; Johnsen and Colonius 2009; Philipp and Lauterborn 1998). A bubble oscillating near a pressure-release boundary (e.g., an air-water interface) moves away from the boundary during collapse and can form a liquid jet directed away from the boundary (Chahine 1977; Robinson et al. 2001). Near a compliant flat boundary, such as viscoelastic gel, the direction of bubble translation and jetting can be toward or away from the boundary, depending on the mechanical properties of the boundary, bubble size and distance from the boundary (Brujan et al. 2001a; Brujan et al. 2001b; Fong et al. 2006; Gibson and Blake 1982; Kodama and Tomita 2000; Ohl et al. 2009; Shima et al. 1989). However, many of these previous studies focused on freely collapsing, millimeter-sized bubbles that are much larger than the microbubbles used in diagnostic and therapeutic ultrasound. Moreover, the flat boundaries used in these studies differ from actual blood vessels in mechanical properties and geometries.
Relatively little is known about microbubble translation and jetting behavior within microvessels, principally because of the technical difficulty of observing the dynamics of microbubbles in microvessels driven acoustically at megahertz frequencies. It has been shown experimentally that the acoustic radiation force on microbubbles in a 50 μm diameter arteriole could drive the microbubbles to translate along the transducer’s acoustic axis (Dayton et al. 1999). Microjet formation in a 200 μm diameter cellulose tube has been recorded (Postema et al. 2004), demonstrating that liquid jets can be formed by encapsulated microbubbles in tubes. Although the recorded image did not show the direction of the microjet relative to the tube wall, the authors suggested that in clinical applications microjets may be directed toward and thus impinge upon the endothelial wall. The first observation of single-microbubble dynamics in actual microvessels was reported by Caskey et al. (Caskey et al. 2007). They observed ultrasound-activated microbubbles in microvessels of ex vivo rat cecum, recording microbubble translation toward the vessel wall and a toroidal bubble morphology consistent with the formation of a microjet. The stroboscopic technique by which these images were acquired produced one image per ultrasound pulse; by repeated sampling over many pulses at different phases, the full dynamics of the microbubble could only be inferred. The limitation of this technique is that it is applicable only to repeatable events. Nevertheless, Caskey et al. suggested that microbubbles translate and form microjets directed toward vessel walls, and that microjet impact on vessel walls is a mechanism for microbubble-enhanced vascular permeability and/or vascular damage.
To investigate explicitly the transient interactions between microbubbles and microvessels, we used a high-speed photomicrography system for the real-time observation of interactions between individual microbubbles and microvessels in ex vivo rat mesenteries insonated by single ultrasound pulses. In our previous work, we focused on blood vessel deformations induced by the microbubbles (Chen et al. 2011). In the present work, our focus is on the direction and magnitude of translation and jetting of the microbubbles. Although this work is limited to rat mesenteric microvessels, the mesentery is a useful model system from which much has been learned and remains to be learned concerning interactions between vessels and acoustically-driven microbubbles.
MATERIALS AND METHODS
Animal tissue preparation
The animal use protocol was approved by the Institutional Animal Care and Use Committee (IACUC) at the University of Washington. The rat mesentery was selected as the animal tissue model. It is composed of a membranous tissue, which contains thin and transparent regions, allowing easy observations of its microvasculature under light microscopy (Fig. 1). Fischer 344 rats (~200 g body weight, male) were used. To prepare the animal tissue, a rat was anesthetized, the mesentery was exposed surgically, and kept warm and moist by a 37°C drip irrigation. The superior mesenteric artery (SMA) was cannulated by a 24-gauge angiocatheter. Heparin was injected through the catheter to the mesentery, followed by perfusion of heparinized saline. A 20-gauge angiocatheter was placed in the portal vein to serve as an outflow orifice. The rat was then sacrificed while under general anesthesia. Its mesentery with intestine was excised after visible blood was no longer present in the outflow. The excised mesentery was used up to a maximum of four hours.
Figure 1.
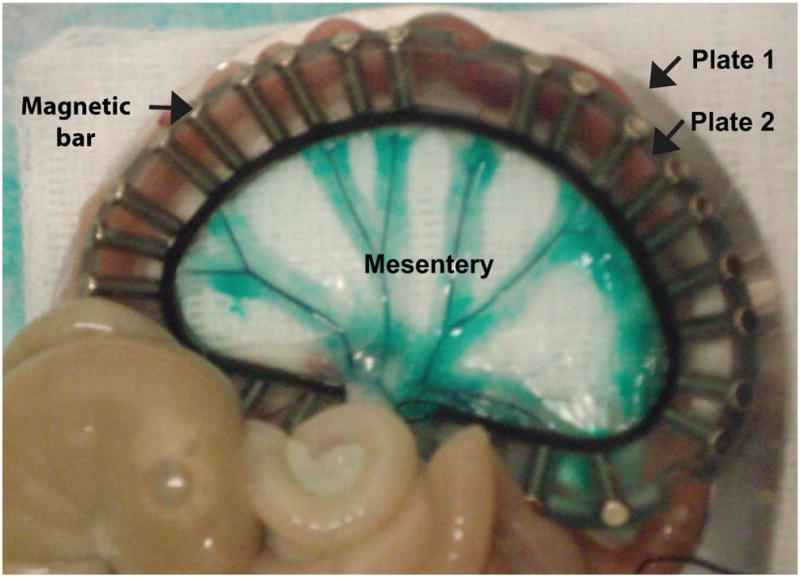
Illustration of the prepared tissue sample. The rat mesentery is composed of a membranous tissue divided into several ‘mesenteric windows’ by fatty frames containing large branches of mesenteric arteries and veins, whose presence is emphasized by intravascular green dye. These windows are transparent, allowing for direct observation of their microvasculature by light microscopy. A selected mesenteric region is sandwiched between two D-shaped plates (plates 1 (beneath tissue) and 2 (above tissue)) to provide support. The two plates were held together by magnetic bars (Chen et al. 2010).
A segment of the mesentery with a rich vascular network, as determined by light microscopic examination, was selected as the region of interest (ROI). While perfusion was maintained through the SMA cannula, one feeding artery and one draining vein of the ROI were cannulated using two polyethylene tubes with 0.6 mm outer diameter (PE 10; VWR International, San Francisco, CA, USA), and the appropriate vessel branches leading to other regions were ligated by suture. Commercial ultrasound contrast agent microbubbles (Definity®) diluted in saline to a concentration between 0.03 to 0.1% by volume were perfused into the ROI through one of the tubes using a syringe pump. The ROI was held in place by first gently spreading and then sandwiching it firmly at the edges by two plates with a 3.5 cm radius semicircular hole, as illustrated by Fig. 1. The two D-shaped plates effectively clamped the margin of the tissue to restrain the injected microbubbles within the ROI. Care was taken not to stretch the tissue more than appeared to be the case in situ while applying the clamping devices. Green India ink (Dr. Ph. Martin’s Bombay India Inks; Blick Art Materials, Galesburg, IL, USA) diluted by saline to a volume concentration less than 3% was mixed with the microbubbles before injection. The ink was used to increase the visual contrast of the vessels relative to the surrounding tissue.
Experimental system
The orientation of the main components of the experimental system is illustrated in Fig. 2a. Additional detailed information is provided in the references (Chen et al. 2010; Chen et al. 2011). The prepared mesentery tissue sample was transferred to a bath of phosphate buffered saline at room temperature and located on the stage of an inverted microscope (TE2000-U; Nikon Inc., Melville, NY, USA) with a long working distance water immersion objective (40×; working distance 3.5 mm; numerical aperture 0.8; nominal depth of field 0.43 μm). The microscope was aligned confocally with a focused ultrasound transducer (H102; Sonic Concepts, Bothell, WA, USA), which had a center frequency of 1 MHz, a geometrical focal length of 63 mm and an aperture of 64 mm (f-number ≈ 1). The transducer was driven by a single cycle sine wave produced by a function generator (33120A; Hewlett Packard, Palo Alto, CA, USA) and amplified by a power amplifier (A150; ENI, Rochester, NY, USA). The acoustic pressure at the focus of the transducer was measured with a fiber optic probe hydrophone (FOPH 2000; RP Acoustics, Leutenbach, Germany). Figure 2b displays a typical pressure waveform. The waveform consists of an incident pulse from the transducer of about 2 cycles and a reflected pulse from the microscope objective at a delay of over 4 μs relative to the incident pulse. The peak negative pressures (PNP) of the ultrasound pulses used in this study were within the range of 0.8 – 4 MPa, representing a range from diagnostic to therapeutic levels.
Figure 2.
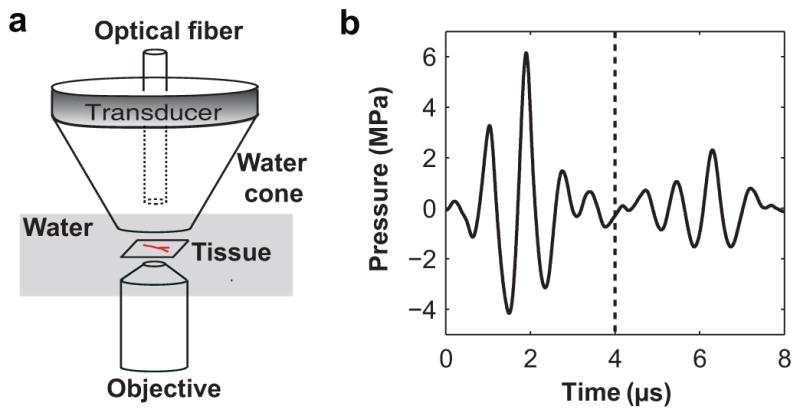
(a) Orientation of major components of the experimental system. (b) A typical pressure waveform measured at the position of the tissue sample (in the absence of the tissue sample). The arrival time of the ultrasound pulse at the tissue sample was defined as time zero. High-speed image sequences were typically captured within the initial 4 μs as marked by the dashed vertical line.
An optical fiber coupled to both a fiber optic illuminator (Model 41500-50; Cole-Parmer Instrument Co., Vernon Hills, Illinois) and a high-intensity flash lamp (IMS 300; IMC, Burbank, CA, USA) was inserted through a hole in the center of the transducer to provide backlighting for conventional and high-speed microscopic imaging. An ultra-high speed camera (Imacon 200; DRS Hadland, Cupertino, CA, USA) was connected to the microscope and synchronized with the transducer. When a microbubble was found in a microvessel within the confocal region of the microscope and the ultrasound transducer, an ultrasound pulse was emitted and at the same time the camera captured an image sequence at a shutter speed of 50 ns and a typical interframe time of 300 ns. The image sequence consisted of 14 frames, so the entire recording time was about 4 μs. Therefore, these image frames were acquired before the arrival of the acoustic wave reflected from the microscope objective (Fig. 2b). An interframe time of 600 ns was used to record a few image sequences, and for these sequences only frames acquired within the initial 4 μs were considered for image analysis.
Image analysis
To perform measurements from the selected image sequences, dimensions were calibrated using images of a standard stage micrometer (10 μm per smallest division). The resulting scaling (6.3 pixel/μm) was used in concert with a custom Matlab program (Mathworks Inc., Sherborn, MA, USA) that allowed the marking of characteristic points and the measurement of corresponding distances. All measurements were repeated by interactively marking each selected image sequence three separate times. Averages of the resulting measurements are presented here. Limited by user variability, the clarity of the image, and frame-to-frame distortion characteristics of the camera, the measurement uncertainty was estimated to range from 1–3 μm.
To analyze the interactions between microbubbles and microvessels, the following measurements were acquired from each image sequence: the initial vessel diameter D, the initial bubble-vessel distance L, the maximum equivalent microbubble radius Rmax, and the positions in each frame of the microbubble center and the point on the vessel wall closest to the microbubble center. Then, microbubble translation distances and vessel wall displacements during each sequence were calculated as position changes relative to their initial locations. Note that movement away from the nearest vessel wall and toward the lumen was defined as negative. Details of how D, L, and Rmax were measured are as follows.
In the frame captured before vessel wall motion was observed, the initial vessel diameter D was measured along a line passing through the pixel coordinates of the center of the microbubble when it first appeared, perpendicular to the vessel axis (Fig. 3a). The microbubble center was defined by the intersection of two lines drawn by the user to define the maximum lengths of the microbubble along the axial and radial directions of the microvessel. The initial bubble-vessel distance L was then measured as the distance from the initial location of the microbubble center to the initial position of the nearest vessel wall (Fig. 3a). Note that the image plane was adjusted to pass approximately through the midplane of the vessel, and the nearest vessel wall was defined as the vessel wall closest to the microbubble in the image plane (this distance was not necessarily the shortest bubble-vessel distance in 3-D space). Such an assumption is required by the present technique because only those events occurring within a very shallow image plane (focal depth ~0.4 μm) were observable.
Figure 3.
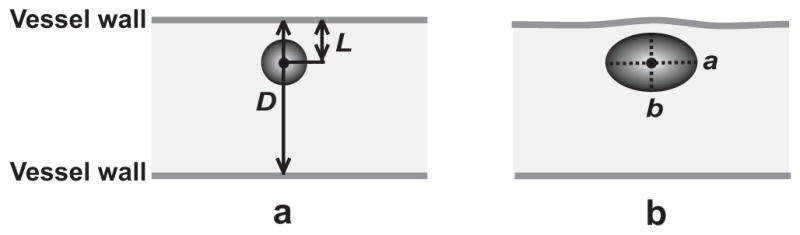
Illustration of several quantities measured in each selected image sequence. (a) The initial vessel diameter D and bubble-vessel distance L were measured before vessel wall motion was observed. (b) At the maximum expansion state of the microbubble, the spherical-equivalent microbubble radius Rmax was calculated using a and b, which are the maximum half-lengths of the microbubble along the axial and radial directions of the microvessel, respectively. A time stamp for each frame is located at the bottom left corner, and the scale bar on the bottom right of each sequence represents 10 μm.
The equivalent microbubble radius Rmax was quantified at the maximum expansion state of the microbubble. First, the maximum lengths of the microbubble along the axial and radial directions of the microvessel were measured, and their half-lengths were denoted a and b, respectively (Fig. 3b). Second, the volume of the microbubble was estimated as (4/3)πab2 by assuming the microbubble was a prolate spheroid with equatorial radius b. Last, an equivalent radius Rmax was calculated as the radius of a spherical microbubble with the same volume. The assumption that the microbubbles were prolate spheroids was made in consideration of the cylindrical geometry of the vessel and the observation that many of the microbubbles were close to an elliptical shape in 2-D. Besides the assumption of a prolate spheroid, we note that some additional uncertainty is inherent in the measurement of Rmax because the bubble is not always exactly centered in the image plane, for which the focal depth was much smaller than the maximum bubble size.
In all the image sequences, the direction of ultrasound propagation was orthogonal to the image plane (i.e., into the plane of the page or screen). Consequently, the primary acoustic radiation force (or the primary Bjerknes force) was orthogonal to the observation plane. Since the microbubbles remained visible in the image plane after insonation, the radiation force did not significantly affect microbubble translation in or out of the image plane.
RESULTS
Microbubble translation
In total, 80 high-speed image sequences were selected for analyzing microbubble translation. Each selected sequence was required to satisfy two criteria: (1) the recorded interaction involved either a microvessel and a single microbubble, or multiple microbubbles for which the microbubble of interest had a maximum radius at least twice that of others or remained separated from others by at least two maximum bubble radii; (2) image sequences showed microbubble oscillations with at least two inertial growth and collapse cycles in response to the 2-cycle ultrasound pulses (Fig. 2b).
To aid in the presentation of results, the measured quantities D, L, and Rmax were used to calculate two dimensionless parameters: the relative size of the microvessel, as identified by the ratio of the initial vessel diameter to the maximum microbubble diameter (D/2Rmax), and the relative proximity of the microbubble to the nearest vessel wall, as represented by the dimensionless standoff distance (L/Rmax). Note that bubble-vessel distances changed during each image sequence due to movements of both the microbubble center and the vessel wall. The standoff distance was defined using the initial bubble-vessel distance L to be consistent with a conventional definition of bubble standoff distance in related work (Brujan et al. 2001b; Shima et al. 1989).
Figures 4a–4c present three image sequences showing microbubble translation in microvessels. Corresponding measurements of bubble translation are plotted for each sequence in Fig. 5. These image sequences were selected to include microbubbles at different standoff distances (L/Rmax) ranging from ~0.5–1.8.
Figure 4.

(a–c) Selected high-speed image sequences that show microbubble translation in microvessels. (a) D = 45 μm, D/2Rmax = 2.5, 2 L/Rmax = 1.8, and PNP = 2.8 MPa. The arrows in the first and last frames point to the microbubble. (b) D = 46 μm, D/2Rmax = 2.6, L/Rmax = 0.8, and PNP = 1.5 MPa. The arrows in the first and last frames point to the microbubble. (c) D= 78 μm, D/2Rmax = 5.2, 5 L/Rmax = 0.5, and PNP = 1.5 MPa. The arrow in the first frame indicates the initial location of the vessel wall that moved during microbubble oscillation. The arrow in the last frame points to the microbubble.
Figure 5.
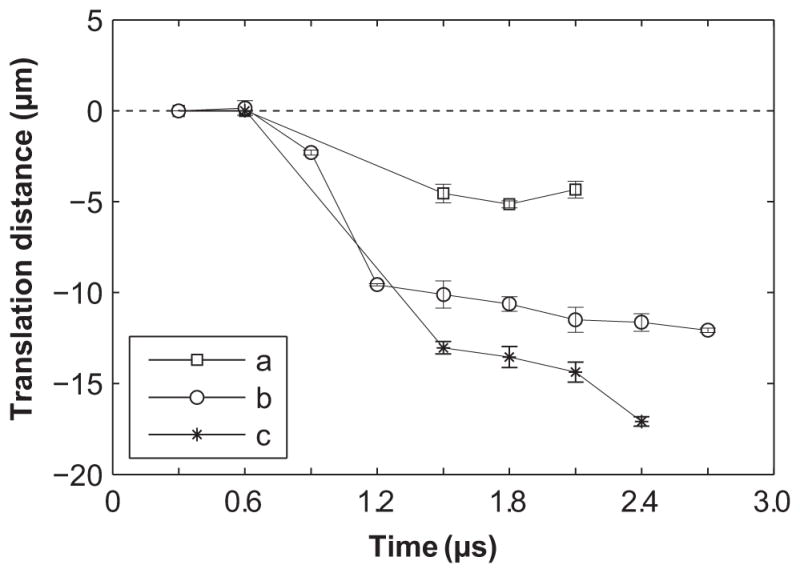
Displacements of the microbubble center for cases a, b and c shown in Fig. 4. Displacements toward the vessel lumen are defined as negative. The dimensionless standoff distance (L/Rmax) of the microbubble was 1.8, 0.8 or 0.5 for the three cases, respectively. The microbubbles all translated away from the nearest vessel wall, and the extent of translation increases as the standoff distance decreases. The error bars are standard errors of the measurements.
At the largest standoff distance, Fig. 4a shows the dynamics of a microbubble with L/Rmax = 1.8 (in the image plane, the left vessel wall is nearest). In this case, the microbubble was relatively far from the vessel wall; the microbubble center moved slightly during microbubble oscillation. The final net translational distance of the microbubble was ~5 μm (Fig. 5).
Figure 4b displays the dynamics of a microbubble with L/Rmax = 0.8. In this case, the interaction between the microbubble and the vessel wall was stronger than the previous case, as indicated by the near flattening of the microbubble during its expansion at 0.6 μs. The expansion of the microbubble against the left vessel wall led to slight distention of that vessel wall. The subsequent collapse of the microbubble at 1.2 μs coincided with a slight rebound of the left vessel wall. The microbubble re-expanded at 1.8 μs. At 2.7 μs, the microbubble contracted, accompanied by a final translation of the microbubble center by 12 μm (Fig. 5).
Figure 4c shows the translation of a microbubble at a standoff L/Rmax = 0.5. At 0.6 μs, the microbubble had expanded against the upper wall, resulting in localized distention of the vessel by about 3 μm. The subsequent collapse of the microbubble at 0.9 μs (the microbubble is not visible in the image) led to local invagination of the upper vessel wall, which remained invaginated in all subsequent frames. At 1.5 μs, the microbubble appears to be spheroidal in shape, and its center had moved away from the upper vessel wall by 13 μm. At 2.4 μs, the microbubble collapsed again and translated even further from the upper vessel wall, reaching a final translation distance of 17 μm (Fig. 5), accompanied by vessel wall invagination by about 6 μm. Vessel wall displacements were observed only on the near vessel wall while the far vessel wall remained stationary.
The examples from Fig. 4 demonstrate characteristic behaviors from our observations of microbubbles in microvessels; viz.: (1) the extent of microbubble translation was related to the standoff distance; (2) final translation was directed away from the nearest vessel wall.
A common feature of these examples is that the vessel diameters were relatively large with D/2Rmax = 2.5, 2.6 or 5.2 in Figs. 4a–4c, respectively. We consider microvessels with D/2Rmax > 2 to be relatively large microvessels, in which most microbubbles at small standoff distances caused displacements only of the nearest vessel wall, with no visible effect on the opposite side of the vessel. Overall, there were 41 image sequences recorded with a microbubble in a relatively large microvessel. Figure 6 displays the maximum microbubble translation distance as a function of L/Rmax as measured from the 41 cases. The initial vessel diameters were in the range of 30–80 μm. Some image sequences that were analyzed for vessel displacements in our previous publication (Chen et al. 2011) were also analyzed for microbubble displacements. The corresponding data points in the plot are marked, while single-microbubble and multiple-microbubble cases are also distinguished. Among all these cases, 23 involved translation away from the nearest vessel wall. In the other 18 cases, the microbubble remained stationary to within our limits of uncertainty (as the measurement uncertainty was estimated to range from 1–3 μm, we consider the microbubble to be ‘stationary’ when the absolute value of its maximum displacement was less than 2 μm). No net translation of a microbubble was observed toward the nearest vessel wall.
Figure 6.
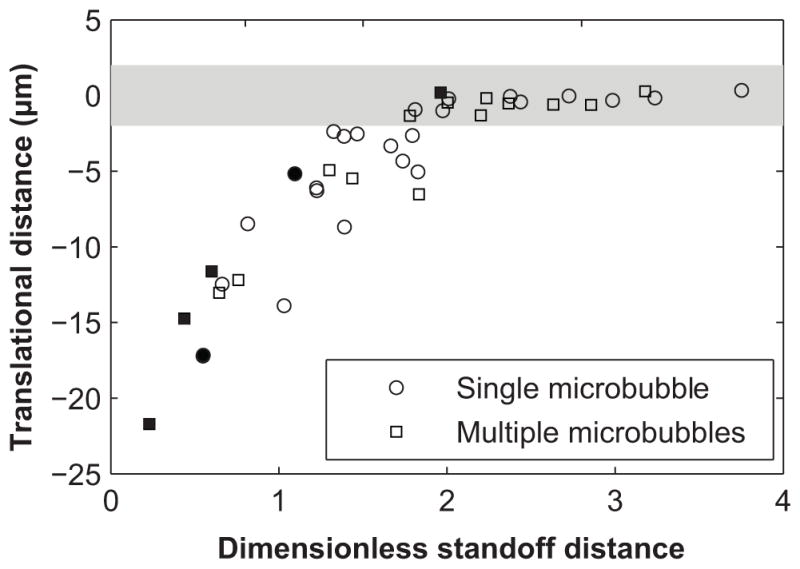
Plot of the maximum microbubble translation distance with respect to the dimensionless standoff distance L/Rmax for relatively large microvessels (D/2Rmax > 2). Data points falling within the shaded region (±2 μm) represent microbubbles that were considered to be stationary, with translation distances less than the resolution provided by measurements. Note that there is a nearly linear trend of decreasing absolute microbubble translation distances with increasing dimensionless standoff distances up to a dimensionless standoff distance of ~2, above which microbubbles stayed stationary. This threshold behavior should be considered qualitative, because L and Rmax measurement errors can affect the value of the threshold. Single microbubble and multiple microbubble cases are shown using circles and squares, respectively. Image sequences that were analyzed for vessel displacement in our previous publication (Chen et al. 2011) are indicated by filled symbols.
The organization apparent in Fig. 6 suggests that microbubble translation depended strongly on L/Rmax. At high dimensionless standoff distances (L/Rmax > 2), microbubbles remained stationary; at low dimensionless standoff distances (L/Rmax < 2), microbubbles translated away from the nearest vessel wall, with the absolute translation distances increasing at smaller standoff distances. This threshold behavior should be considered qualitative only in the sense that errors of L and Rmax can affect the value of the threshold.
In contrast to cases with relatively large microvessels, in cases with relatively small microvessels (i.e., D/2Rmax < 2), most microbubbles induced displacements of both the near and far vessel walls in the imaging plane. Such interactions were recorded in 39 cases with the initial vessel diameters ranging from 10–45 μm. The measured maximum translation distances were typically smaller than those observed in relatively large microvessels at comparable standoff distances, though no measurable translation toward the nearest vessel was observed. Figure 7 shows an image sequence of a microbubble in a relatively small microvessel with D/2Rmax = 0.9. For this case L/Rmax = 0.6 (the left vessel wall is nearest). Both sides of the vessel experienced distention and invagination during microbubble expansion and collapse. In the last frame, both sides of the vessel became invaginated by about 8 μm, implying that the vessel may be distorted into an hourglass shape in 3-D space. During this interaction, the microbubble center translated away from the left vessel wall by a maximum of only 3 μm, which is much smaller than translations experienced by comparable microbubbles in relatively large microvessels (see Fig. 6 at L/Rmax = 0.6).
Figure 7.

Microbubble translation in a relatively small microvessel. D = 28 μm, D/2Rmax = 0.9, L/R max = 0.6, and PNP = 1.5 MPa. The scale bar represents 10 μm.
Microjetting
In total, 19 high-speed image sequences were selected for analyzing microjetting (among them, 7 were also selected for translation analysis). For jetting, each selected sequence satisfied two criteria: (1) just as for the translation analysis, the recorded interaction involved a microvessel and an isolated or dominant microbubble; and (2) the direction of the microjet was clearly identifiable. These observations show that the direction of microjets was consistent with the translation direction: both were directed away from the vessel wall initially closest to the microbubble.
Characteristic microjets are shown in Fig. 8. Figure 8a shows the formation of a microjet in a microbubble with L/Rmax = 0.4, relative to the left vessel wall. The microbubble expanded against the left vessel wall (0.3 and 0.6 μs), and then contracted (0.9 μs). It re-expanded at 1.2 μs and its center had moved by about 4 μm away from the left vessel wall. During further re-expansion, a microjet penetrated through the interior of the microbubble (1.8 μs). The direction of the microjet was away from the left vessel wall, as determined by the shape of the microbubble and also by the observation that the width of the microjet was widest near the left vessel wall. The length of the (identifiable) microjet was about 38 μm, which is smaller than the vessel diameter. Consequently, the microjet does not appear to impact the vessel wall. Additionally, if we assume that the microjet started to form at 0.9 μs, an average speed of 42 m/s can be estimated between 0.9 and 1.8 μs. This estimate is probably a lower bound, as the microjet may have started to form later at the end of collapse or early in the rebound (Blake and Gibson 1987).
Figure 8.

Microjets formed in microvessels. (a) D = 48 μm, L/Rmax = 0.4, and PNP = 3 MPa. (b) D = 30 μm, L/Rmax = 0.3 and PNP = 1.5 MPa. In the last frame for each case, the microjet is pointed out by an arrow. The arrow in the first frame of (b) indicates the microbubble of interest. The scale bar in each sequence represents 10 μm.
Figure 8b shows a microjet in a microbubble with L/Rmax = 0.3, relative to the left-side vessel wall. Similar to Fig. 8a, the microbubble of interest (marked by the arrow) expanded and flattened against the left vessel wall, deforming to almost a hemispherical shape (0.6 μs). In the third frame (0.9 μs), the microbubble had collapsed and translated away from the left side vessel wall by 6 μm; also, the left-side vessel wall became invaginated by 3 μm (this invagination remained even when the microbubble re-expanded at 1.2 μs). In the last frame (1.8 μs), the re-expanding microbubble contacted both sides of the vessel wall, and a microjet had penetrated the microbubble in the direction away from the left vessel wall. The length of the microjet was about 22 μm, and the average speed of the microjet is estimated to be 24 m/s. In this case, the microjet was directed away from the left vessel wall and had a length similar to the vessel diameter; consequently, the jet may have impinged directly on the opposite vessel wall. Note that slight bending of the jet toward the lower position of the vessel wall was observed, which may have been caused by the presence of the small microbubble visible in the first two frames, or by the geometry of the vessel wall next to the microbubble.
The characteristic features of the 19 observed jets can be summarized as follows: (1) during the initial expansion phase, the microbubble appears to contact the vessel wall at one site, flattening somewhat against it; (2) the microjet, which may start to form during the collapse or re-expansion phase of the microbubble, is clearly visible during the re-expansion phase and is directed away from the contact site; and (3) L/Rmax < 1 in all of the cases. In this work, we did not observe leakage of dye out of the microvessels before, during or after high-speed imaging.
DISCUSSION
The results presented in this study – observations of microbubble translation and jetting away from the nearest boundary – are limited to vessels in ex-vivo rat mesenteries. These vessels are surrounded principally by a thin membrane comprised by structural proteins, and thus differ from tissues such as muscle or the parenchyma of solid organs, in which there is a more fully 3D tissue architecture and there exist extravascular interstitial spaces. Mechanically, the mesentery, as with other real tissues, exhibits nonlinear strain stiffening (Fung 1993), and thus mechanical effects observed in the mesenteric vessels are likely more representative of vessels in more fully 3D biological tissues than are the synthetic materials that have been studied in the past. Furthermore, there is evidence that the shear modulus of the mesentery is less than, but not too dissimilar from, larger arteries and veins (Fung et al. 1966), and that the stress-strain relation of the mesentery has much in common with other soft tissues (Fung 1967); thus these results may be applicable to larger arteries and veins, and other soft tissues.
Many studies have been performed on the direction of bubble translation and/or jetting. These studies showed that near a boundary the direction of bubble translation and jetting depends on the mechanical properties of the boundary. For a bubble near a compliant boundary (as in our case), the boundary can be deformed by the expansion of the bubble. This deformation stores elastic energy, which can be released as the bubble collapses. This type of bubble-boundary interaction can create a pressure gradient that drives flow away from the boundary; if this gradient is large enough, translation and jetting away from the boundary can occur (Blake and Gibson 1987; Brujan et al. 2001a; Brujan et al. 2001b; Shima et al. 1989). For example, Shima et al. (Shima et al. 1989) studied the migration of spark-induced bubbles near various viscoelastic composite surfaces and found that bubbles always migrated away from very flexible surfaces. Brujan et al. (Brujan et al. 2001b) observed laser-induced cavitation bubbles; for the least-stiff gel boundaries they considered, bubble translation and jetting were also directed away from the boundary. In mesenteric microvessels, whose viscoelastic properties are poorly understood, we found previously that microbubble oscillation could cause distention and invagination of the vessel wall, with invagination typically larger than distention (Chen et al. 2011). Moreover, in this prior work, the preferential invagination was thought to be related to the formation of jets directed away from the adjacent vessel wall. As demonstrated in the present work, these behaviors are also correlated with microbubble translation away from the nearest vessel wall.
In addition to the mechanical properties of a nearby boundary, microbubble translation and jetting also depend on the proximity of the boundary. As demonstrated by Fig. 6, for relatively large microvessels (D/2Rmax > 2), the extent of microbubble translation increased with decreasing standoff distance L/Rmax. At standoff distances exceeding ~2, no measurable translation was observed. Again, the threshold behavior should be considered qualitative as errors in the measurements of L and Rmax can affect the value of the threshold. We note that the data in Fig. 6 reresent bubble-vessel interactions involving a large range of excitation pressures (0.8–4 MPa). Pressure is not considered explicitly in the plot of Fig. 6 for two reasons: (1) Rmax implicitly accounts for the excitation pressure (along with parameters such as vessel diameter and microbubble shell properties); and (2) translation of a bubble during its collapse is associated with flow asymmetries in the surrounding fluid rather than the acoustic pressure per se. Because flow asymmetries are more directly caused by geometric flow confinement (such as that caused by the nearby vessel wall), the dimensionless standoff distance L/Rmax is expected to correlate well with bubble translation. Moreover, a separate analysis of the data demonstrates that the observed bubble translations from Fig. 6 are not explicitly correlated with excitation pressure. A similar dependency of bubble translation on L/Rmax was reported by Kodama and Tomita (Kodama and Tomita 2000), who investigated the translation of laser-generated bubbles at different standoff distances from a flat gelatin surface as a model of in vivo bubble dynamics near human tissue. This similarity suggests that relatively large microvessels may behave like flat boundaries, at least for the purposes of microbubble/vessel interactions. For relatively small microvessels, microbubble translation tended to be reduced as illustrated by Fig. 7, which may be partially due to the influence of the non-planar vessel geometry. Furthermore, microjets were observed only for L/Rmax < 1, suggesting that strong interactions between microbubbles and vessel walls were necessary for the formation of clearly visible microjets. Our analysis showed that out of 51 data sets that satisfied the condition L/Rmax < 1, 19 showed clear signs of jetting. There may have been other cases where jet structures were not visible because they were out of the image plane.
This study was performed with a single pulse at relatively high pressures. Most molecular imaging studies are performed at lower pressures, but with a considerable number of imaging pulses, often designed to enhance microbubble responses. One can speculate that over a series of pulses, the compliance of a vessel may induce microbubble translational forces that can rival adhesion forces of targeted microbubbles, although it is beyond the scope of this study to quantify these forces. In addition, the finding that microjets were always directed away from the nearest vessel wall suggests that microjet impingement may not be the dominant mechanism by which microbubbles increase permeability to microvessels whose diameters exceed microjet lengths. However, in smaller microvessels, whose diameters were smaller than microjet lengths, vascular rupture by microjetting may occur, as the microjets directed away from the nearest vessel wall may impact the opposite vessel wall.
SUMMARY
The transient dynamics of individual microbubbles in microvessels of the ex vivo rat mesentery insonated by single ultrasound pulses were recorded using real-time, high-speed photomicrography. The image sequences show that interactions between ultrasound-activated microbubbles and microvessels led to microbubble translation away from the nearest vessel wall. They also depict the formation of microjets directed away from the nearest vessel wall. These observations appear to be characteristic of a strong coupling between ultrasound-driven microbubbles and compliant microvessels.
Acknowledgments
The authors thank Lawrence A. Crum, Joo Ha Hwang, Oleg A. Sapozhnikov and Yak-Nam Wang for discussions. They also thank Frank Starr, Francis Olson, Brian MacConaghy and Michael S. Canney for assistance with the experiment. Finally, we gratefully acknowledge the reviewers, whose suggestions improved the manuscript greatly. This work was supported in part by NIH grants EB000350 (NIBIB), AR053652 (NIAMS), DK043881 (NIDDK) and DK070618 (NIDDK).
Footnotes
Publisher's Disclaimer: This is a PDF file of an unedited manuscript that has been accepted for publication. As a service to our customers we are providing this early version of the manuscript. The manuscript will undergo copyediting, typesetting, and review of the resulting proof before it is published in its final citable form. Please note that during the production process errors may be discovered which could affect the content, and all legal disclaimers that apply to the journal pertain.
References
- Benjamin TB, Ellis AT. Collapse of cavitation bubbles and pressures thereby produced against solid boundaries. Philos Trans Roy Soc London Ser A. 1966;260:221–240. [Google Scholar]
- Blake JR, Gibson DC. Cavitation bubbles near boundaries. Annu Rev Fluid Mech. 1987;19:99–123. [Google Scholar]
- Brujan EA, Nahen K, Schmidt P, Vogel A. Dynamics of laser-induced cavitation bubbles near an elastic boundary. J Fluid Mech. 2001a;433:251–281. [Google Scholar]
- Brujan EA, Nahen K, Schmidt P, Vogel A. Dynamics of laser-induced cavitation bubbles near elastic boundaries: influence of the elastic modulus. J Fluid Mech. 2001b;433:283–314. [Google Scholar]
- Caskey CF, Stieger SM, Qin S, Dayton PA, Ferrara KW. Direct observations of ultrasound microbubble contrast agent interaction with the microvessel wall. J Acoust Soc Am. 2007;122:1191–1200. doi: 10.1121/1.2747204. [DOI] [PubMed] [Google Scholar]
- Chahine GL. Interaction between an oscillating bubble and a free-surface. J Fluid Eng-T Asme. 1977;99:709–716. [Google Scholar]
- Chen H, Brayman AA, Bailey MR, Matula TJ. Blood vessel rupture by cavitation. Urol Res. 2010;38:321–326. doi: 10.1007/s00240-010-0302-5. [DOI] [PMC free article] [PubMed] [Google Scholar]
- Chen H, Kreider W, Brayman AA, Bailey MR, Matula TJ. Blood vessel deformations on microsecond time scales by ultrasonic cavitation. Phys Rev Lett. 2011;106:034301. doi: 10.1103/PhysRevLett.106.034301. [DOI] [PMC free article] [PubMed] [Google Scholar]
- Cosgrove D, Harvey C. Clinical uses of microbubbles in diagnosis and treatment. Med Biol Eng Comput. 2009;47:813–826. doi: 10.1007/s11517-009-0434-3. [DOI] [PubMed] [Google Scholar]
- Dayton P, Klibanov A, Brandenburger G, Ferrara K. Acoustic radiation force in vivo: a mechanism to assist targeting of microbubbles. Ultrasound Med Biol. 1999;25:1195–1201. doi: 10.1016/s0301-5629(99)00062-9. [DOI] [PubMed] [Google Scholar]
- Ferrara KW. Driving delivery vehicles with ultrasound. Adv Drug Del Rev. 2008;60:1097–1102. doi: 10.1016/j.addr.2008.03.002. [DOI] [PMC free article] [PubMed] [Google Scholar]
- Fong SW, Klaseboer E, Turangan CK, Khoo BC, Hung KC. Numerical analysis of a gas bubble near bio-materials in an ultrasound field. Ultrasound Med Biol. 2006;32:925–942. doi: 10.1016/j.ultrasmedbio.2006.03.005. [DOI] [PubMed] [Google Scholar]
- Fung YC. Elasticity of soft tissues in simple elongation. Am J Physiol. 1967;213:1532–1544. doi: 10.1152/ajplegacy.1967.213.6.1532. [DOI] [PubMed] [Google Scholar]
- Fung YC. Biomechanics: Mechanical Properties of Living Tissues. New York: Springer; 1993. [Google Scholar]
- Fung YC, Zweifach BW, Intaglietta M. Elastic environment of the capillary bed. Circ Res. 1966;19:441–461. doi: 10.1161/01.res.19.2.441. [DOI] [PubMed] [Google Scholar]
- Gibson DC, Blake JR. The growth and collapse of bubbles near deformable surfaces. Appl Sci Res. 1982;38:215–224. [Google Scholar]
- Johnsen E, Colonius T. Numerical simulations of non-spherical bubble collapse. J Fluid Mech. 2009;629:231–262. doi: 10.1017/S0022112009006351. [DOI] [PMC free article] [PubMed] [Google Scholar]
- Kodama T, Tomita Y. Cavitation bubble behavior and bubble-shock wave interaction near a gelatin surface as a study of in vivo bubble dynamics. Appl Phys B-Lasers O. 2000;70:139–149. [Google Scholar]
- Lauterborn W, Bolle H. Experimental investigations of cavitation-bubble collapse in neighborhood of a solid boundary. J Fluid Mech. 1975;72:391–399. [Google Scholar]
- Ohl SW, Klaseboer E, Khoo BC. The dynamics of a non-equilibrium bubble near bio-materials. Phys Med Biol. 2009;54:6313–6336. doi: 10.1088/0031-9155/54/20/019. [DOI] [PubMed] [Google Scholar]
- Philipp A, Lauterborn W. Cavitation erosion by single laser-produced bubbles. J Fluid Mech. 1998;361:75–116. [Google Scholar]
- Pichon C, Kaddur K, Midoux P, Tranquart F, Bouakaz A. Recent advances in gene delivery with ultrasound and microbubbles. J Exp Nanosci. 2008;3:17–40. [Google Scholar]
- Plesset MS, Chapman RB. Collapse of an initially spherical vapour cavity in neighbourhood of a solid boundary. J Fluid Mech. 1971;47:283–290. [Google Scholar]
- Postema M, van Wamel A, Lancée CT, de Jong N. Ultrasound-induced encapsulated microbubble phenomena. Ultrasound Med Biol. 2004;30:827–840. doi: 10.1016/j.ultrasmedbio.2004.02.010. [DOI] [PubMed] [Google Scholar]
- Pysz MA, Gambhir SS, Willmann JK. Molecular imaging: current status and emerging strategies. Clin Radiol. 2010;65:500–516. doi: 10.1016/j.crad.2010.03.011. [DOI] [PMC free article] [PubMed] [Google Scholar]
- Robinson PB, Blake JR, Kodama T, Shima A, Tomita Y. Interaction of cavitation bubbles with a free surface. J Appl Phys. 2001;89:8225–8237. [Google Scholar]
- Shima A, Tomita Y, Gibson DC, Blake JR. The growth and collapse of cavitation bubbles near composite surfaces. J Fluid Mech. 1989;203:199–214. [Google Scholar]
- Skyba DM, Price RJ, Linka AZ, Skalak TC, Kaul S. Direct in vivo visualization of intravascular destruction of microbubbles by ultrasound and its local effects on tissue. Circulation. 1998;98:290–293. doi: 10.1161/01.cir.98.4.290. [DOI] [PubMed] [Google Scholar]
- Villanueva FS, Wagner WR. Ultrasound molecular imaging of cardiovascular disease. Nat Clin Pract Cardiovasc Med. 2008;5:S26–S32. doi: 10.1038/ncpcardio1246. [DOI] [PMC free article] [PubMed] [Google Scholar]