

Abstract
Many low-abundance biomarkers for early detection of cancer and other diseases are invisible to mass spectrometry because they exist in body fluids in very low concentrations, are masked by high-abundance proteins such as albumin and immunoglobulins, and are very labile. To overcome these barriers, we created porous, buoyant, core–shell hydrogel nanoparticles containing novel high affinity reactive chemical baits for protein and peptide harvesting, concentration, and preservation in body fluids. Poly(N-isopropylacrylamide-co-acrylic acid) nanoparticles were functionalized with amino-containing dyes via zero-length cross-linking amidation reactions. Nanoparticles functionalized in the core with 17 different (12 chemically novel) molecular baits showed preferential high affinities (KD < 10–11 M) for specific low-abundance protein analytes. A poly(N-isopropylacrylamide-co-vinylsulfonic acid) shell was added to the core particles. This shell chemistry selectively prevented unwanted entry of all size peptides derived from albumin without hindering the penetration of non-albumin small proteins and peptides. Proteins and peptides entered the core to be captured with high affinity by baits immobilized in the core. Nanoparticles effectively protected interleukin-6 from enzymatic degradation in sweat and increased the effective detection sensitivity of human growth hormone in human urine using multiple reaction monitoring analysis. Used in whole blood as a one-step, in-solution preprocessing step, the nanoparticles greatly enriched the concentration of low-molecular weight proteins and peptides while excluding albumin and other proteins above 30 kDa; this achieved a 10,000-fold effective amplification of the analyte concentration, enabling mass spectrometry (MS) discovery of candidate biomarkers that were previously undetectable.
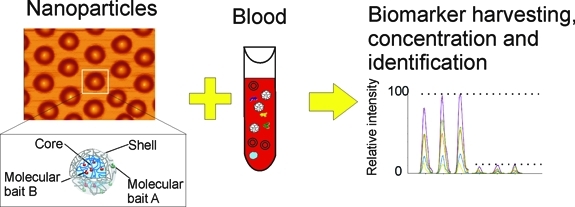
Introduction
A critical need within the biochemical and biomedical research sector is the identification of low-abundance biomarkers that are predictive of early-stage disease or that correlate with therapeutic outcome or toxicity.(1) While the interest in the potential and value of biomarkers has never been greater, the research investment in biomarker discovery and clinical validation has yielded a very poor return to date.1,2 This poor return is due in part to the low abundance of early disease biomarkers that exist at a concentration below the detection limit of biomarker discovery platforms. Protein biomarker discovery and quantitation by mass spectrometry (MS) and multiple reaction monitoring (MRM) are powerful approaches1,2 but are severely limited in their practical application for complex clinical samples because of their low effective sensitivity.(3) The analyte detection sensitivity for MS or MRM applied directly to a complex body fluid is typically greater than 50 ng mL–1.(4) In contrast, the vast majority of diagnostic analytes measured in the clinical laboratory by immunoassay platforms fall in the range between 50 pg mL–1 and 10 ng mL–1.(5)
Thus, the most important protein biomarkers, particularly those derived from early-stage disease,(6) are invisible to conventional MS or MRM.(7) MS and MRM lack practical sensitivity because of technical and physiological constraints. The volume of sample introduced into the MS is very small (<1 μL) containing only a small number of target analyte molecules and thereby limiting the detection sensitivity. In addition, low-abundance, low-molecular weight proteins and peptides are masked by billion-fold excess quantities of resident proteins such as immunoglobulin and albumin. The MS input sample is strictly limited in the maximum total protein (<50 μg) content, a value lower than the serum or plasma protein content in 1 μL, the volume of the input sample for the mass spectrometer. Consequently, increasing the sensitivity is not simply a matter of concentrating the sample because this will overwhelm the total protein capacity introduced into the MS. A further barrier to biomarker discovery is the lability and perishability of candidate biomarkers ex vivo following clinical sample collection. Diagnostic proteins and peptides in body fluids are subject to rapid enzymatic degradation following collection.(8) In the present study we show that modified hydrogel nanoparticles can provide a means to overcome all of these technical and physiological barriers and significantly improve the sensitivity of detection, and the preservation, of candidate biomarkers in a single step.
Hydrogel nanoparticles have been extensively described in the literature as good candidate materials for drug delivery9−12 and in vivo imaging purposes.(13) In contrast to their application as drug delivery vehicles, we have proposed the use of hydrogel nanoparticles for sequestering rather than releasing target molecules.14−19
In this study, open-meshwork core–shell hydrogel nanoparticles were functionalized with combinations of novel organic dye baits. Specific dye chemistries immobilized in the particle core possess extremely high affinity for select classes of proteins and peptides (Figure 1). Unwanted high-molecular weight proteins such as albumin and immunoglobulins are excluded from entering the particles because of the restrictive, effective pore size of the hydrogel that acts as a molecular sieve. Albumin fragments are also an unwanted contaminant present in the blood.(20) To further exclude unwanted contaminating albumin fragments small enough to penetrate the shell, the shell contains a chemical species (vinylsulfonic acid, VSA) that selectively prevents entry of albumin-derived peptides of all sizes (Figure 1), without hindering the capture of non-albumin proteins and peptides small enough to enter the particle.
Figure 1.

(A) Schematic representation of core–shell hydrogel nanoparticles. (B) Porous nature of the hydrogel particle shell has an effective pore size that acts as a molecular sieve with a cutoff determined by the cross-link density. Proteins small enough to enter the particle are captured by the high-affinity bait. The high affinity permits very rapid sequestration of target analytes and dissociation from carrier proteins. The shell contains a chemical species (vinylsulfonic acid, VSA) that selectively prevents entry of contaminating albumin-derived peptides of all sizes without hindering the capture of non-albumin proteins and peptides small enough to enter the particle. (C) Nanoparticles can be produced in large quantities with uniform size distribution (atomic force microscopy image).
Some classes of organic dyes (indocyanine green,(21) Cibacron Blue F3GA,(22) Coomassie Blue,(23) triarylmethane dyes,(24) eosin dyes(25)) have been used in the past as protein binding agents and inhibitors of protein–protein interactions.(26) Cibacron Blue F3GA and related dyes are most extensively studied as ligands in affinity chromatography. A widely accepted mechanism that has been proposed to explain the high-affinity binding of Cibacron Blue F3GA and related dyes to proteins is based on hydrophobic and electrostatic forces.(27) The specificity of the dye–protein interaction depends mainly on hydrophobic interactions, whereas electrostatic forces contribute to the stability of interaction.(27) The dye binding site on the surface of the target protein is a nonpolar pocket surrounded by hydrophilic amino acid residues.(28) Moreover, the protein binding sites are often located in areas overlapping with the binding sites of biological ligands with respect to other parts of the protein surface.(29) Organic reactive dyes can insert aromatic rings into nonpolar hydrophobic pockets of the protein surface, while the flanking portions of the dye and protein molecules can rearrange, depending on energy constraints. Since both active protein sites and dye molecules have limited conformational freedom, some specificity is achieved.(30)
Increasing the size of the dye molecule ring system can enhance the specificity.(28) For example, Cibacron Blue F3GA forms a strong bond with specific classes of enzymes (dehydrogenases and kinases) because the 1-amino-4-(4′-aminophenylamino)-anthraquinone-2,3′-disulfonic acid part of the dye fits well to a structural element of the enzyme called the dinucleotide binding fold.(31) In addition to high specific binding of some classes of proteins, Cibacron Blue F3GA also forms nonspecific complexes with additional proteins. This latter attribute is most likely due to the ability of the dye to act as weak cation exchanger through its sulfonic groups.(28)
Most of the bait dyes used in this work have never been used for affinity chromatography or protein capture in the past and were found to have high affinity for select classes of proteins (see Figure 2). In fact it can be hypothesized, on the basis of the proposed mechanism of binding, that all ionic aromatic compounds, separate from Cibacron Blue F3GA and related dyes, should be capable of binding all classes of proteins and peptides that have a sufficiently large exposed hydrophobic region.(28)
Figure 2.

High-affinity chemical baits covalently incorporated into hydrogel nanoparticle cores or shells. ABB, DB3, PR1, AB48, DY3, AB1, DO3, DY9, R12, TBO, PR, and AB2 have not been previously used for protein affinity chromatography.
Dye-functionalized nanoparticles can be introduced into whole blood at the time of collection (Figure 3). In one step, in solution, and in minutes, the nanoparticle (a) affinities capture all the target analytes in the entire fluid phase (plasma), (b) strip target analytes off of the carrier proteins, (c) protect the captured target protein from degradation, and (d) exclude all size classes of albumin-derived peptides. The buoyant, open-meshwork, spherical nanoporous particles (0.5–0.7 μm diam) remain as a colloid in suspension in the fluid phase and are in open exchange with the surrounding plasma. Target molecules not excluded by the shell freely enter the hydrogel inner meshwork to be captured by the bait(s). The separation process takes advantage of the enormous surface area afforded by the nanoparticles. The open-meshwork hydrogel particles are 95% occupied by the surrounding solution phase and do not have the disadvantages of boundary layers, pressure gradients, and volume requirements of affinity bead columns. Since the nanoparticles do not settle by gravity, the plasma containing the hydrogel particles can be separated from the cellular elements of the blood by low-speed centrifugation (Figure 3).
Figure 3.

One step, in solution affinity capture and separation of low-abundance target biomarkers in whole blood (plasma). Core–shell hydrogel particles are introduced into the Vacutainer collection tube and are allowed to incubate with blood for 15 min. Low-speed centrifugation is used to pellet the blood cells, while buoyant, open-meshwork hydrogel particles remain in suspension in the plasma. High-speed centrifugation is then used to separate the particles from the plasma. Proteins are eluted from the nanoparticle pellet and analyzed by mass spectrometry (MS), multiple reaction monitoring (MRM), or any other analytical platform (e.g., immunoassay).
Experimental Section
Nanoparticle Synthesis and Dye Coupling
Hydrogel nanoparticles, poly(N-isopropylacrylamide-co-acrylic acid) (poly(NIPAm-co-AAc)), were synthesized by precipitation polymerization(32) and covalently functionalized with amino-containing dyes using amidation chemistry.(33) Zero-length cross-linking amidation strategies were performed in water or organic solvents on the basis of the hydrophilic/hydrophobic properties of the dyes. Amine-containing hydrogel nanoparticles, poly(NIPAm-co-AA), were created by precipitation polymerization and covalently functionalized with Cibacron Blue F3GA (CB) dye by nucleophilic substitution of the amine groups in the nanoparticles and a chloride atom in the CB dye. An outer shell containing vinylsulfonic acid (VSA) copolymer was created on the dye-functionalized particles by a second polymerization reaction as described below.
Poly(NIPAm-co-AAc) Nanoparticle Synthesis
N-Isopropylacrylamide (NIPAm, Sigma-Aldrich, 4.750 g, 0.042 mol), N,N′-methylene bisacrylamide (BIS Sigma-Aldrich, 0.400 g, 0.0026 mol), and acrylic acid (AAc, Sigma-Aldrich, 0.525 μL, 0.0073 mol) were dissolved in 500 mL of H2O, filtered using a nitrocellulose membrane disk filter (0.45 μm pore size, Millipore), and transferred in a three-neck round-bottom flask. The solution was purged with nitrogen for 1 h at room temperature, at medium stirring rate, and then heated to 70 °C. Potassium persulfate (KPS, Sigma-Aldrich, 0.276 g, 0.001 mol) was dissolved in 5 mL of H2O and was added to the solution to initiate the polymerization. The reaction was maintained at 70 °C under nitrogen for 6 h. Particles were washed five times by centrifugation (19,000 rpm, 50 min, 25 °C) to eliminate the unreacted monomer and then resuspended in 600 mL of H2O.
Functionalization of Poly(NIPAm-co-AAc) Nanoparticles with Amino Dyes in Water
Dye molecules containing an amine group were coupled by condensation to the carboxylic group of acrylic acid present in the poly(NIPAm-co-AAc) particles. The reaction was conducted in a water-based solvent for the following dyes: Acid Blue 22 (AB2, Sigma), Remazol Brilliant Blue R (RBB, Sigma), Acid Black 1 (AB1, Sigma), Brilliant Blue R250 (BB, Fisher), Toluidine Blue O (TBO, J.T. Baker), Rhodamine 123 (R12, Sigma), Disperse Yellow 3 (DY3, Fluka), and Disperse Blue 3 (DB3, Sigma). A preliminary activation of the carboxylic group present in the nanoparticles was performed. Briefly, 10 mL of the poly(NIPAm-co-AAc) particle suspension was centrifuged (16.1 rcf, 25 C, 15 min), the supernatant was discarded, and the particle pellet was resuspended in 10 mL of 0.2 M NaH2PO4 pH 5. The particle suspension was transferred in a three-neck round flask, and to this were added 1 mL of 1% SDS (w/v), 824 mg of N-(3 dimethylaminopropyl)-N′-ethyl carbodiimide hydrochloride (EDC; Fluka Analitical), and 612 mg of solid N-hydroxy succinimide (NHS; Sigma-Aldrich). The reaction was held at room temperature and medium stirring rate for 15 min. Then, the suspension was centrifuged (19,000 rpm, 50 min, 25 °C), the supernatant was discarded, and the particle pellet was resuspended in 20 mL of 0.2 M Na2HPO4 pH > 8. After this activation step, an appropriate amount of dye (molar ratio of dye/acrylic acid 10:1) was dissolved in 180 mL of 0.2 M Na2HPO4 buffer pH > 8, that was filtered by 0.22 μm CA filter (Corning) and added to the activated particles; the reaction was held at room temperature at medium stirring rate overnight. The number of acrylic acid moles in 10 mL of particle suspension was 0.0000121. In order to eliminate the unreacted dye, poly(NIPAm/dye) particles were washed five times with water by centrifugation (19,000 rpm, 50 min, 25 °C). Supernatants were discarded, and particles were resuspended in 10 mL of water.
Functionalization of Poly(NIPAm-co-AAc) Nanoparticles with Amino-Dyes in Dimethylformamide (DMF)
The amidation reaction was conducted by phosponium/uranium activation in dimethylformamide (DMF) for the following dyes: Disperse Orange 3 (DO3, Sigma), Pararosaniline Base (PR, Sigma), Disperse Yellow 9 (DY9, Sigma), Pigment Red 177 (PR1, International Laboratory U.S.A.), and Acid Black 48 (AB4, Acros Organic). Briefly, 10 mL of poly(NIPAm-co-AAc) nanoparticles (acrylic acid moles = 0.0000121) was freeze-dried and resuspended in 10 mL of DMF (Sigma-Aldrich) in a three-neck round flask. The particle suspension was purged with nitrogen for 15 min at room temperature under medium stirring. Then, 68.84 mg of O-benzotriazole-N,N,N′,N′-tetramethyl-uronium-hexafluorophosphate (HBTU, Peptides International), 24.52 mg of N-hydroxybenzotriazole (HOBT, GL Biochem), and 40 μL of N-methylmorpholine (Nmm; Fluka Biochemika) were added to the particle suspension and reacted at room temperature at medium stirring rate for 5 min under a nitrogen atmosphere. After 5 min, an appropriate amount of dye (molar ratio of dye/AAc = 10:1) dissolved in DMF was added to the three-neck round flask. The reaction was maintained under nitrogen atmosphere for 6 h. Poly(NIPAm/dye) particles were washed five times by centrifugation (19,000 rpm, 50 min, 25 °C) with decreasing concentrations of DMF (90%, 75%, 50%, 25%, and 5%) in water in order to eliminate unreacted dye and to favor particle rehydration. Supernatants were discarded, and the particles were resuspended in 10 mL of water.
Synthesis of Poly(NIPAm-co-VSA) Nanoparticles
NIPAm (0.475 g, 0.0042 mol), BIS (0.040 g, 0.026 mol), and vinyl sulfonic acid (VSA; Sigma-Aldrich, 0.80.4 μL, 0.00073 mol) were dissolved in 60 mL of H2O, filtered using a nitrocellulose membrane disk filter (0.45 μm pore size), and transferred into a three-neck round-bottom flask. The solution was purged with nitrogen for 1 h at room temperature, at medium stir rate, and then heated to 70 °C. KPS (0.028 g, 0.0001 mol) was dissolved in 2.5 mL of H2O and was added to the solution to initiate the polymerization. The reaction was maintained at 70 °C under nitrogen for 6 h. The particles were washed five times in water by centrifugation (19,000 rpm, 50 min, 25 °C) and then resuspended in 60 mL of H2O.
Poly(NIPAm/CB) Core–Poly(NIPAm-co-VSA) Shell Nanoparticle Preparation
Poly(NIPAm-co-Allylamine, AA) particles were prepared as follows. NIPAm (0.89 g, 7.83 mmol) and BIS (0.042 g, 0.27 mmol) were dissolved in 30 mL of water and then passed through a 0.2 μm nylon membrane filter. The solution was purged with nitrogen for 15 min at room temperature with a medium stirring rate. AA (Sigma, 0.051 g, 0.90 mmol) was added; the solution was purged with nitrogen for 15 min and then heated to 70 °C. KPS (0.0070 g, 0.025 mmol) was dissolved in 1.0 mL of water and was added to the solution to initiate the polymerization. The reaction was maintained at 70 °C under nitrogen for 3 h. The reaction was subsequently allowed to cool to room temperature and stirred overnight. Particles were washed five times by centrifugation (19,000 rpm, 50 min, 25 °C) with water in order to eliminate the unreacted monomer and then resuspended in 30 mL of H2O. In order to incorporate Cibacron Blue F3GA (CB) dye, CB (0.76 g, 0.90 mmol) was dissolved in 10 mL of 0.1 M aqueous sodium carbonate. The poly(NIPAm-co-AA) particle suspension (10 mL volume) was purged with nitrogen for 15 min with a medium stirring rate in a three-neck round-bottom flask. Solid sodium carbonate (0.106 g, 1.0 mmol) was added to the suspension. The suspension was then stirred at room temperature under nitrogen for about 1 min. The CB solution was then added to the poly(NIPAm-co-AA) particle suspension, and the combined reaction mixture was then stirred at room temperature under nitrogen for 48 h. The resulting poly(NIPAm/CB) particles were harvested and washed using centrifugation (19,000 rpm, 50 min, 25 °C). In order to build a VSA shell on the poly(NIPAm/CB) core, 20 mL of poly(NIPAm/CB) particle suspension was heated at 70 °C and purged with nitrogen for 1 h. NIPAm (0.156 g, 1.38 mmol), BIS (0.013 g, 0.084 mmol), VSA (26 ul, 0.334 mmol), and KPS (0.092 g, 0.328 mmol) were dissolved in 20 mL of water and passed through a 0.2 μm nylon membrane filter. Three milliliters of this solution was added to the poly(NIPAm/CB) particle suspension, and the remaining 17 mL of solution was added in aliquots of 3 mL every 5 min. Poly(NIPAm/CB) core–poly(NIPAm-co-VSA) shell particles were washed five times in water by centrifugation (19,000 rpm, 50 min, 25 °C).
Nanoparticle Characterization
The temperature dependence of particle size was determined via photon correlation spectroscopy (Submicrometer Particle Size Analyzer, Beckman Coulter). The measurement of particle diameter was performed using water as a diluent (refractive index (RI) = 1.333, diluent viscosity = 0.890 cP). The test angle was 90°. Average values were calculated for three measurements using a 200 s integration time, and the solutions were allowed to thermally equilibrate for 10 min before each set of measurements. Measured values were then converted to particle sizes via the Stokes–Einstein relationship.(34) The particles were further characterized by atomic force microscopy (AFM) using an NSCRIPTOR DPN System (NanoInk). Particles in suspension (1 μg/mL) were deposited on freshly cleaved mica in a humid atmosphere for 15 min and dried under nitrogen before measurement. Images were acquired under AC mode using a silicon tip with a typical resonance frequency of 300 kHz and a radius smaller than 10 nm. Incorporation of dye in the particles was assessed by weighing the dry particles before and after dye coupling.
Nanoparticle Incubation with Serum, Plasma, Blood, and Protein Solutions
Aliquots of 500 μL of serum and EDTA plasma were diluted 1:2 with 50 mM TrisHCl pH 7, mixed with 500 μL of hydrogel particles functionalized with the molecular baits described above, and incubated for 15 min at room temperature. Particles were separated by centrifugation (16.1 rcf, 25 °C, 10 min) and washed with buffers specific for the molecular baits listed in Table 1. The particle pellet was incubated for 15 min at room temperature with 600 μL of elution buffer specific for the molecular baits listed in Table 1 and then centrifuged (16.1 rcf, 25 °C, 10 min). The elution step was repeated twice, and the eluates were combined in the same vial and then dried in a vacuum concentrator.
Table 1. Washing and Elution Buffers for Each Kind of Nanoparticle .
| chemical bait in the particles | washing buffer | elution buffer |
|---|---|---|
| Cibacron Blue F3GA, Remazol Brilliant Blue R | 0.25 M NaSCN Twice | 70% acetonitrile, 10% ammonium hydroxide |
| Disperse Yellow 9, Disperse Yellow 3, Disperse Orange 3, Pararosaniline base, Pigment Red 177, acid black 48, Acid blue 22, Acid black 1; Brilliant Blue R250, Toluidine Blue, Rhodamine 123, Disperse Blue 3, VSA, AAc | 0.5 × PBS and 0.5 × PBS/20% acetonitrile | 1% trifluoroacetic acid, 80% acetonitrile |
Blood was collected in EDTA-containing blood collection tubes (Vacutainer EDTA Tubes, Becton Dickinson). Aliquots of 1 mL of blood were diluted 1:2 with physiologic solution (0.9% NaCl). One milliliter of hydrogel particle suspension was added to the blood and incubated for 15 min. In order to separate the blood cells, the blood–particle mixture was centrifuged (200 rcf, 25 °C, 10 min), and the plasma supernatant was saved. The plasma was then centrifuged at higher speed (16.1 rcf, 25 °C, 10 min), the supernatant was discarded, and the particle pellet was washed and eluted as previously described, using appropriate buffers for each type of particle (Table 1).
Proteins (human growth hormone (Lilly), hepatocyte growth factor (Antigenix America Inc.), fibroblast growth factor 22 (Cell Sciences), vascular endothelial growth factor (Cell Signaling Technologies), eotaxin 2 (AbD Serotec), IGF binding protein 7 (IGFBP7) (Preprotech), interleukin-6 (AbD Serotech), chemokine (C–C motif) ligand 22 (CCL22) (R&D Systems), survivin (Novus Biologicals), B-cell lymphoma 2 (bcl-2) (Fisher Scientific), osteopontin (Novus Biologicals), troponin-I (AbD Serotec), and kallikrein-6 (ARP American Research Products)) were each dissolved in 25 μL of 50 mM TrisHCl pH 7 at a concentration of 0.05 μg/μL, mixed with 25 μL of particle suspension, and incubated for 15 min at room temperature. Particles were separated by centrifugation (16.1 rcf, 25 °C, 10 min), washed with water (16.1 rcf, 25 °C, 10 min), and analyzed by SDS PAGE.
Interleukin-8 (IL8) was dissolved in synthetic sweat (Corkig) at a concentration of 0.05 μg/μL, and the pH of the solution was adjusted to 8 with 1 M NaOH. Trypsin (Promega) was added to the IL8 solution at a 100:1 protein to protease w/w ratio. Poly(NIPAm/DY9) particles were added to the IL8, trypsin-containing solution and the mixture left to incubate for 3 h at 37 °C.
Aliquots of 100 μL of poly(NIPAm-co-VSA) particles were mixed with 2 μg of trypsin-digested human serum albumin (Michrom Bioresources) and allowed to incubate for 30 min. Particles were washed and eluted with the buffers indicated in Table 1. The eluate was dried in a SpeedVac and injected into an LTQ-Orbitrap mass spectrometer (ThermoFisher). Isoelectric points and molecular weights of trypsin-generated peptides derived from albumin were calculated online at http://isoelectric.ovh.org/.
Immunoassay Measurement of Troponin-I
Poly(NIPAm/DB3) and poly(NIPAm/RBB) particles were mixed with a solution of troponin-I (in 50 mM Tris HCl pH 7), incubated for 15 min at room temperature and then were separated by centrifugation (16.1 rcf, 25 °C, 10 min). The concentration of troponin-I was measured using the Immulite 1000 Troponin-I System (Siemens Healthcare Diagnostics). Particle eluates were lyophilized overnight, reconstituted in Immulite Sample Diluent (Siemens Healthcare Diagnostics), and assayed according to the manufacturer’s instructions.
Dissociation Constant Calculation
The dissociation constant between the particles and troponin-I was estimated by solving the ordinary differential equations derived from the dissociation equilibrium reaction of bound versus free analyte using the R software, deSolve package.(35)
LC–MS/MS analysis
Eluates from the particles were analyzed by mass spectrometry. Proteins were dried in a SpeedVac and were reconstituted in 8 M urea, reduced by 10 mM DTT, alkylated by 50 mM iodoacetamide, and digested by trypsin (Promega) at 37 °C overnight. Tryptic peptides were further purified by Zip-Tip (Millipore) and analyzed by reversed-phase liquid chromatography nanospray tandem mass spectrometry (LC–MS/MS) using an LTQ-Orbitrap mass spectrometer (ThermoFisher). After sample injection by autosampler, the C18 column (0.2 mm × 50 mm, Michrom Bioresources, Inc.) was washed for 2 min with mobile phase A (0.1% formic acid), and peptides were eluted using a linear gradient of 0% mobile phase B (0.1% formic acid, 80% acetonitrile) to 50% mobile phase B in 90 min at 500 nL/min, then to 100% mobile phase B for an additional 5 min. The LTQ mass spectrometer was operated in a data-dependent mode in which each full MS scan was followed by five MS/MS scans where the five most abundant molecular ions were dynamically selected for collision-induced dissociation (CID) using a normalized collision energy of 35%. Tandem mass spectra were searched against the NCBI human database with SEQUEST using tryptic cleavage constraints. High-confidence peptide identifications were obtained by applying the following filter criteria to the search results: Xcorr versus charge ≥1.9, 2.2, 3.5 for 1+, 2+, 3+ ions; ΔCn > 0.1; probability of randomized identification ≤0.01.
Multiple Reaction Monitoring (MRM) Analysis
Human urine was centrifuged (10 min, 1000 rpm, 4 °C) in order to remove the cellular debris, and the specific gravity was recorded. Human growth hormone (hGH) was spiked in human urine at a concentration of 50 ng/mL. Aliquots of 1 mL of urine containing hGH were incubated with 500 μL of Remazol Brilliant Blue R particles for 30 min at room temperature. The particles were separated by centrifugation (16.1 rcf, 10 min, 25 °C) and washed with water (16.1 rcf, 10 min, 25 °C). Proteins captured by the particles were eluted with 500 μL of elution buffer (70% acetonitrile, 10% ammonium hydroxide) and dried in a vacuum concentrator. Fifty microliters of urine solution and particle eluate were prepared for MRM analyses by: (1) reduction with 10 mM dithiothreitol in 1 M urea/50 mM ammonium bicarbonate (NH4HCO3) at room temperate for 60 min, (2) alkylation with 50 mM iodoacetamide at room temperature in the dark for 20 min, (3) overnight enzymatic digestion with 0.5 μg of sequencing grade trypsin in 50 mM ammonium bicarbonate, pH 8 at 37 °C. Digestions were quenched with the addition of 2 μL of concentrated trifluoroacetic acid and then dried in a vacuum concentrator. Samples were then reconstituted with 50 μL of 200 μg/mL glucagon (Sigma-Aldrich, St. Louis, MO) in 0.1% formic acid. Sample digests were analyzed with a TSQ Quantum Ultra Triple Quadrupole mass spectrometer (ThermoFisher Scientific). Samples were loaded onto a 1 mm × 150 mm Hypersil Gold 3 μm particle C-18 reversed phase column (Thermofisher Scientific) with an Accela autosampler (Thermofisher Scientific) fitted with a 10 μL sample loop. The LC pump was an Accela (ThermoFisher Scientific) operated at 160 μL/min, and effluent was directed into the mass spectrometer using an IonMax source. After sample injection, the column was washed for 5 min with 98% mobile phase A (0.1% formic acid), and peptides were eluted using a linear gradient of 2% mobile phase B (0.1% formic acid in acetonitrile) to 50% mobile phase B in 20 min. The instrument divert valve was switched to waste before and after the peptides eluted in order to keep the source free of excess salts and debris. Both Q1 and Q3 resolution were set to 0.7 fwhm. Q2 contained 1.5 mTorr of argon.
The scan width was 0.002 m/z, and dwell time was 15 ms. Collision energies (CE) were calculated according to the formula: 0.034 × precursor ion mass m/z + 3.314. Each sample was analyzed in triplicate. Peptide FPTIPLSR (465.77 2+) from hGH, with transitions 392.24, 472.29, 585.37, 686.42, and 783.47 were chosen for MRM analyses on the basis of previous work with tryptic digests of hGH standards. MRM results were loaded into the Pinpoint program, version 1.0 (ThermoFisher Scientific) for data analysis. Data were divided into two groups: (1) nanoparticle-enriched urine sample (triplicate analyses) and (2) non-nanoparticle urine sample (triplicate analyses). Peak width tolerance was 30 s, the alignment error tolerance was 0.5 min, and the minimum signal threshold was 100. The fragment ion peak areas for all transitions were summed and the average areas calculated using the triplicate analyses for the nanoparticle and non-nanoparticle samples.
Results and Discussion
We identified a series of small novel organic dye molecules possessing extremely high protein-binding affinity (KD < 10–11 M, Figure 2). These dyes act as molecular baits by binding proteins and peptides, likely through a combination of hydrophobic and electrostatic forces, by inserting their aromatic rings into hydrophobic pockets present on the protein surfaces.(30)
We immobilized the baits by binding amino groups in the dyes to carboxylic groups in the particles (Figure 4 shows the changes in the hydrodynamic volume after dye functionalization). Zero-length cross-linking amidation strategies were used and optimized on the basis of hydrophilic/hydrophobic dye properties.(33)
Figure 4.

Light-scattering analysis of particles functionalized with different chemical baits. Hydrodynamic diameter (DH) decreased with increases in the temperature of the solution. The temperature–diameter relationship is influenced by the type of dye incorporated.
As shown in Figure 5 when hydrogel nanoparticles containing one of 17 different classes of organic chemistries were screened against a panel of 13 known low-abundance diagnostically relevant biomarker proteins, strong bait selectivity for specific proteins or classes of proteins was noted. For example, hepatocyte growth factor (HGF) was captured by poly(NIPAm/DY3) particles and excluded by poly(NIPAm/DB3) particles (see also Figures 6 and 7).
Figure 5.

Nanoparticles functionalized with 17 different molecular baits (poly(NIPAm/ABB), poly(NIPAm/DB3), poly(NIPAm/RBB), poly(NIPAm/PR1), poly(NIPAm/AB4), poly(NIPAm-co-VSA), poly(NIPAm/DY3), poly(NIPAm/AB1), poly(NIPAm/DO3), poly(NIPAm/DY9), poly(NIPAm/R12), poly(NIPAm/TBO), poly(NIPAm-co-AAc), poly(NIPAm/PR), poly(NIPAm/BB), poly(NIPAm/AB2), poly(NIPAm/CB)) show preferential high affinities for 13 specific low-abundance protein analytes as indicated by the color of the cell. The expected concentrations of the indicated proteins in serum/plasma were derived from the literature.36−48.
Figure 6.

Heat map representation of serum proteins captured by nanoparticles functionalized with different molecular baits (poly(NIPAm/RBB), poly(NIPAm/CB), poly(NIPAm-co-VSA), poly(NIPAm/DY9), poly(NIPAm/DO3), poly(NIPAm/DY3), poly(NIPAm/PR1), poly(NIPAm/AB4), poly(NIPAm/BB), poly(NIPAm-co-AAc), poly(NIPAm/AB1), poly(NIPAm/ABB). Dyes incorporated in the particles are shown on the X axis, proteins identified with MS analysis of serum preprocessed with the particles are shown in the Y axis. Each dye bait is represented by a different color. Example low-abundance proteins uniquely captured by specific dye baits are highlighted.
Figure 7.

Poly(NIPAm/DY9) and poly(NIPAm/DO3) particles capture unique groups of proteins from serum. Addition of two types of hydrogel particles complement each other by combining their respective protein repertoire. Example low-abundance proteins are highlighted in the boxes.
We determined that the affinity of dye–protein binding reactions was dependent on the type of reactive group substitution (Figure 8A). Troponin-I, a biological marker for cardiac muscle tissue injury, is present in the blood at low concentrations (5 pg/mL),(47) below the detection limit of routine mass spectrometry. Remazol brilliant blue R (RBB)-functionalized particles sequestered more than 99.9% of troponin-I present in solution (estimated dissociation constant KD < 1.1 × 10⁻¹¹ M) so that the troponin-I concentration in the supernatant outside the particle at equilibrium (<10 min) was reduced below the detection limit (50 pg/mL) of the Immulite clinical immunoassay. Modification in the chemical group substitution (keeping the bait molecules equimolar) reduced the capture efficiency due to a 10-fold reduction in the KD (2.4 × 10⁻¹⁰ M, Figure 8A).
Figure 8.

(A) Bait chemical structure determines affinity and can capture or exclude select proteins. Poly(NIPAm/DB3) and poly(NIPAm/RBB) nanoparticles were incubated with troponin-I. DB3 and RBB are anthraquinone rings that differ in their side groups. RBB depleted greater than 99.9% (estimated dissociation constant KD < 10–11 M) while DB3 depleted 83% (KD = 10–10 M), at equilibrium (<10 min). (B) Proteins sequestered in the nanoparticles are protected from enzymatic degradation. Interleukin-8 (IL8) diluted in artificial sweat was incubated with excess trypsin at 37 °C in the presence or absence of poly(NIPAm/DY9) particles. SDS PAGE analysis revealed that in the absence of poly(NIPAm/DY9) particles, the IL8 band disappeared, and a fainter band at lower molecular weight appeared, indicating the presence of a degradation product (lane 2). In the presence of poly(NIPAm/DY9) particles, IL8 is fully protected from trypsin degradation (lane 5). Incubation of IL8 with sweat alone at 37 °C caused the intact IL8 band to disappear (lane 3), while poly(NIPAm/DY9) particles yielded a full density band for the intact protein (lane 4), suggesting that IL8 was protected from degradation at 37 °C by the nanoparticles.
The advantage of such high-affinity binding dye chemistries is several fold: (a) high ON/OFF rate ratio (estimated 9.2 × 10¹⁰ M–1 for poly(NIPAm/RBB) nanoparticles and 4.2 × 10⁹ M–1 for poly(NIPAm/DB3)) nanoparticles achieves rapid complete capture of all low-abundance ligands, (b) high-affinity binding can protect captured proteins from degradation(19) (Figure 8B), and (c) targeted low-molecular weight proteins bound to abundant carrier proteins in biological fluid can be competed away by the high-affinity bait and stripped away from the carrier protein.(19)
As shown in Figure 9, when poly(NIPAm/RBB) nanoparticles are introduced into a 1 mL sample containing 50 ng/mL of hGH, all of the hGH (50 ng) is sequestered in the nanoparticles in one step and can be eluted in 50 μL, yielding a 20-fold increase in analyte concentration to meet the MRM limits of sensitivity. A larger starting sample volume will yield a proportionally higher increase in analyte concentration.
Figure 9.

Poly(NIPAm/RB) particles effectively increase the detection sensitivity for MRM analysis of human growth hormone (hGH) spiked in human urine.
Our results suggest that particles containing organic structures, such as vinyl sulfonic acid (VSA), excluded (1) full-length albumin by size sieving and (2) peptides derived from albumin that are below the size cutoff of the effective pore size of the particle by selective repulsion. VSA-containing particles excluded albumin but still retained affinity for wide classes of other proteins and peptides. These findings are consistent with previous literature in which VSA-containing polymers were selectively able to prevent albumin absorption(49) but retained the ability to form complexes with proteins such as trypsin.(50)
Poly(NIPAm-co-VSA) particles completely excluded full-length bovine serum albumin (BSA) while sequestering interleukin-6 from solution (Figure 10A). In a separate experiment, fragment peptides derived from trypsinization of albumin were incubated with poly(NIPAm-co-VSA) particles. Albumin-derived peptides below the size exclusion cutoff for the poly(NIPAm-co-VSA) particles (Figure 5) were consistently excluded by the poly(NIPAm-co-VSA) particles at a variety of pH values (Table 2). These same particles that excluded low-molecular weight albumin fragments continued to sequester a broad variety of non-albumin peptides below the size exclusion cutoff of the poly(NIPAm-co-VSA) particles (Figure 5 and Supporting Information Table 1). The mechanism by which poly(NIPAm-co-VSA) particles repel albumin-derived peptides is not completely known and cannot be explained by simple charge effects. In fact, albumin peptides below their calculated isoelectric point at pH 8 (therefore carrying net positive charges) did not bind to the highly ionized sulfonate groups. Excluded peptides derived from albumin may not display the correct pattern of hydrophobic residues and charge distribution that matches the VSA-functionalized nanoparticle landscape. Exclusion of classes of peptides by specific bait chemistries is a new principle in peptide separation.
Figure 10.

(A) Poly(NIPAm-co-VSA) particles excluded albumin while capturing interleukin 6 (IL6). SDS PAGE analysis shows that all the albumin is left in the supernatant (lane 2) while all the IL6 is captured by the particles (lane 3). For comparison purposes, poly(NIPAm/CB) nonshelled particles are shown. In this case all IL6 was captured (lane 4), but albumin was also detectable in the particles (lane 5) because CB binds to albumin species. (B) The addition of a vinylsulfonic acid (VSA)-functionalized shell to cibacron blue F3GA (CB)-containing particles decreased the number of unwanted albumin peptide hits (upper) while at the same time increased the frequency of MS hits for target proteins (e.g., Apo-CI) (lower) (Supporting Information Table 4). (C) Poly(NIPAm/CB) core–(NIPAm-co-VSA) shell particles greatly enhance the low-molecular weight protein concentration in whole blood (lane 3) while fully excluding high-molecular weight abundant proteins such as albumin and immunoglobulins.
Table 2. Example Peptides Derived from Human Serum Albumin That Were Excluded by Poly(NIPAm-co-VSA) Particles at Different pH Valuesa.
| peptide hits (P/S) |
|||||
|---|---|---|---|---|---|
| peptide | pI | MW | pH 8 | pH 4 | pH 2 |
| K.AEFAEVSK.L | 6.5 | 1121.3 | 0/0 | 0/0 | 0/1 |
| K.AVM*DDFAAFVEK.C | 4.4 | 1653.8 | 0/22 | 6/30 | 0/0 |
| K.AVMDDFAAFVEK.C | 4.4 | 1573.8 | 0/51 | 8/48 | 0/0 |
| K.DLGEENFK.A | 4.4 | 1150.2 | 0/0 | 0/3 | 0/2 |
| K.FQNALLVR.Y | 10.4 | 1251.4 | 0/71 | 22/105 | 18/68 |
| K.KLVAASQAALGL.- | 10.8 | 1269.5 | 0/18 | 0/0 | 1/12 |
| K.KQTALVELVK.H | 10.5 | 1393.6 | 0/31 | 6/15 | 4/14 |
| K.KYLYEIAR.R | 10.4 | 1339.6 | 0/26 | 0/4 | 1/9 |
| K.LDELRDEGK.A | 4.5 | 1273.4 | 0/1 | 0/14 | 0/10 |
| K.LVAASQAALGL.- | 9.7 | 1141.3 | 0/76 | 12/120 | 10/66 |
| K.PLVEEPQNLIK.Q | 6.5 | 1535.8 | 0/4 | 0/3 | 0/1 |
| K.SLHTLFGDK.L | 9.5 | 1258.4 | 0/6 | 0/5 | 0/0 |
| K.VPQVSTPTLVEVSR.N | 9.7 | 1754.0 | 0/42 | 7/11 | 6/13 |
| K.YLYEIAR.R | 10.0 | 1211.4 | 0/1 | 15/11 | 11/32 |
| R.FKDLGEENFK.A | 6.6 | 1453.6 | 0/126 | 10/26 | 20/22 |
| R.HPDYSVVLLLR.L | 9.3 | 1580.6 | 0/0 | 2/1 | 0/2 |
| R.RPCFSALEVDETYVPK.E | 4.6 | 2139.4 | 0/0 | 0/2 | 0/0 |
Albumin was trypsin digested before particle incubation. Poly(NIPAm-co-VSA) particles excluded all albumin tryptic peptides at pH 8. P = particle content, S = supernatant.
In order to maximize the performance of the particles, we added a shell containing VSA to poly(NIPAm/CB) core particles. CB is known to bind albumin and albumin peptides (along with a broad number of other proteins) with high affinity. We performed MS analysis of poly(NIPAm/CB) core–poly(NIPAm-co-VSA) shell particle purified plasma. Albumin peptide hits present in the particle eluate dramatically decreased if the CB bait in the core was separated from the plasma by the VSA shell (Figure 10B). Since the molecular weight cutoff of the particles is 30 kDa (Figure 10C) and albumin fragments are normally present in the blood,(20) albumin species excluded by the particles are not only full-length molecules but also albumin fragments below 30 kDa.
Thus, in one step, undesired albumin species are excluded. The addition of the VSA shell did not hinder the capture of other target analytes (e.g., Apo CI, Figure 10B). Poly(NIPAm/CB) core–poly(NIPAm-co-VSA) shell particles allowed for the sequencing of low-abundance, low-molecular weight plasma proteins (Table 3) that were not identified without the dual function nanoparticles. An example of 200 proteins that were captured by poly(NIPAm/CB) core–poly(NIPAm-co-VSA) shell particles is shown in Supporting Information Table 3. Since the molecular weight cutoff of poly(NIPAm/CB) core–poly(NIPAm-co-VSA) shell particles is 30 kDa we can state that 65% of captured proteins was represented in serum as fragments of the parent molecule.(51)
Table 3. Example Candidate Proteins Identified by LC–MS/MS LTQ Orbitrap Analysis for Samples Preprocessed with Poly(NIPAm/CB) Core–Poly(NIPAm-co-VSA) Shell Nanoparticles That Were Not Present in Samples Preprocessed with Poly(NIPAm/CB) Unshelled Nanoparticles or Poly(NIPAm-co-VSA) Unshelled Particlesa.
| accession | protein | blood concentration [pg/mL] and ref |
|---|---|---|
| 38455402 | lipocalin 2 (oncogene 24p3) [Homo sapiens] | 50(54) |
| 27765091 | ST6 β-galactosamide α-2,6-sialyltranferase 1 isoform a [Homo sapiens] | 15,000(55) |
| 148664205 | endothelial cell adhesion molecule [Homo sapiens] | 30,000(56) |
| 4759074 | small inducible cytokine A16 precursor [Homo sapiens] | 30,000(57) |
| 4502101 | annexin I [Homo sapiens] | 50,000(58) |
| 163659899 | insulin-like growth factor 1 (somatomedin C) | 100,000(59) |
| 11321593 | insulin-like growth factor binding protein 6 | 150,000(59) |
| 62243290 | insulin-like growth factor binding protein 4 | 400,000(60) |
| 10834982 | insulin-like growth factor binding protein 5 | 400,00060,61 |
| 144953895 | nidogen 2 precursor [Homo sapiens] | 12,000,000(61) |
| 49574514 | matrix Gla protein [Homo sapiens] | 90,000,000(62) |
| 33186925 | AMP-activated protein kinase γ-2 subunit isoform a [Homo sapiens | U |
| 157168362 | nucleoside phosphorylase [Homo sapiens] | U |
| 4507475 | transglutaminase 1 [Homo sapiens] | U |
| 4502693 | CD9 molecule [Homo sapiens] | U |
| 48375180 | CD36 antigen [Homo sapiens] | U |
| 9257257 | WD repeat domain 1 [Homo sapiens] | U |
| 222080092 | WD repeat domain 91 [Homo sapiens] | U |
| 40254462 | guanine nucleotide binding protein (G protein), q polypeptide [Homo sapiens] | U |
U = unknown. The presence of the VSA shell greatly increases the number and dynamic range of proteins sequestered for discovery.
We investigated the power and extent of protein and peptide enrichment for low-molecular weight, low-abundance proteins in a pool of healthy donor sera or plasma. We compared the peptides identified by LC–MS/MS with and without a one-step processing through poly(NIPAm/CB) core–poly(NIPAm-co-VSA) shell particles.
A large number of diagnostic low-molecular weight proteins and peptides whose concentration in blood is less than 10 ng/mL were identified by MS after poly(NIPAm/CB) core–poly(NIPAm-co-VSA) shell nanoparticle harvesting. Moreover, an additional set of peptides belonging to low-abundance proteins were identified that were not previously found by MS analysis in whole blood, serum, or EDTA plasma, nor included in the PeptideAtlas database, the most comprehensive high confidence collection of MS identified proteins52,53 (Supporting Information Figures 1 and 2 and Tables 1 and 2). Compared to the samples processed without nanoparticle harvesting, the ability of the nanoparticles to concentrate the low-abundance peptidome from whole blood was evident by SDS PAGE analysis (Figure 10C).
Proteins whose molecular weight was lower than 30 kDa were captured by the particles. Thus, the nanoparticle technology described herein can be used for biomarker discovery in whole blood as a single preprocessing step. The nanoparticles will remain in the plasma following low-speed centrifugation to remove the cellular content (Figure 3). In the future it will be important to evaluate the effect of potential interfering substances present in whole blood and plasma such as lipemia, bilirubinemia, and hemolysis.
Harvesting hydrogel nanoparticles possess important features, as we have demonstrated in previous studies using poly(NIPAm-co-AAc) and poly(NIPAm/CB): (a) use of the nanoparticles amplifies the effective sensitivity (by concentrating the sample analyte into a smaller volume and excluding unwanted contaminants) while maintaining the linearity of quantitative immunoassays;(16) (b) nanoparticle preprocessing generated high yields and high precision when applied to clinical grade biomarker studies;(17) (c) if a quantitative immunoassay is previously established, nanoparticle preprocessing is highly suitable for verification and validation of MS-identified candidate biomarkers.(18)
The new type of hydrogel core–shell nanoparticles (poly(NIPAm/CB) core–poly(NIPAm-co-VSA) shell particles) described herein achieved a 10,000 fold effective amplification of the low-abundance, low-molecular weight proteins and peptides that could be identified by MS as demonstrated by examples of more than 200 low-abundance proteins (Supporting Information Table 3; Figure 11). The result was the identification of a large series of novel candidate proteins not previously identified with mass spectrometry analysis in human serum (Table 3, Supporting Information Tables 1 and 2 and Figure 1). While these candidate protein spectra have been manually validated (Supporting Information Figure 2) and high stringency MS cutoff filters have been applied (Experimental Section), a limitation of the current study is that completely new antibodies and quantitative immunoassays will have to be developed to independently verify these proteins by immunochemical methods in serum.
Figure 11.

Poly(NIPAm/CB) core–poly(NIPAm-co-VSA) shell nanoparticles increase the sensitivity of LC–MS/MS analysis by 4 orders of magnitude as demonstrated by examples of more than 200 low-abundance proteins specified in Supporting Information Table 3. Conventional MS/MS analysis (90 min linear gradient at 500 nL/min, data-dependent mode, Xcorr versus charge ≥1.9, 2.2, 3.5 for 1+, 2+, 3+ ions; ΔCn > 0.1; probability of randomized identification ≤0.01) was used to compare the same serum set before and after nanoparticle processing. The ultimate sensitivity of the analysis depends on the starting sensitivity of the system.
Conclusions
High buoyancy, polymer open-meshwork, core–shell hydrogel nanoparticles covalently functionalized with combinations of novel organic dye baits offer a one-step technology for biomarker harvesting, concentration, and stabilization, with simultaneous exclusion of unwanted abundant molecules. The nanoparticles exhibit three physicochemical properties: (1) specific novel dye chemistries immobilized in the particle core possess extremely high affinity for select classes of proteins and peptides; (2) a chemical species present in the shell, VSA, selectively excludes fragments and peptides derived from albumin, and (3) the outer shell of the particle performs physical size sieving, excluding large unwanted abundant molecules such as immunoglobulins. Dual-function hydrogel nanoparticles can dramatically magnify small protein and peptide identification and measurement from complex biological solutions, using any current or future analytical platform, while stabilizing the analytes against degradation. The fluid samples used in the present sample were blood, urine, and sweat. The technology is applicable to any biologic solution-phase sample. We are currently incorporating nanoparticles into a skin patch that continuously harvests, concentrates, and preserves analytes present in the skin transudate for proteomic analysis. Bait-loaded core–shell nanoparticles are being used for biomarker discovery in lymph, saliva, and cerebrospinal fluid.
Acknowledgments
This work was supported partially by (1) George Mason University, (2) the Italian Istituto Superiore di Sanita’ in the framework of the Italy/USA cooperation agreement between the U.S. Department of Health and Human Services, George Mason University, and the Italian Ministry of Public Health, (3) NIH, NCI Grant 1R21CA137706-01 to L.A.L., (4) Grant 1R21AR061075-01 to L.A.L. from NIAMS/NIH. The funding organizations did not have any role in data collection and analysis, decision to publish, or preparation of the manuscript. We are grateful to David Houston for knowledgeable insights about dye chemistries and to Dr. Francesco Facchiano for fruitful discussions on mass spectrometry-based proteomics.
Supporting Information Available
Experimental details including mass spectrometry analysis of serum, EDTA plasma, and whole blood preprocessed with the nanoparticles and complete refs (17) and (53). This material is available free of charge via the Internet at http://pubs.acs.org.
Funding Statement
National Institutes of Health, United States
Supplementary Material
References
- Aebersold R.; Mann M. Nature 2003, 422, 198. [DOI] [PubMed] [Google Scholar]
- Poste G. Nature 2011, 469, 156. [DOI] [PubMed] [Google Scholar]
- Gerszten R. E.; Accurso F.; Bernard G. R.; Caprioli R. M.; Klee E. W.; Klee G. G.; Kullo I.; Laguna T. A.; Roth F. P.; Sabatine M.; Srinivas P.; Wang T. J.; Ware L. B. Am. J. Physiol. Lung Cell Mol. Physiol. 2008, 295, L16. [DOI] [PMC free article] [PubMed] [Google Scholar]
- Kuhn E.; Addona T.; Keshishian H.; Burgess M.; Mani D. R.; Lee R. T.; Sabatine M. S.; Gerszten R. E.; Carr S. A. Clin. Chem. 2009, 55, 1108. [DOI] [PMC free article] [PubMed] [Google Scholar]
- Anderson N. L.; Anderson N. G. Mol. Cell. Proteomics 2002, 1, 845. [DOI] [PubMed] [Google Scholar]
- Lutz A. M.; Willmann J. K.; Cochran F. V.; Ray P.; Gambhir S. S. PLoS Med. 2008, 5, e170. [DOI] [PMC free article] [PubMed] [Google Scholar]
- Pan S.; Aebersold R.; Chen R.; Rush J.; Goodlett D. R.; McIntosh M. W.; Zhang J.; Brentnall T. A. J. Proteome Res. 2009, 8, 787. [DOI] [PMC free article] [PubMed] [Google Scholar]
- Marshall J.; Kupchak P.; Zhu W.; Yantha J.; Vrees T.; Furesz S.; Jacks K.; Smith C.; Kireeva I.; Zhang R.; Takahashi M.; Stanton E.; Jackowski G. J. Proteome Res. 2003, 2, 361. [DOI] [PubMed] [Google Scholar]
- Lv S.; Liu L.; Yang W. Langmuir 2010, 26, 2076. [DOI] [PubMed] [Google Scholar]
- Lemieux P.; Vinogradov S. V.; Gebhart C. L.; Guérin N.; Paradis G.; Nguyen H. K.; Ochietti B.; Suzdaltseva Y. G.; Bartakova E. V.; Bronich T. K.; St-Pierre Y.; Alakhov V. Y.; Kabanov A. V. J. Drug Target 2000, 8, 91. [DOI] [PubMed] [Google Scholar]
- Hu Y.; Atukorale P. U.; Lu J. J.; Moon J. J.; Um S. H.; Cho E. C.; Wang Y.; Chen J.; Irvine D. J. Biomacromolecules 2009, 10, 756. [DOI] [PMC free article] [PubMed] [Google Scholar]
- Petros R. A.; DeSimone J. M. Nat. Rev. Drug Discovery 2010, 9, 615. [DOI] [PubMed] [Google Scholar]
- Choudhury R. P.; Fuster V.; Fayad Z. A. Nat. Rev. Drug Discovery 2004, 3, 913. [DOI] [PubMed] [Google Scholar]
- Luchini A.; Fredolini C.; Espina B. H.; Meani F.; Reeder A.; Rucker S.; Petricoin E. F.; Liotta L. A. Curr. Mol. Med. 2010, 10, 133. [DOI] [PMC free article] [PubMed] [Google Scholar]
- Douglas T. A.; Tamburro D.; Fredolini C.; Espina B. H.; Lepene B. S.; Ilag L.; Espina V.; Petricoin E. F.; Liotta L. A.; Luchini A. Biomaterials 2011, 32, 1157. [DOI] [PMC free article] [PubMed] [Google Scholar]
- Fredolini C.; Tamburro D.; Gambara G.; Lepene B. S.; Espina V.; Petricoin E. F. III; Liotta L. A.; Luchini A. Drug Test. Anal. 2009, 1, 447. [DOI] [PMC free article] [PubMed] [Google Scholar]
- Fredolini C.; et al. AAPS J 2010, 12, 504. [DOI] [PMC free article] [PubMed] [Google Scholar]
- Longo C.; Patanarut A.; George T.; Bishop B.; Zhou W.; Fredolini C.; Ross M. M.; Espina V.; Pellacani G.; Petricoin E. F.; Liotta L. A.; Luchini A. PLoS One 2009, 4, e4763. [DOI] [PMC free article] [PubMed] [Google Scholar]
- Luchini A.; Geho D. H.; Bishop B.; Tran D.; Xia C.; Dufour R. L.; Jones C. D.; Espina V.; Patanarut A.; Zhou W.; Ross M. M.; Tessitore A.; Petricoin E. F.; Liotta L. A. Nano Lett. 2008, 8, 350. [DOI] [PMC free article] [PubMed] [Google Scholar]
- Donadio E.; Piccolomini F.; Dimuccio V.; Felicioli A.; Balestreri E.; Cianti R.; Armini A.; Bini L.; Felicioli R.; Donadio C. Clin. Chem. Lab. Med. 2009, 47, 1373. [DOI] [PubMed] [Google Scholar]
- Kamisaka K.; Yatsuji Y.; Yamada H.; Kameda H. Clin. Chim. Acta 1974, 53, 255. [DOI] [PubMed] [Google Scholar]
- Thompson S. T.; Stellwagen E. Proc. Natl. Acad. Sci. U.S.A. 1976, 73, 361. [DOI] [PMC free article] [PubMed] [Google Scholar]
- Candiano G.; Bruschi M.; Musante L.; Santucci L.; Ghiggeri G. M.; Carnemolla B.; Orecchia P.; Zardi L.; Righetti P. G. Electrophoresis 2004, 25, 1327. [DOI] [PubMed] [Google Scholar]
- Baptista M. S.; Indig G. L. J. Phys. Chem. B 1998, 102, 4678. [Google Scholar]
- Waheed A. A.; Rao K. S.; Gupta P. D. Anal. Biochem. 2000, 287, 73. [DOI] [PubMed] [Google Scholar]
- Buchwald P.; Margolles-Clark E.; Kenyon N. S.; Ricordi C. J. Mol. Recognit. 2010, 23, 65. [DOI] [PubMed] [Google Scholar]
- Gianazza E.; Arnaud P. Biochem. J. 1982, 203, 637. [DOI] [PMC free article] [PubMed] [Google Scholar]
- Kopperschläger G.; Böhme H.-J.; Hofmann E. In Chromatography; Fiechter A., Ed.; Springer: Berlin/Heidelberg: 1982; Vol. 25, p 101. [Google Scholar]
- Glazer A. N. Proc. Natl. Acad. Sci. U.S.A. 1970, 65, 1057. [DOI] [PMC free article] [PubMed] [Google Scholar]
- Edwards R. A.; Woody R. W. Biochemistry 1979, 18, 5197. [DOI] [PubMed] [Google Scholar]
- Apps D. K.; Gleed C. D. Biochem. J. 1976, 159, 441. [DOI] [PMC free article] [PubMed] [Google Scholar]
- Jones C. D.; Lyon L. A. Macromolecules 2000, 33, 8301. [Google Scholar]
- Hermanson G. T.Bioconjugate Techniques, 2nd ed.; Academic Press: London, 2008; Chapter 1, p 176. [Google Scholar]
- Pecora R.Dynamic Light Scattering: Applications of Photon Correlation Spectroscopy; Springer: New York, 1985. [Google Scholar]
- Soetaert K.; Petzoldt T.; Setzer R. J. Stat. Software 2010, 33, 1. [Google Scholar]
- Jubiz W.; Canterbury J. M.; Reiss E.; Tyler F. H. J. Clin. Invest. 1972, 51, 2040. [DOI] [PMC free article] [PubMed] [Google Scholar]
- Seidel C.; Borset M.; Turesson I.; Abildgaard N.; Sundan A.; Waage A. Blood 1998, 91, 806. [PubMed] [Google Scholar]
- Salven P.; Teerenhovi L.; Joensuu H. Blood 1997, 90, 3167. [PubMed] [Google Scholar]
- Salven P.; Teerenhovi L.; Joensuu H. Blood 1999, 94, 3334. [PubMed] [Google Scholar]
- Jahnz-Rozyk K.; Targowski T.; Paluchowska E.; Owczarek W.; Kucharczyk A. Allergy 2005, 60, 685. [DOI] [PubMed] [Google Scholar]
- Kutsukake M.; Ishihara R.; Momose K.; Isaka K.; Itokazu O.; Higuma C.; Matsutani T.; Matsuda A.; Sasajima K.; Hara T.; Tamura K. Reprod. Biol. Endocrinol. 2008, 6, 54. [DOI] [PMC free article] [PubMed] [Google Scholar]
- Shehata H. H.; Abou Ghalia A. H.; Elsayed E. K.; Ziko O. O.; Mohamed S. S. Clin. Biochem. 2009, 43, 362. [DOI] [PubMed] [Google Scholar]
- Osman H.; Gabr O.; Lotfy S.; Gabr S. Indian J. Med. Microbiol. 2007, 25, 323. [DOI] [PubMed] [Google Scholar]
- Santin A. D.; Diamandis E. P.; Bellone S.; Soosaipillai A.; Cane S.; Palmieri M.; Burnett A.; Roman J. J.; Pecorelli S. Clin. Cancer Res. 2005, 11, 3320. [DOI] [PubMed] [Google Scholar]
- Fernandez-Real J. M.; Vayreda M.; Richart C.; Gutierrez C.; Broch M.; Vendrell J.; Ricart W. J. Clin. Endocrinol. Metab. 2001, 86, 1154. [DOI] [PubMed] [Google Scholar]
- Nakazato J.; Kishida M.; Kuroiwa R.; Fujiwara J.; Shimoda M.; Shinomiya N. Pediatr. Allergy Immunol. 2008, 19, 605. [DOI] [PubMed] [Google Scholar]
- Missov E.; Calzolari C.; Pau B. Circulation 1997, 96, 2953. [DOI] [PubMed] [Google Scholar]
- Wong C. K.; Lit L. C.; Tam L. S.; Li E. K.; Lam C. W. Rheumatology (Oxford) 2005, 44, 602. [DOI] [PubMed] [Google Scholar]
- Lee J. H.; Oh S. H. J. Biomed. Mater. Res. 2002, 60, 44. [DOI] [PubMed] [Google Scholar]
- Braia M.; Porfiri M. C.; Farruggia B.; Picó G.; Romanini D. J. Chromatogr. B 2008, 873, 139. [DOI] [PubMed] [Google Scholar]
- Liotta L.; Espina V.; Fredolini C.; Zhou W.; Petricoin E. I.. Clinical Proteomics and Molecular Pathology; Academic Press: Oxford, UK, 2009. [Google Scholar]
- Farrah T.; Deutsch E. W.; Omenn G. S.; Campbell D. S.; Sun Z.; Bletz J. A.; Mallick P.; Katz J. E.; Malmström J.; Ossola R.; Watts J. D.; Lin B.; Zhang H.; Moritz R. L.; Aebersold R. Mol. Cell. Proteomics 2011, 10, M110.006353. [DOI] [PMC free article] [PubMed] [Google Scholar]
- Omenn G. S.; et al. Proteomics 2005, 5, 3226. [DOI] [PubMed] [Google Scholar]
- Choi K. M.; Lee J. S.; Kim E. J.; Baik S. H.; Seo H. S.; Choi D. S.; Oh D. J.; Park C. G. Eur. J. Endocrinol. 2008, 158, 203. [DOI] [PubMed] [Google Scholar]
- Kitazume S.; Oka R.; Ogawa K.; Futakawa S.; Hagiwara Y.; Takikawa H.; Kato M.; Kasahara A.; Miyoshi E.; Taniguchi N.; Hashimoto Y. Glycobiology 2009, 19, 479. [DOI] [PubMed] [Google Scholar]
- Rohatgi A.; Owens A. W.; Khera A.; Ayers C. R.; Banks K.; Das S. R.; Berry J. D.; McGuire D. K.; de Lemos J. A. Arterioscler., Thromb., Vasc. Biol. 2009, 29, 1684. [DOI] [PMC free article] [PubMed] [Google Scholar]
- Nomiyama H.; Hieshima K.; Nakayama T.; Sakaguchi T.; Fujisawa R.; Tanase S.; Nishiura H.; Matsuno K.; Takamori H.; Tabira Y.; Yamamoto T.; Miura R.; Yoshie O. Int. Immunol. 2001, 13, 1021. [DOI] [PubMed] [Google Scholar]
- Goulding N. J.; Guyre P. M. Biochem. Biophys. Res. Commun. 1993, 192, 351. [DOI] [PubMed] [Google Scholar]
- Kythreotis P.; Kokkini A.; Avgeropoulou S.; Hadjioannou A.; Anastasakou E.; Rasidakis A.; Bakakos P. BMC Pulm. Med. 2009, 9, 11. [DOI] [PMC free article] [PubMed] [Google Scholar]
- Ehrnborg C.; Ohlsson C.; Mohan S.; Bengtsson B. A.; Rosen T. Growth Horm. IGF Res. 2007, 17, 234. [DOI] [PubMed] [Google Scholar]
- Kuk C.; Gunawardana C. G.; Soosaipillai A.; Kobayashi H.; Li L.; Zheng Y.; Diamandis E. P. Clin. Biochem. 2010, 43, 355. [DOI] [PMC free article] [PubMed] [Google Scholar]
- Gheduzzi D.; Boraldi F.; Annovi G.; DeVincenzi C. P.; Schurgers L. J.; Vermeer C.; Quaglino D.; Ronchetti I. P. Lab. Invest. 2007, 87, 998. [DOI] [PubMed] [Google Scholar]
Associated Data
This section collects any data citations, data availability statements, or supplementary materials included in this article.