Abstract
We utilize 100 fs optical pulses to induce ultrafast disorder of 35- to 150-nm thick single Au(111) crystals and observe the subsequent structural evolution using 0.6-ps, 8.04-keV X-ray pulses. Monitoring the picosecond time-dependent modulation of the X-ray diffraction intensity, width, and shift, we have measured directly electron/phonon coupling, phonon/lattice interaction, and a histogram of the lattice disorder evolution, such as lattice breath due to a pressure wave propagating at sonic velocity, lattice melting, and recrystallization, including mosaic formation. Results of theoretical simulations agree and support the experimental data of the lattice/liquid phase transition process. These time-resolved X-ray diffraction data provide a detailed description of all the significant processes induced by ultrafast laser pulses impinging on thin metallic single crystals.
Keywords: ultrafast X-ray diffraction, laser-induced phase transition, coherent phonon, annealing, grain growth
Lattice disorder and phase transition in metal, semiconductor, and alloy are of vital importance in both fundamental science and technology. Irradiation with femtosecond laser pulses induces lattice disorder (1), which could be (i) a purely electronic nonthermal order-disorder process by injecting carriers into bulk semiconductor crystals, such as Si (2, 3) and GaAs (4, 5) within 1 ps; (ii) a purely thermal-disorder thermal process that depends on electron/phonon, phonon/phonon, and phonon/lattice interaction time in metal films, especially in noble metals, such as Au (6, 7); (iii) a combination of thermal- and nonthermal-disorder with the ratio depending on the laser fluence (8). When the laser fluence is sufficient, the phase transition from solid to liquid will occur and the melting process is considered to involve both thermal and nonthermal processes, whereas in gold (9–11) and aluminum films, which is the dominant process is still under debate (12–14). The laser heating and melting of the gold film studies presented in this paper were induced by low excitation levels, therefore the electronic effects on the stability of the lattice are not expected to occur (15), which is in contrast to the high excitation levels used for electronic hardening in gold (10).
In this paper, we describe experiments that utilize subpicosecond time-resolved X-ray diffraction (XRD) to measure directly the transient changes in the crystal structure induced by 400-nm, 100-fs laser pulses impinging upon the surface of 35-, 70-, and 150-nm-thick Au(111) single-crystal films. The experiments presented here may be assigned to a weak excitation region, at fluence lower than 15 mJ/cm2, where the blast wave and coherent phonons were observed, and a strong excitation region, at fluencies of 37 mJ/cm2 and above, where melting occurs. In addition, a pressure blast wave, formed immediately upon excitation, induced lattice contraction (16) that propagated through the bulk of the crystal at sonic velocity, generating stress and the well-known sonic wave. We will show that, in gold films much thicker than the optical penetration of the laser pulse, periodic damped expansion and contraction of the lattice are induced after laser irradiation, and this periodic oscillation rate is determined by the thickness of the crystal and the propagation velocity of the force waves. Melting of Au(111) crystal is observed by a sudden steep decrease in the diffraction intensity, followed by grain formation with an Arrhenius expression-type increase in the XRD rocking curve intensity and subsequent mosaic block crystal formation evidenced by an increase in the integrated diffraction intensity above the original single-crystal intensity, until it cools and anneals to the intensity of the original crystal. Theoretical simulations presented support the melting and annealing experimental results.
Results and Discussion
The disorder of the crystal after UV irradiation is detected by changes in the XRD rocking curve including peak shift, broadening, peak diffraction intensity, and total diffraction intensity changes. We measured both uniform and nonuniform strain in the direction of the X-ray reflection, induced by either thermal or electronic forces: (i) If a uniform compressive strain is applied to the crystal, the lattice spacing between reflecting planes becomes smaller than the original equilibrium spacing d0; therefore, the corresponding diffraction line shifts to bigger angles, but does not change the line width or the diffraction intensity. (ii) If the lattice is bent by the one-dimensional model and the strain is nonuniform, on the tension side the plane spacing is larger than d0, on the compression side is smaller than d0, and in some place is equal to d0. Therefore, it is expected that the diffraction line will be broader and the peak diffraction intensity will decrease, if the whole crystal is monitored by XRD. However, it is noted that, although the whole crystal is in a disorder state, the lattice structure remains periodic in a small region, therefore the total diffraction intensity does not decrease more than 5%, although the peak diffraction intensity drops dramatically. (iii) The Debye–Waller factor is a reflection of both uniform and nonuniform strain. Increasing the crystal temperature will result in an increase in thermal motion of the atoms, therefore the unit cells will expand and the plane spacing changes may be estimated by the thermal expansion coefficient. At the same time, slight increase in the line width and gradual decrease in the intensity of the diffraction peaks would be expected. (iv) Melting—the diffraction curves observed are sharp and intense right up to the melting point. Under thermal or electronic melting, the local periodicity of the lattice collapses and therefore the diffraction intensity drops dramatically and approaches zero (13).
Low Laser Fluence: Periodic Expansion and Contraction.
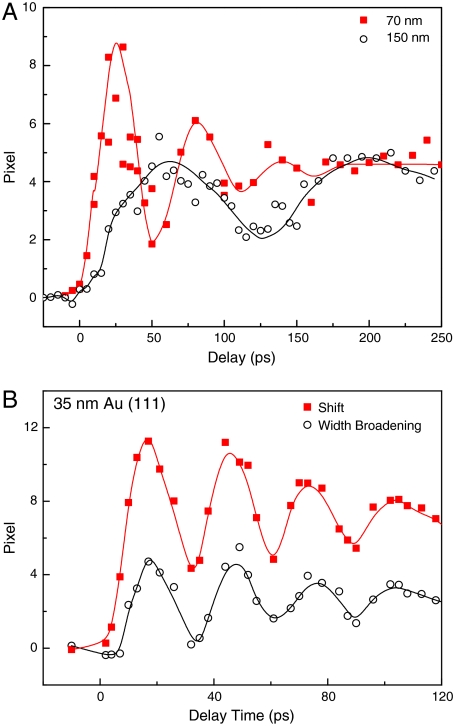
Coherent phonons could be excited and induce lattice vibrations (17) during the propagation of the acoustic wave and blast wave, which result in lattice expansion and contraction. The lattice vibrations induced by the propagation of the acoustic wave have been experimentally observed recently by electron diffraction from 20-nm-thin Al film (the optical length is 8 nm) (18, 19); tentative theoretical studies based on the two-temperature model (TTM) and the Fermi-Pasta-Ulam anharmonic chain model have been used to explain the experimental coherent lattice vibration (20, 21). Damping of coherent acoustic oscillations in a femtosecond laser-heated 400-nm crystalline germanium film (the optical length is around 200 nm) has been measured by time-resolved XRD (22). In both cases, with the sample thickness comparable to the optical absorption depth, the overall effect of the acoustic wave is the expansion of the lattice. In a recent report (23), the oscillation of the lattice changes are applied to disentangle electronic and thermal pressure contributions to femtosecond laser-induced lattice expansion in 90-nm gold single-crystal. In this study, we have observed similar lattice breath in gold crystal with thickness of 2–8 times the optical skin depth (16.9 nm), which is represented as the shift of the rocking curve shown in Fig. 1. It has been shown previously that, for gold thin crystal, the maximum shift of the rocking curve depends linearly on the irradiation fluence (16). However, for the same thickness, the laser fluence does not affect significantly the period of the coherent phonon oscillation. It is also clearly shown in Fig. 1B that the shift and the broadening of the rocking curve follow a similar periodic trend. The periods T could be calculated by the longitudinal velocity of the acoustic wave in solid gold (vl(s) = 3,050 m s-1) (7) and the thickness L of each crystal by T = 2L/vl, with the unexcited mica substrate as the energy damped sink. It is noted that, in the recent report, the longitudinal velocity in gold is taken as vl(s) = 3,690 m s-1 for Au(111) plane (23). Therefore, for 35-, 70-, and 150-nm gold single crystals, the periods of the coherent lattice vibration are estimated to be 23, 46, and 98 ps, respectively, which is slightly shorter than the period measured experimentally because of the damping of the coherent acoustic oscillations (Fig. 1). The time needed to reach the maximum expansion has been measured to be longer than half of the damped oscillation period. For example, for 70-nm Au(111) crystal, the shift of the lattice takes approximately 27 ps to climb the peak and approximately 23 ps to drop to the valley. This difference is due to the onset of the expansion of the lattice, which has been observed in Ge to be a fluence-dependent delay and become shorter at higher excitation levels, where the delay onset was explained by delayed heating times aroused from nonradiative Auger recombination (22). However, in the case of gold, we interpreted the delay of the onset by the combination of the influence of both blast wave and acoustic wave, which have the same sonic velocity but different phase. The blast wave, as a compressive wave, acts on the crystal before the acoustic wave, which behaves as contraction initially (16), then as expansion due to the launch of the larger amplitude acoustic wave. The influence of the blast wave is small compared to the acoustic wave, and therefore it is easy to be masked and taken as the onset of the expansion.
Fig. 1.
(A) Rocking curve shift of 70- (▪) and 150-nm (○) Au(111) crystal as a function of delay time, at laser fluences of 7.9 and 2.6 mJ/cm2, respectively. (B) The shift (▪) and width broadening (○) of 35-nm Au(111) crystal at a laser fluence of 12.1 mJ/cm2, as a function of delay time.
Melting and Annealing.
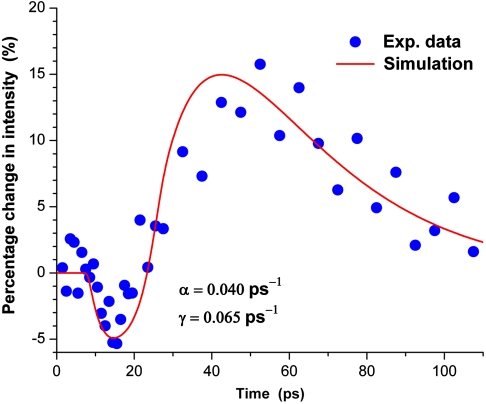
At high excitation fluence, melting of the gold crystal may occur near or above its melting point of 1,337.33 K. Time-resolved electron diffraction, X-ray scattering, and optical spectroscopy techniques (7, 24–29) have been applied by previous investigators to study the melting process of gold nanocrystals. In this study, we report the observation of melting, annealing, and recrystallization of gold single crystal under femtosecond irradiation. We gradually increased the laser pulse illumination intensity until melting of the crystal surface was detected. We measured the XRD intensity as a function of time, keeping the excitation energy and intensity below the damage threshold. At times before excitation, the XRD signal is in all aspects the same as the one observed at room temperature without any irradiation. As the time delay was increased to a few picoseconds after excitation and the energy of the laser pulse becomes sufficient to melt but not damage the crystal, a sharp decrease in the total XRD intensity was observed within 5 ps after irradiation of the 150-nm Au(111) crystal. It was followed by an increase in the diffraction intensity after approximately 5 ps, which continued to increase for 40 ps after excitation, and recovered to its original diffraction intensity after more than 100 ps (Fig. 2). The diffraction signal taken 10 min after the crystal is cooled is the same as the one measured before excitation, at the start of the experiment, which suggests that the gold crystal remains intact and without damage throughout the experiment. The entire process is attributed to melting and annealing of gold crystal, which generally consists of three stages: (i) the recovery phase—melting or softening by removal of crystal defects which cause the internal stresses inside the crystal; (ii) the grain growth phase—if the lattice temperature is kept under annealing condition, grain growth will occur and the microstructure will start to coarsen and induce new internal stresses; (iii) the recrystallization phase—the new strain-free grains nucleate and grow to replace those deformed by internal stresses.
Fig. 2.
Change in the integrated X-ray intensity as a function of time (dots) and computer simulation (solid line). For a 150-nm-thick Au(111) crystal heated with a 400-nm, 100-fs, 37-mJ pulse, γ = 0.065 ps-1, α = 0.04 ps-1, and a scaling factor of 7.2.
The sharp decrease in XRD intensity is attributed to melting or premelting of the Au(111) crystal. Because the illumination energy is limited, the ultrafast melting/premelting process occurs only in the area within the optical path length (16.9 nm), while the X-ray pulse probes the entire 150-nm-thick gold crystal. Consequently, only a small fraction (ca. 11%) of the X-ray intensity is expected to be affected by surface melting. Our experimental data show a decrease in the diffraction intensity of 6–8%. The rate of melting process was estimated from our data to be 3 × 10¹¹ s-1, which is in agreement with the previously reported values for thermal melting (27). Based on phonon/phonon and phonon/lattice interaction rates, which are in the 1011 s-1 rate, and our XRD data, we assign the observed processing to thermal melting, rather than electronic melting. Computer simulations presented later in this paper support the experimental data and conclusions.
The increase in the XRD intensity from 92–94% at approximately 7 ps up to 113–116% at 40 ps after excitation is attributed to recrystallization, mosaic crystal formation, and softening of the inner crystal. For phonon tG = tK ∼ 5 ps in graphite and graphene (30), and for silicon 2Γ = 0.48 cm-1, where Γ = 1/τ (31); homogeneous melting was observed in epitaxial Ag(001) films in the first few picoseconds after excitation with a femtosecond laser pulse (32). We observe that, after approximately 10 ps, the surface heat energy and acoustic wave cause lattice temperature increase in the crystal, through phonon/phonon interaction. However, the excitation pulse energy that we used is neither enough to penetrate throughout the crystal nor sufficient to melt the entire crystal. Therefore, only a softening of the interatomic potential of the inner areas of the crystal is expected (33). Generally speaking, materials become softer after excitation heating and, if the lattice temperature is close to the melting point and is maintained for a period of time, the lattice will anneal, recrystallize, and form a mosaic crystal structure due to strain-free crystallization, which may give higher XRD intensity than the original single-crystal structure when measured with an X-ray beam that is not perfectly collimated and has also a certain wavelength distribution. In fact, Fig. 2 shows higher diffraction intensity as the crystal cools off after melting.
It is to be noted that the 55-keV electron diffraction (ED) intensity of a 20-nm freestanding polycrystalline gold film was found to increase after excitation with 2.85-MJ/kg pulse (10). This increase in ED intensity of the liquid peak and thermal diffuse scattering is attributed to the increased lattice stability under high effective electronic temperatures, which result from the strong correlation between lattice bonding and electronic structure. However, the XRD increase we observed is different from this ED increase in several ways: (i) onset time. The ED increase occurs immediately after excitation, with a formation lifetime of 1–4 ps depending on the excitation energy from 47 to 110 mJ/cm2. The XRD intensity increase we observed is right after a decrease in intensity due to melting process and has a much longer formation lifetime (ca. 8 ps). (ii) Excitation energy: ED utilized 6–14 times more light energy than the energy necessary to melt the entire 20-nm sample starting from room temperature. However, we applied 37 mJ/cm2 to melt the surface of the 150-nm Au(111) crystal. (iii) Signal source: The ED intensity increase is due to the rise in the liquid phase, whereas the XRD increase is the result of the rise in crystalline structure of the gold crystal. Therefore, we believe the increase of XRD signal is because of the recrystallization of the melted crystal and also the microstructure rearrangement of the softened inner crystal, instead of the abnormal hardening of the lattice that was found in ED studies (10).
The time for the melting observed in this experiment, ca. 8 ps, is shorter than the 12–18 ps observed in the 20-nm gold single crystal using 3.5-MeV electron diffraction (11), which could be explained by the difference in sample thickness. In the 3.5-MeV ED experiment, the 800-nm excitation penetration depth is 7–8 nm. Considering the fast electron/electron coupling and ballistic electrons, which have a mean free path of 100 nm, the whole crystal was considered to achieve homogeneous temperature. In addition, the experiments were performed in high vacuum with free-standing crystal or samples on carbon/Formvar film of low thermal conductivity. Under this condition, the recrystallization process did not occur until the deposited energy was transferred to the environment by heat diffusion. As a result, the recrystallization process could not be captured by electron diffraction in the picosecond range or be masked by the steep decrease in diffraction intensity due to the melting of the whole crystal. For the experiments presented here, the 400-nm excitation light penetrates gold to a depth of 16.9 nm, which is much shorter than the 150-nm crystal thickness. In addition, the laser energy deposited is sufficient to melt only 7% of the crystal. Therefore, the effective lattice temperature at the surface will decease while the absorbed energy is transferred to the interior area by phonon/phonon interaction. As the lattice temperature decreases below the melting point, recrystallization starts at the surface of the crystal, while a portion of the interior crystal reaches the phase transition threshold and starts to melt. This dynamic recrystallization process involves both the deformation of the crystal interior and the crystalline recovery of the skin.
Grains are microscopic crystals held together through the boundaries where crystals of different orientations meet. The crystals at each side of the boundary are identical except the orientation is different. As the temperature in the metal decreases, nucleation starts, the grains increase in size, the boundaries decrease in number, the rate of crystallization decreases, the orientation diminishes, and consequently, the diffraction rocking curve intensity increases.
Using the time-resolved XRD system, which was described previously, we followed the change in the structure of the Au(111) as a function of time (picoseconds) from 298 K through contraction (16) and expansion, melting, and recrystallization. During the crystallization process, any deformed grains that may remain are replaced by new crystallites, which nucleate and grow as the melted gold metal cools below the minimum nucleation temperature. The seed for crystallization is provided by the nonmelted Au(111) crystals lying just below the melted region of the sample. Nucleation is considered to be the initial process of recrystallization, which requires a minimum temperature below melting to start. In our time-resolved XRD experiments, the sample is initially at room temperature then heated by an ultrafast pulse that only heats the upper layer(s), resulting first in contraction. As the power of the laser pulse increases, with the pulse width remaining constant at 100 fs, the temperature reaches the melting point and the region of the sample that absorbs the light melts. Consequently, the diffraction intensity diminishes. As the melted metal cools and the temperature reaches the minimum temperature required for nucleation, nucleation is observed and crystallization continues to grow with an Arrhenius increasing rate. Fig. 2 shows the crystal growth in the form of XRD intensity vs. time (picoseconds). This plot follows quite closely the Avrami relationship that describes the kinetics of crystallization; our computer simulations (Fig. 2) show that, 3 ps after excitation, melting is initiated and the minimum XRD intensity corresponding to the maximum fraction of the crystal being melted is at 13 ps. From 10 to about 20 ps after excitation, grain crystal growth is observed, followed by impingement of grains and mosaic crystal formation. As recrystallization proceeds, the grains grow and form blocks of mosaic crystal with dimensions of approximately 10-5 cm and tilted to each other by fractions of a minute of arc. Because of the loss of coherence between the diffracted waves from the different mosaic blocks, the total diffracted intensity is the sum of all the intensities diffracted by each mosaic block. Therefore, the mosaic intensity may exceed the intensity of the original crystal (Fig. 2). The increase in intensity above that of the original crystal is therefore attributed to mosaic crystal formation. As the crystal is annealed, in time, the mosaic crystals “fuse” into a single-orientation, single-crystal structure that is the same as the original. This transformation of the mosaic blocks into single-crystal formation is shown in Fig. 2, from approximately 40 ps, where the mosaic crystals are at maximum abundance, to 100 ps, when single-crystal growth dominates and the integrated diffraction intensity becomes the same as that of the original single crystal. These time-constant differences appear to be caused by retardation due to timescale for crystallization from mosaic crystals to a large single crystal that is the same as the remaining nonmelt crystal substrate.
Computer Simulation Model of Laser Heating.
To model laser heating of metallic thin films by femtosecond laser pulses, the two-temperature model (the electron and phonon temperature subsystems) has been used. According to the TTM, the evolution of the electron temperature Te(z,t) and the phonon temperature TL(z,t) follows Eq. 1 TL(z,t)-:
 |
[1] |
At low laser excitation fluence, a valid approximation is to assume that the electron/phonon coupling g is a constant, the specific heat Ce for the electrons has linear dependence on electron temperature, and the electronic thermal conductivity κe is approximated by KeTe/TL (34). Such simple temperature dependence was shown to be inaccurate for electron temperature beyond 3, 000 K (35). In our experiments, using fluence of 37 mJ/cm2 and reflectivity R of 25% at 400-nm excitation, the electron temperature could reach over 104 K and the lattice could be heated over 103 K with some surface layers heated above the 1,338 K melting point of gold. Therefore, the simple temperature dependence based on the TTM is insufficient. To compare the experimental data for laser heating at a large fluence with model simulations using TTM, more accurate temperature-dependence modeling Ce, κe, and g needs to be considered. In our simulations, we used the revised temperature-dependence results reported for g (36) and Ce (37). For κe in gold, by taking into account the effects of electron/electron and electron/phonon scattering on the electron relaxation time (34, 36), which result in a decrease of the thermal conductivity at a very high temperature, we used
 |
[2] |
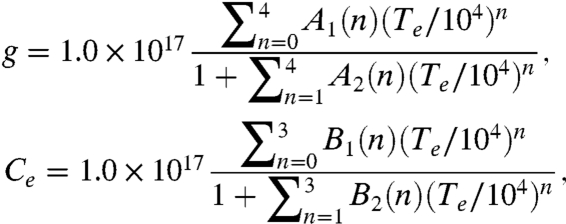
We also employed the fourth- and third-order Padé approximation for the electron/phonon g and Ce, respectively,
 |
[3] |
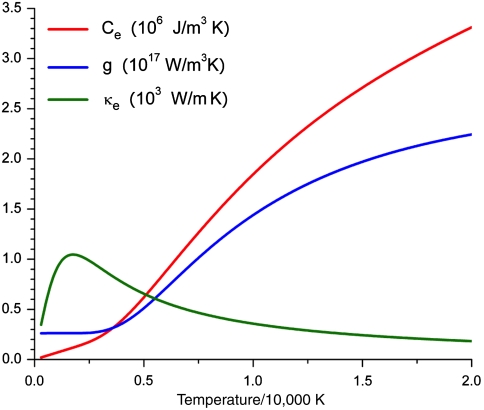
where A1(0) = 0.257, A1(1) = -0.549, A1(2) = 0.553, A1(3) = -0.650, and A1(3) = 6.269; A2(1) = -2.544, A2(2) = 4.566, A2(3) = -1.479, and A2(4) = 2.541; B1(0) = -0.043, B1(1) = 8.451, B1(2) = -28.797, and B1(3) = 68.387; B2(1) = -1.645, B2(2) = 2.539, and B2(3) = 0.702. The temperature dependence of these coefficients for Ce, g, and κe is illustrated in Fig. 3. It is noted that both Ce and g increase with the electron temperature but not linearly, and κe first increases then decreases as the temperature becomes higher than about 2,000 K.
Fig. 3.
Temperature dependence of κe, g, and Ce according to Eqs. 2 and 3.
The differential Eq. 1 with a continuous variable in space was solved numerically with discrete lattice points (20), with lattice space of the gold lattice constant. Using Eqs. 2–4 for the relevant temperature-dependent coefficients, we have calculated the electron and phonon temperature distribution of laser-heated, single-crystal gold films. In our simulation, we used 150-nm-thick film, at 400 nm, 100 fs FWHM pulses, a fluence of 37 mJ/cm2, and R ∼ 25%. The parameters used are as follows: lattice constant 0.4786 nm; four gold atoms per unit cell; atomic mass 32.76 × 10⁻²⁶ kg; and specific heat for phonons 2.5 × 10⁶ Jm-1 K-1. At 300 K, the reduced Ce at 67.0 Jm-3 K-2, the electron thermal conductivity at 318 Wm-1 K-1, and g at 2.61 × 10¹⁶ Wm-3 K-1 were used. The values at higher temperatures were obtained using Eqs. 2–4.
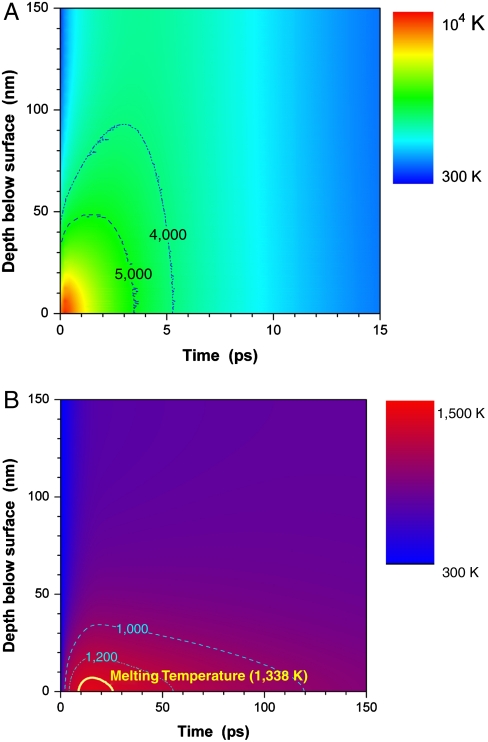
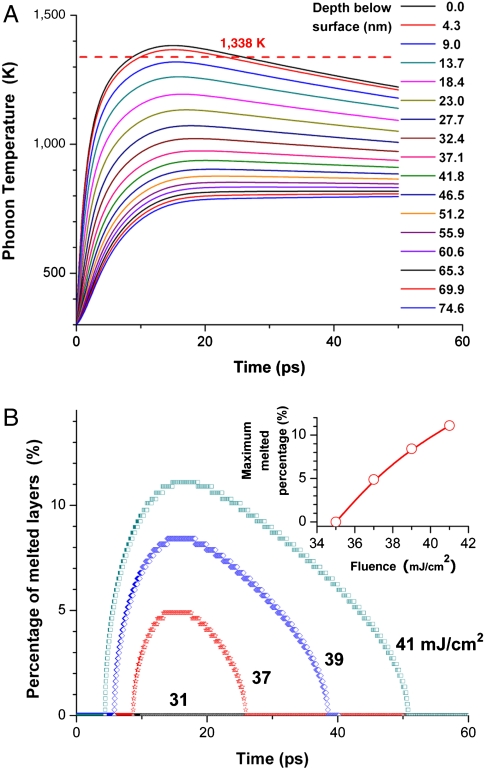
The two-dimensional plot of the temporal and spatial profiles for the electron and phonon temperature are given in Fig. 4. Heating of electrons is almost instantaneous, reaching a maximum of about 104 K at a laser fluence of 37 mJ/cm2. In contrast, phonons reach maximum temperature of about 1,400 K in about 17 ps, owing to the much larger heat capacity of the electrons and therefore slower electron/phonon interactions.
Fig. 4.
(A) Two-dimensional plot of the electron temperature temporal and spatial distribution in gold film. (B) Similar plot for the phonon temperature. The yellow line represents the contour curve of the melting temperature.
At the laser fluence of 37 mJ/cm2 (Fig. 5A), melting of the very first top surface layers occurs in about 9 ps, and the temperature of those melted atoms drops below the melting point at about 26 ps. The maximum percent of melted gold layers is about 5% and occurs at about 15 ps. These results are in reasonably good agreement with our experimental results. The onset time of melting occurs slightly earlier at a larger fluence (for example, at 39 mJ/cm2), and the time for all melted atoms to cool below the melting point occurs slighter later. However, as shown in the inset of Fig. 5B at fluence below 35 mJ/cm2, no melting occurred. These simulated results are consistent with our experimental observations where no melting was detected at this reduced fluence. As the gold crystal melts, there is loss in crystallographic structure and the total integrated X-ray intensity of the diffracted spot decreases, accordingly. The melted layers cool slowly, as the heat being thermally conducted to other layers and the recrystallization process starts.
Fig. 5.
(A) Time dependence of the phonon temperature at various depths below the irradiated surface. The horizontal dashed line represents the melting point of 1,338 K. (B) Time dependence for the population growth of the melted layers is in percent of all crystal layers. (Inset) The maximum percent of the melted layers. At the laser fluence of 37 mJ/cm2, as used in our experiments, about 5% of the surface layers were melted.
To simulate the temporal changes of the integrated X-ray intensity for the single-crystal film, we consider the following simple, coupled-rate equations:
 |
[4] |
where Nm(t) describes the population change of the melted layers after reaching the peak at 15 ps, as illustrated in Fig. 4A. The above equation describes subsequent cooling after melting to the biphase solid–liquid state with population y1(t), followed by formation of mosaic crystal grains with population y2(t), and then annealing. In Fig. 2, we show the experimental data curve for the temporal behavior of the integrated X-ray intensity versus the simulated result. The initial drop bellow 0% is due to melting and the increase above the baseline at 0% is due to formation of mosaic crystal grains. In the simulation, we use γ = 0.065 ps-1 α = 0.04 ps-1 and a scaling factor of 7.2 for the enhanced X-ray intensity from the mosaic crystal grains.
Conclusion.
We conducted an experimental and computer simulation study of a single-crystal metal that monitored and detected directly the changes in the structure during femtosecond heating, as a function of time starting with photon/electron and electron/phonon coupling through phonon/lattice interaction, contraction, melting, nucleation, recrystallization, and mosaic crystal formation. In addition, the formation and propagation of the blast force and sonic wave have been observed, as described previously.
Materials and Methods
The experimental setup has been reported previously (16, 38), where t = 0 defines the time when both X-ray and optical pulses overlap with each other on the sample. The Au(111) crystals under investigation in this study are 35-, 70-, and 150-nm thick, grown on mica substrate, and the Au(111) plane Bragg angle for CuKα reflection is 19.1°.
Acknowledgments.
This work was supported in part by The W. M. Keck Foundation. J.C. also thanks the National Natural Science Foundation of China for Grants 11004132, 10734130, and 10874113 and the National Basic Research Program of China for Grant 2007CB815101.
Footnotes
The authors declare no conflict of interest.
References
- 1.Bennemann KH. Ultra-fast dynamics in solids: non-equilibrium behaviour of magnetism and atomic structure. Ann Phys. 2009;18:480–560. [Google Scholar]
- 2.Tom HWK, Aumiller GD, Brito-Cruz CH. Time-resolved study of laser-induced disorder of Si surfaces. Phys Rev Lett. 1988;60:1438–1441. doi: 10.1103/PhysRevLett.60.1438. [DOI] [PubMed] [Google Scholar]
- 3.Harb M, et al. Electronically driven structure changes of Si captured by femtosecond electron diffraction. Phys Rev Lett. 2008;100:155504. doi: 10.1103/PhysRevLett.100.155504. [DOI] [PubMed] [Google Scholar]
- 4.Saeta P, Wang JK, Siegal Y, Bloembergen N, Mazur E. Ultrafast electronic disordering during femtosecond laser melting of GaAs. Phys Rev Lett. 1991;67:1023–1026. doi: 10.1103/PhysRevLett.67.1023. [DOI] [PubMed] [Google Scholar]
- 5.Kim AMT, Callan JP, Roeser CAD, Mazur E. Ultrafast dynamics and phase changes in crystalline and amorphous GaAs. Phys Rev B Condens Matter Mater Phys. 2002;66:245203. [Google Scholar]
- 6.Chen P, Tomov IV, Rentzepis PM. Time resolved heat propagation in a gold crystal by means of picosecond X-ray diffraction. J Chem Phys. 1996;104:10001–10007. [Google Scholar]
- 7.Hartland GV, Hu M, Sader JE. Softening of the symmetric breathing mode in gold particles by laser-induced heating. J Phys Chem B. 2003;107:7472–7478. [Google Scholar]
- 8.Shumay IL, Höfer U. Phase transformations of an InSb surface induced by strong femtosecond laser pulses. Phys Rev B Condens Matter Mater Phys. 1996;53:15878–15884. doi: 10.1103/physrevb.53.15878. [DOI] [PubMed] [Google Scholar]
- 9.Ao T, et al. Optical properties in nonequilibrium phase transitions. Phys Rev Lett. 2006;96:055001. doi: 10.1103/PhysRevLett.96.055001. [DOI] [PubMed] [Google Scholar]
- 10.Ernstorfer R, et al. The formation of warm dense matter: Experimental Evidence for electronic bond hardening in gold. Science. 2009;323:1033–1037. doi: 10.1126/science.1162697. [DOI] [PubMed] [Google Scholar]
- 11.Musumeci P, Moody JT, Scoby CM, Gutierrez MS, Westfall M. Laser-induced melting of a single crystal gold sample by time-resolved ultrafast relativistic electron diffraction. Appl Phys Lett. 2010;97:063502. [Google Scholar]
- 12.Guo C, Rodriguez G, Lobad A, Taylor AJ. Structural phase transition of aluminum induced by electronic excitation. Phys Rev Lett. 2000;84:4493–4496. doi: 10.1103/PhysRevLett.84.4493. [DOI] [PubMed] [Google Scholar]
- 13.Siwick BJ, Dwyer JR, Jordan RE, Miller RJD. An atomic-level view of melting using femtosecond electron diffraction. Science. 2003;302:1382–1385. doi: 10.1126/science.1090052. [DOI] [PubMed] [Google Scholar]
- 14.Kandyla M, Shih T, Mazur E. Femtosecond dynamics of the laser-induced solid-to-liquid phase transition in aluminum. Phys Rev B Condens Matter Mater Phys. 2007;75:214107. [Google Scholar]
- 15.Lin Z, Zhigilei LV. Time-resolved diffraction profiles and atomic dynamics in short-pulse laser-induced structural transformations: Molecular dynamics study. Phys Rev B Condens Matter Mater Phys. 2006;73:184113. [Google Scholar]
- 16.Chen J, Chen W-K, Rentzepis PM. Blast wave and contraction in Au(111) thin film induced by femtosecond laser pulses. A time resolved X-ray diffraction study. J Appl Phys. 2011;109:113522. [Google Scholar]
- 17.Nisoli M, et al. Coherent acoustic oscillations in metallic nanoparticles generated with femtosecond optical pulses. Phys Rev B Condens Matter Mater Phys. 1997;55:R13424–13427. [Google Scholar]
- 18.Park H, Wang X, Nie S, Clinite R, Cao J. Mechanism of coherent acoustic phonon generation under nonequilibrium conditions. Phys Rev B Condens Matter Mater Phys. 2005;72:R100301. [Google Scholar]
- 19.Park H, Nie S, Wang X, Clinite R, Cao J. Optical control of coherent lattice motions probed by femtosecond electron diffraction. J Phys Chem B. 2005;109:13854–13856. doi: 10.1021/jp052857u. [DOI] [PubMed] [Google Scholar]
- 20.Tang J. Coherent phonon excitation and linear thermal expansion in structural dynamics and ultrafast electron diffraction of laser-heated metals. J Chem Phys. 2008;128:164702–164714. doi: 10.1063/1.2901028. [DOI] [PubMed] [Google Scholar]
- 21.Yu P, Tang J, Lin SH. Photoinduced structural dynamics in laser-heated nanomaterials of various shapes and sizes. J Phys Chem C. 2008;112:17133–17137. [Google Scholar]
- 22.Cavalleri A, et al. Anharmonic lattice dynamics in germanium measured with ultrafast X-ray diffraction. Phys Rev Lett. 2000;85:586–589. doi: 10.1103/PhysRevLett.85.586. [DOI] [PubMed] [Google Scholar]
- 23.Nicoul M, Shymanovich U, Tarasevitch A, von der Linde D, Sokolowski-Tinten K. Picosecond acoustic response of a laser-heated gold-film studied with time-resolved X-ray diffraction. Appl Phys Lett. 2011;98:191902. [Google Scholar]
- 24.Elsayed-Ali HE, Weber PM. Time-resolved surface electron diffraction. In: Helliwell JR, Rentzepis PM, editors. Time-Resolved Diffraction. Oxford: Oxford Univ Press; 1997. pp. 284–323. [Google Scholar]
- 25.Link S, El-Sayed MA. Shape and size dependence of radiative, non-radiative and photothermal properties of gold nanocrystals. Int Rev Phys Chem. 2000;19:409–453. [Google Scholar]
- 26.Link S, El-Sayed MA. Spectroscopic determination of the melting energy of a gold nanorod. J Chem Phys. 2001;114:2362–2368. [Google Scholar]
- 27.Dwyer JR, et al. Femtosecond electron diffraction: ‘Making the molecular movie’. Philos Trans R Soc A. 2006;364:741–778. doi: 10.1098/rsta.2005.1735. [DOI] [PubMed] [Google Scholar]
- 28.Ruan CY, Murooka Y, Raman RK, Murdick RA. Dynamics of size-selected gold nanoparticles studied by ultrafast electron nanocrystallography. Nano Lett. 2007;7:1290–1296. doi: 10.1021/nl070269h. [DOI] [PubMed] [Google Scholar]
- 29.Plech A, Kotaidis V, Gresillon S, Dahmen C, von Plessen G. Laser-induced heating and melting of gold nanoparticles studied by time-resolved X-ray scattering. Phys Rev B Condens Matter Mater Phys. 2004;70:195423. [Google Scholar]
- 30.Bonini N, Lazzeri M, Marzari N, Mauri F. Phonon anharmonicities in graphite and graphene. Phys Rev Lett. 2007;99:176802. doi: 10.1103/PhysRevLett.99.176802. [DOI] [PubMed] [Google Scholar]
- 31.Narasimhan S, Vanderbilt D. Anharmonic self-energies of phonons in silicon. Phys Rev B Condens Matter Mater Phys. 1991;43:4541–4544. doi: 10.1103/physrevb.43.4541. [DOI] [PubMed] [Google Scholar]
- 32.Chan W-L, Averback RS, Cahill DG, Lagoutchev A. Dynamics of femtosecond laser-induced melting of silver. Phys Rev B Condens Matter Mater Phys. 2008;78:214107. [Google Scholar]
- 33.Fritz DM, et al. Ultrafast bond softening in bismuth: Mapping a solid’s interatomic potential with X-rays. Science. 2007;315:633–636. doi: 10.1126/science.1135009. [DOI] [PubMed] [Google Scholar]
- 34.Qiu TQ, Tien CL. Femtosecond laser heating of multi-layer metals—I. Analysis. Int J Heat Mass Transfer. 1994;37:2789–2797. [Google Scholar]
- 35.Wang XY, Riffe DM, Lee YS, Downer MC. Time-resolved electron-temperature measurement in a highly excited gold target using femtosecond thermionic emission. Phys Rev B Condens Matter Mater Phys. 1994;50:8016–8019. doi: 10.1103/physrevb.50.8016. [DOI] [PubMed] [Google Scholar]
- 36.Lin Z, Zhigilei LV, Celli V. Electron-phonon coupling and electron heat capacity of metals under conditions of strong electron–phonon nonequilibrium. Phys Rev B Condens Matter Mater Phys. 2008;77:075133. [Google Scholar]
- 37.Ivanov DS, Zhigilei LV. Combined atomistic-continuum modeling of short-pulse laser melting and disintegration of metal films. Phys Rev B Condens Matter Mater Phys. 2003;68:064114. [Google Scholar]
- 38.Chen J, Tomov IV, Elsayed-Ali HE, Rentzepis PM. Hot electrons blast wave generated by femtosecond laser pulses on thin Au(111) crystal, monitored by subpicosecond X-ray diffraction. Chem Phys Lett. 2006;419:374–378. [Google Scholar]


