Abstract
In MRI guided cardiovascular interventional procedures it is valuable to be able to visualize blood flow immediately and interactively in selected regions. In particular, it is useful to assess normal or pathological communications between specific heart chambers and vessels. Phase-contrast velocity mapping is not suitable for this purpose as it requires too much data and is not capable of determining directly if blood originating in one location travels to a nearby location. This paper presents a novel flow visualization method called Virtual Dye Angiography that enables visualization of blood flow analogous to selective catheter angiography. The method employs two-dimensional RF pulses to achieve interactive, intermittent, targeted saturation of a localized region of the blood pool. The flow of the saturated spins is observed directly on real-time images or, in an enhanced manner, using ECG synchronized background subtraction. The modular nature of the technique allows for easy and seamless integration into a real-time, interactive imaging system with minimal overhead. We present initial results in animals and in a healthy human volunteer.
Keywords: real-time MRI, interventional MRI, non-contrast, endogenous contrast, visualization
Introduction
Interventional cardiovascular MRI aims to exploit the soft-tissue imaging and rapid low-latency image construction capabilities of contemporary MRI systems to guide mechanical treatments for cardiovascular disease (1,2). While blood space and blood flow are usually adequately characterized using pre-procedure magnetic resonance angiography and velocity-encoded MR techniques (3), interventional operators often wish to interrogate specific local blood flow fields interactively in real-time, for example to understand the flow pattern of an intracardiac defect, fistula, or collateral blood supply.
During conventional X-ray procedures, this is performed by positioning an invasive catheter tip at a desired location followed by selective contrast injection. We attempt to replicate the capability of catheter-selective angiography using non-invasive MRI techniques. The technique, called Virtual Dye Angiography, employs a 2D RF pulse, followed by a dephasing gradient, to tag a selected region of the blood pool and observe its evolution during subsequent imaging.
Conventional phase-contrast velocity mapping (PC) (4) is not well-suited for integration into an interventional procedure primarily because it requires a large amount of data. Although PC color flow (5), using spiral readouts, has been used to provide real-time visualization of the blood velocity in a single flow direction, it uses a different sequence than the preferred real-time SSFP imaging sequence and thus would require an interruption of the interventional MRI workflow. In MRI-guided interventions, the operator is often interested in knowing, not the flow velocity through a slice but, the destination of blood originating in a certain region, i.e., which heart chambers or vessels are connected to each other. To make such a determination based on PC data, it may well be necessary to acquire 4D PC velocity mapping data (6,7) and perform particle tracing.
Several previous methods(8–14) have used the tagging of blood to visualize flow or perfusion. Edelman et al (9) have used a 90° slice-selective excitation, i.e., a 1D RF pulse, followed by a dephasing gradient to tag blood in a slice intersecting a vein in order to evaluate flow in the portal venous system. A combination of slice-selective and nonselective excitations have been used to image flow using inversion recovery (8) or stimulated echos (10). In arterial spin labeling (11) blood in a slab proximal to the region of interest is tagged by saturation or inversion, and perfusion is quantified by computing the difference with a baseline non-labeled image. In Globally Coherent Free Precession (GCFP) (13) moving spins passing through a slice are tagged and then imaged under projection imaging. Pulse wave velocity has been measured by the tagging of a column of blood in a sinusoidal(12) or comb-like(14) pattern followed by 1D projection imaging. Stuber et al (15) use a 2D-selective excitation of blood in the aorta, and the complex subtraction between 180° and 0° excitations, to image the coronary artery lumen using 3D free-breathing scans. While Virtual Dye Angiography is similar to these methods — it combines 2D-selective excitation of Ref (15) with the 90° excitation followed by a dephasing gradient of Ref (9), the primary conceptual difference is that it has been designed to be fully real-time and interactive in order to be used in interventional imaging
Methods
Pulse sequence
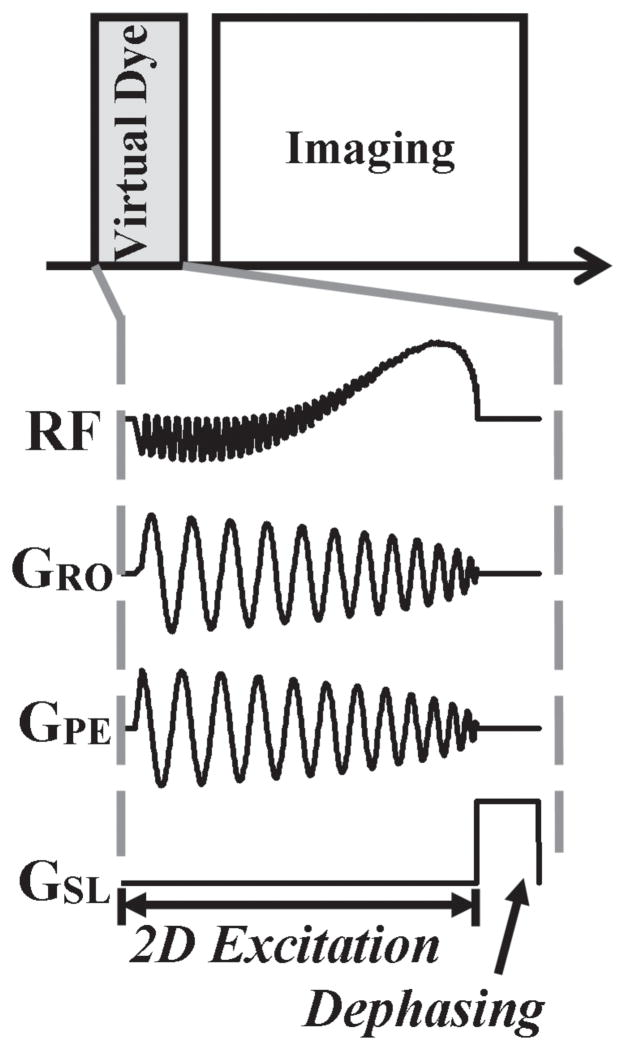
Figure 1 displays the timing diagram of the sequence that we implemented. A Virtual Dye saturation module is played before an image is acquired. It consists of a 2D RF pulse, to excite a cylindrical column of spins by 90°, followed by a dephasing gradient. The 2D-selective excitation consists of a spiral gradient played concurrently with a shaped RF pulse. We used the spiral gradient implementation of Hargreaves (http://mrsrl.stanford.edu/~brian/vdspiral/). The excitation k-space framework (16,17) explains how an RF pulse can be chosen to excite a column whose profile is of a desired shape. In particular, the shape, size, and location of this virtual bolus (the cylindrical column of saturated spins) are determined by the RF pulse envelope. The Virtual Dye method is modular and can be used with a wide variety of imaging sequences. The duration of the Virtual Dye saturation module is on the order of 10 ms (an RF excitation of about 10 ms followed by a dephasing gradient of about 1 ms) and the saturation persists for a time-period on the order of T1 (typically about 1 sec in blood).
Figure 1.
Sequence timing diagram. The Virtual Dye module is played before the image is acquired. The Virtual Dye module consists of a shaped RF pulse played concurrently with a spiral gradient in order to excite a column of spins by 90° and then a dephasing gradient to saturate the spins.
Real-time implementation
The Virtual Dye module is integrated into a real-time imaging sequence in a computationally efficient manner to ensure that changes made interactively by the user are reflected immediately in the virtual bolus. Specifically, when the user changes the location of the bolus it is not necessary to recalculate the entire RF envelope; only the complex phase is modified. Changes in the size of the bolus do require a recalculation of the complex amplitude of the RF waveform and a short sequence delay (~50 ms) is added to the sequence to prevent buffer under-runs during waveform recalculation.
There are two modes of real-time visualization. In “raw” mode flow is visualized by directly viewing the raw MR image containing the Virtual Dye bolus. In “subtraction” mode difference images are computed in order to increase contrast. The image in which the bolus is present is subtracted from a background image of the same slice at a corresponding cardiac phase without the bolus. The difference image is then color-blended into the virtual bolus image.
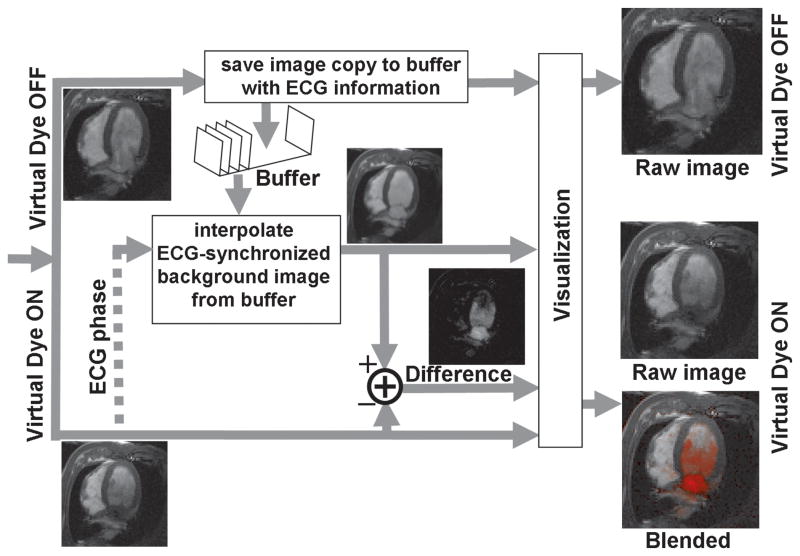
Figure 2 shows how this subtraction is performed in real-time with low latency. When Virtual Dye is off, the incoming image frames are saved to an image buffer, along with its ECG trigger times, before being passed along to the real-time visualization system (Interactive Front End; Siemens Corporate Research; Princeton, USA). When the Virtual Dye is enabled, a background image is extracted from the existing, accumulated buffer of images. Linear interpolation is used to extract the background image from the buffer at the ECG cardiac phase of the currently acquired Virtual Dye image. Both the difference image and the Virtual Dye image are passed on to the real-time visualization system, which color-blends the difference image on to the Virtual Dye image.
Figure 2.
Real-time data processing. When Virtual Dye is enabled, the subtraction visualization mode can be achieved in real-time by interpolating the background image from the existing accumulated buffer of image (lower half of the figure). In order to make this possible, every acquired image is stored to a buffer (along with its ECG information) when Virtual Dye is not enabled, before it is passed on to the visualization system.
Respiratory motion may cause transient artifacts in the subtraction images since the subject is freely breathing and there is no respiratory gating. The Virtual Dye image and the background image can be slightly misregistered and the subtraction image can have misleadingly high-valued (bright) pixels in the vicinity of misregistered edges. Since this artifact occurs for a small subset of the real-time images, it is not generally a barrier to the use of the subtraction visualization mode. However, the respiratory motion artifact can be suppressed by interpolating both the Virtual Dye and background images over multiple cardiac cycles before subtraction. Respiratory motion is effectively averaged out when images, close together in cardiac phase, from multiple cardiac cycles are combined. Because of the need to interpolate the Virtual Dye image over multiple cardiac cycles, this third (“interpolation-and-subtraction”) visualization mode is not possible in real-time but after a short delay of a few seconds.
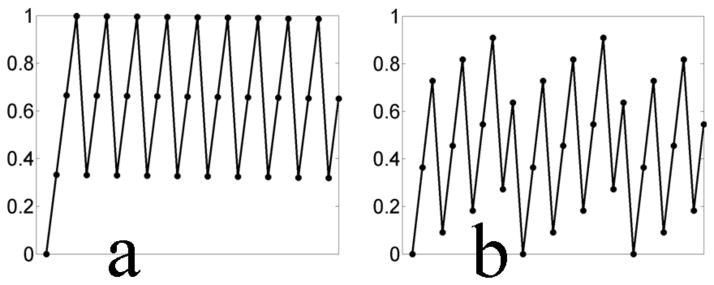
In the visualization modes involving subtraction, it is necessary to be able to interpolate an image at an arbitrary cardiac phase from a buffer of accumulated images. This might be challenging if the cardiac phases of the accumulated images are not sufficiently widely distributed, i.e. when the length of a cardiac cycle is a multiple of the image acquisition time by a small integer. To avoid such cases, without disrupting the acquisition of images, a small delay can be added in between images as shown in Figure 3. Here the length of a cardiac cycle is 649 ms and the duration of an image frame is 216 ms. Figure 3(a) plots the cardiac phase (as a fraction of the cardiac cycle) for the stream of images before the delay is used. Because the length of the cardiac cycle is roughly three times the length of an image frame, here the (normalized) cardiac phases are clustered at 0.33, 0.66 and 1.0. With an insertion of a 20 ms delay between images (a 9% increase in the image acquisition time) the cardiac phases are sufficiently widely and uniformly sampled.
Figure 3.
Delays can be inserted between image acquisitions to ensure that cardiac phases are uniformly distributed. If the cardiac phases of the acquired images in the image buffer are insufficiently uniformly distributed, the interpolation of a background image from the buffer becomes less robust. Displayed are the (normalized) cardiac phase. vs. image index (a) before and (b) after the delays are inserted. In (a) all the acquired images are at 0,1/3 and 2/3 cardiac phase, while after the insertion of a 20 ms delay between frames, the cardiac phases are uniformly distributed at 11 points in the cardiac cycle.
The algorithm used to compute the added delay is based on the principle from integer modulus arithmetic that if integers p and q are co-prime, then integer multiples of the fraction p/q will cover the interval [0 1.0] in q steps. Given a heartbeat duration of H, an image acquisition time of T, and a target number of samples of a cardiac cycle (i.e. number of image frames in a cardiac cycle) denoted by N, this fraction is found by a simple search over integers. For a given integer p we find the largest integer q that (a) is co-prime to p, (b) satisfies (p/q)> (T/H) and (c) is ≥ N. We start with an initial p of ⌈NT/H⌉ (which is the smallest allowable value). If a suitable q is not found, p is incremented by 1 and the search is repeated until successful. The delay is then exactly (p/q)H − T. The value of H is computed from ECG data from prior cardiac cycles. If the heart-rate remains constant, after a time-period of q× H (p/q)= H× p, the whole cardiac cycle will be uniformly sampled by exactly q samples. Since we do not care about the exact cardiac phase of the image but only that the cardiac cycle is sufficiently well covered, even if the heart-rate changes slightly, the heart beat will still be well covered. On the other hand if the duration of the cardiac cycles changes in a more random manner, the coverage of the cardiac cycle will likely be maintained by that randomness.
Hardware delays can cause the actual spiral gradient played by the scanner to deviate slightly from intended gradient waveform (18) and introduce an error in the location of the virtual bolus. The correction is performed by delaying the RF pulse by a constant amount that is independent of slice orientation. This delay correction is estimated by performing a one-time calibration scan. This calibration scan involves running the Virtual Dye Angiography method on an object that contains an immobile substance (such as a static water phantom) and adjusting the RF delay until the actual location of the virtual bolus is visually verified to be equal to the intended location.
Computational Modeling
The contrast behavior of SSFP and spoiled GRE over time, following the application of the Virtual Dye saturation module, was modeled. For SSFP the steady-state signal equation (19) [Eq. 6] was used and in the case of GRE the spoiled-steady-state equations (20) [Eq 9.19] was used. These computations do not take into account the mixing of blood, which further reduces the contrast.
Experiments
The method was tested in a phantom and in vivo (in swine). Animal experiments were approved by the institutional animal care committee and conducted according to contemporary NIH guidelines. Swine (56–58 kg) underwent general anesthesia with inhaled isoflurane and mechanical ventilation. The method was also tested in a healthy volunteer in a protocol approved by the Institutional Review Board and with written informed consent. All experiments were conducted on a 1.5T MRI Siemens Espree scanner (Siemens, Erlangen, Germany) and all images were collected without breath-holding.
Phantom experiment: water bath
Virtual Dye Angiography was demonstrated in a custom-made water bath phantom. The water was manually moved and then left to settle while SSFP imaging was performed.
Phantom experiment: correcting the distortion due to hardware delays
The method of correcting the error due to hardware delays was demonstrated by running the Virtual Dye Angiography method with and without the RF delay correction that had been previously estimated from the one-time calibration scan (as described in the previous section). A spherical (diameter 250 mm) plexiglas phantom (Siemens, Erlangen, Germany) filled with water was used. A series of images (GRE, TE=2.6 ms, TR=5.1 ms, 64×64, 4.1 mm resolution) was acquired at multiple slice orientations, centered at isocenter. For each slice orientation, multiple images, each with a circular virtual bolus (with diameter 20 mm) in a different location, were acquired. Image processing was used to extract the center of the bolus from the acquired images
Flow visualization in animals with normal cardiac structure
Virtual Dye Angiography was used with SSFP imaging to visualize flow in a pig’s heart in multiple anatomical locations. To visualize flow from the left atrium into the left ventricle an imaging slice was positioned with a long-axis view of a pig’s heart and the virtual bolus was positioned in the left atrium. A bolus was placed in the left ventricle to visualize flow into the aorta with a long-axis imaging slice. To visualize flow from the right ventricle into the pulmonary artery two imaging slices were used — the first slice through the RV and the second slice through the pulmonary arteries, and the virtual bolus was placed perpendicular to the first slice in the RV.
Flow visualization through an Atrial Septal Defect
An atrial septal defect (ASD), a hole in the septum between the left and right atria, which enables flow of blood from the left to the right side of the heart, was created in a pig. Virtual Dye Angiography with SSFP imaging was performed before and after the ASD was created. The imaging slice was positioned with a short-axis view in the vicinity of the ASD. The experiment was performed on two animals.
Flow visualization in healthy human volunteer
Virtual Dye Angiography with SSFP imaging was used to visualize blood flow in a healthy human volunteer in two anatomical locations — in the aorta and from the LA to the LV.
Results
Computational Modeling
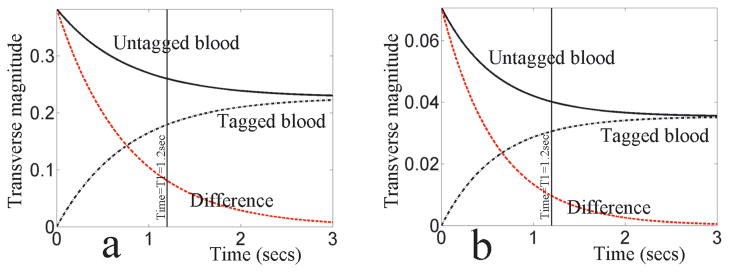
Figure 4 shows the results of modeling the contrast behavior of Virtual Dye under SSFP, in Figure 4(a), and spoiled GRE, in Figure 4(b). The parameters used were TR=3 ms, and T1=1200 ms. For SSFP a flip-angle of 45° was used and for GRE the Ernst angle of 4° was used as the flip angle. Both plots show the transverse magnitude, over time, of protons in blood with (black dot-dashed line) and without (black solid line) the Virtual Dye saturation. At time t=T1, the contrast of the Virtual Dye (the red dashed line i.e., the difference between the transverse magnitude of the spins with and without the Virtual Dye saturation) is 20% of the contrast at time t=0 in the case of SSFP and 14% in the case of GRE. Note that the magnitude of the MR signal is lower in the case of GRE than in SSFP.
Figure 4.
VDA signal evolution under (a) SSFP and (b) GRE. The untagged blood is denoted by the solid black line, the tagged blood is denoted by the dot-dashed black line and the difference between the two (the Virtual Dye contrast) is denoted by the dashed red line. After a time of T1, the contrast is 20% of its initial value under SSFP and 14% of its initial value under GRE.
Experiments
Phantom experiment: water bath
Figure 5(a) and (b) show the results of the water bath experiment in which Virtual Dye Angiography was demonstrated with SSFP imaging. Figure 5(a) shows the slice, with a coronal view, in still water and Figure 5(b) shows the slice in moving water. The virtual bolus is perpendicular to the imaging slice. Note that the motion of the saturated spins reflects the motion of the swirling water.
Figure 5.
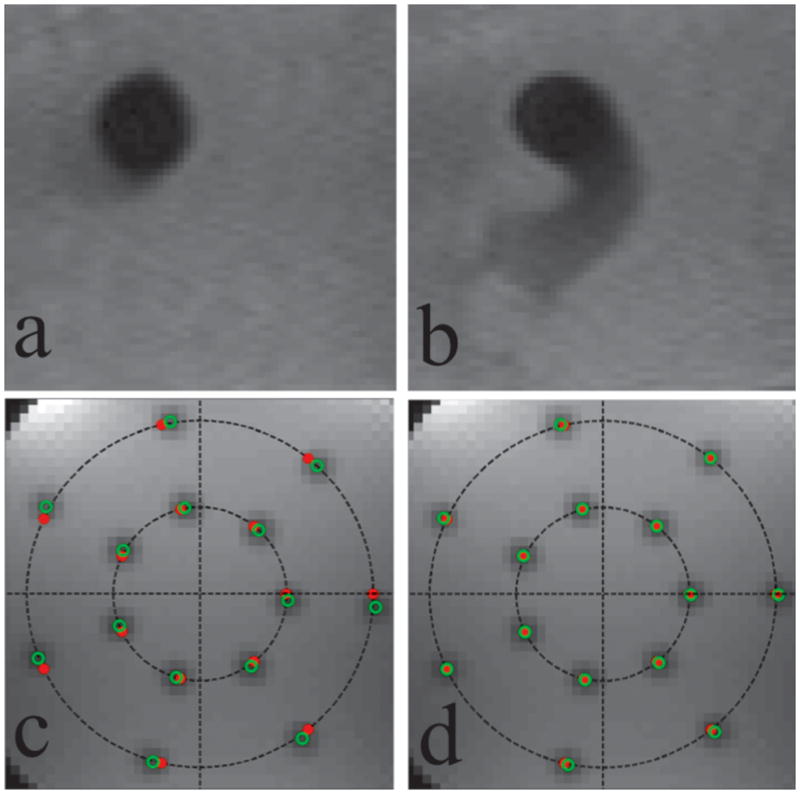
Phantom Experiments. The first row shows the virtual bolus in the water bath experiment in (a) still water and (b) swirling water. The second row shows a representative slice orientation from the hardware delay distortion correction experiment before (c) and after (d) the RF delay correction is applied. Shown are the actual (solid red dots) and intended (open green dots) virtual bolus centers. Before the RF delay correction is applied the actual boluses are distorted from their intended locations by a 3° rotation about isocenter. This distortion is overcome by the use of the RF delay.
Phantom experiment: correcting the distortion due to hardware delays
Figure 5(c) and (d) show images from the demonstration of the RF delay correction. The series of images, acquired in multiple orientations, have slice normals that are distributed in a transversely oriented hemisphere — uniformly distributed in azimuthal angle and elevation angle. The intended locations of the boluses are on seven equiangular points on two concentric circles with radii 40 mm and 80 mm. Figure 5(c) shows a representative slice orientation before the RF delay correction was applied. The images displayed combine all the slices at this orientation by taking a pixel-wise minimum across the slices. The intended bolus centers are denoted by the solid red dots and the actual bolus-centers are denoted by the open green dots. The actual bolus-centers were automatically extracted from the acquired images by first computing the absolute difference image of an acquired image and its successor (in order to produce positive contrast in the region of the virtual bolus) and then computing the centroid of a subimage in the intended vicinity of the bolus. As can be seen here, in all orientations there was found to be a rotation about isocenter of approximately 3°. Figure 5(d) shows the corresponding slice after the RF delay correction (−7 μs) was applied.
Flow visualization in animals with normal cardiac structure
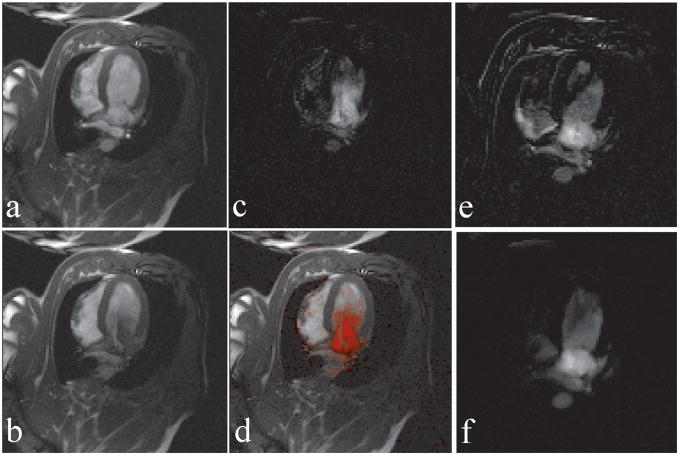
Figure 6 shows the method at work with real-time SSFP in a pig. The Virtual Dye module is played before every image is collected. Figure 6(a) shows the imaged slice, with a long-axis cardiac view, when the Virtual Dye is not present. Figure 6(b) shows the slice when a virtual bolus of 25 mm diameter is placed in the left atrium. Notice that at the displayed time point the bolus has traveled partially into the left ventricle. Figure 6(c) and (d) demonstrate the subtraction visualization mode. Figure 6(c) shows the subtraction image corresponding to Figure 6(b). In Figure 6(d) the subtraction image is color blended into the Virtual Dye image.
Figure 6.
Virtual dye angiography with subtraction (a) A real-time image without Virtual Dye, (b) a real-time image with Virtual dye, (c) the difference image corresponding to (b) produced in the subtraction visualization mode, and (d) the difference image blended into the real-time image from (b). (e) A difference image displaying the artifact due to misregistration caused by respiratory motion (f) Suppression of the artifact in (e) using the “interpolation-and-subtraction” visualization mode that combines images from multiple cardiac cycles.
Figure 6(e) and (f) show how the artifact in the subtraction image due to respiratory motion can be suppressed by averaging over multiple cardiac cycles. Figure 6(e) shows the image created in subtraction visualization mode. Due to the misregistration of the real-time Virtual Dye image relative to the background image, the image incorrectly contains bright pixels outside the region of the virtual bolus. Figure 6(f) shows an image at the same heart phase produced by the interpolation-and-subtraction visualization mode. Here the motion artifact is suppressed because both the Virtual Dye image and the background image are interpolated from multiple cardiac cycles based on the ECG information.
Figure 7 shows the visualization of flow from the right ventricle into the pulmonary vessels using two imaging slices — slice #1 (top row) through the RV and slice #2 (bottom row) through the main pulmonary artery (MPA). The two slices are acquired in a repetitive, sequential manner (i.e. slice #1, slice #2, slice #1,…) and the Virtual Dye module is played before every time slice #1 is acquired. The first column shows when Virtual Dye is enabled, the second column shows corresponding slices and cardiac phases in which Virtual Dye is disabled, and the third column shows the difference between the first two columns using the same grayscale display window. Notice that the virtual bolus is strongly visible in slice #2 (in the MPA in Figure 7(d)). Since TR=2.8 ms, the number of phase-encoding lines is 128, and no parallel imaging is used, the time between the playing of the virtual dye saturation module and the acquisition of the center of k-space of slice #2 is 537 ms (=1.5 × 128 × 2.8 ms). This shows that the bolus persists for at least 537 ms after the saturation module is played.
Figure 7.
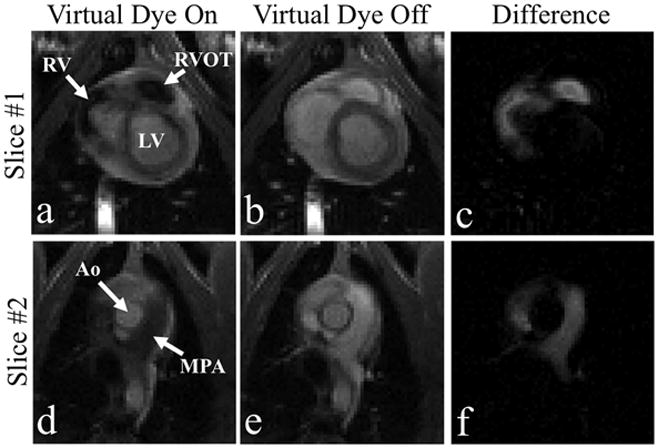
Flow from the RV to the MPA is visualized in the “raw” mode using two imaging slices. Slice #1 (top row), positioned through the RV, and Slice #2 (bottom row), positioned through the MPA. The left column corresponds to image frames in which Virtual Dye is enabled. For comparison the center column shows frames at corresponding cardiac phases when the Virtual Dye is disabled and the right column displays the difference of the first two columns.
Figure 8 shows the visualization of flow from the left ventricle to the aorta. Rate-4 parallel imaging and the interpolation-and-subtraction visualization mode are used. A 25 mm-diameter virtual bolus is placed in the left ventricle and the Virtual Dye module is played before every image is acquired. Figure 8 shows both the color-blended (left column) and the raw difference (right column) for a diastolic (top row) and a systolic (bottom row) heart phase. The method is able to capture flow from the aorta into the arch vessels.
Figure 8.
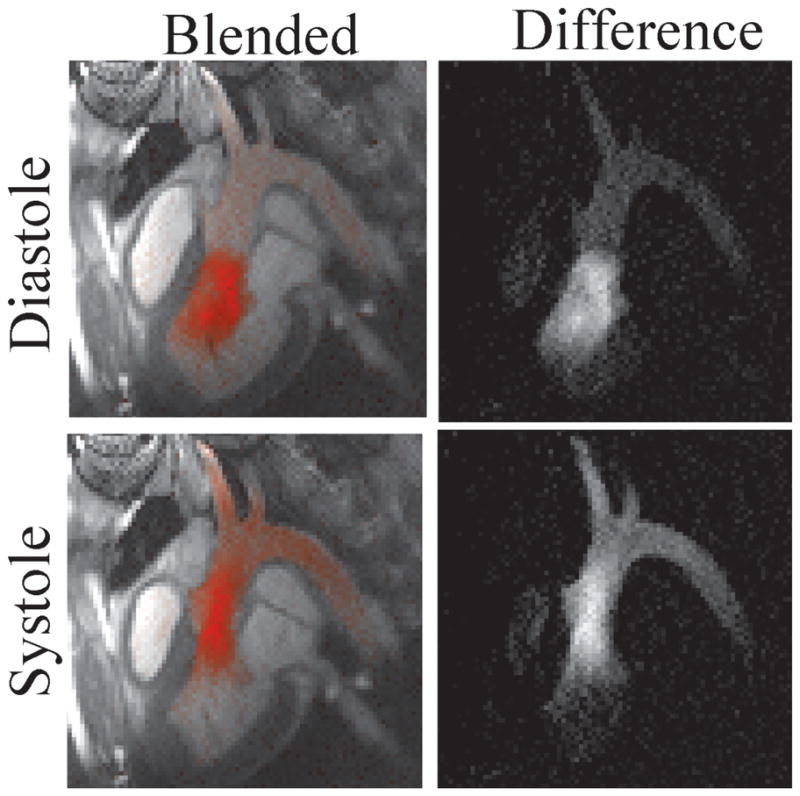
Flow from the LV to the Aorta and the arch vessels is visualized using the “interpolation-and-subtraction” visualization mode i.e., interpolation over multiple heartbeats and subtraction.
Flow visualization through an Atrial Septal Defect
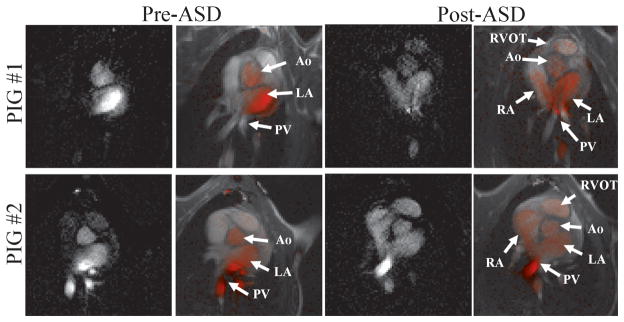
Figure 9 shows the results of the two porcine experiments in which an atrial septal defect was created. The results of the first experiment are in the top row and the results of the second experiment are in the bottom row. The left two columns show the heart before the ASD was created and the right two columns show it after the ASD was created. The images displayed are both the raw subtraction images and the corresponding images in which the subtraction image is color-blended into the Virtual Dye image. Before the creation of the ASD only the left side of the heart (pulmonary veins, left atrium and aorta) is seen to contain the virtual bolus. After the ASD is created the virtual bolus is seen to flow from the left side of the heart into the right side, and is seen inside the right atrium and even the right ventricular outflow tract. The subtraction images are able to display these subtle flows even when hard to see in the raw Virtual Dye images.
Figure 9.
VDA visualization of atrial septal defects in a porcine model in two animals: Before the ASD is created (left two columns) the virtual bolus is seen in the left side of the heart (pulmonary veins, left atrium and Aorta). After the ASD is created (right two columns) the virtual bolus moves through the ASD into the right atrium and is seen in the right ventricular outflow tract.
Flow visualization in healthy human volunteer
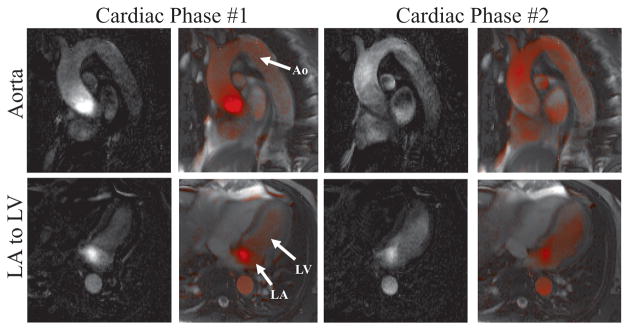
Figure 10 shows the visualization of flow in two anatomical locations in a normal human volunteer. Rate-2 parallel imaging and the interpolation-and-subtraction visualization mode are used. Both the raw difference (first and third column) and the corresponding color-blended (second and fourth columns) images are shown. The upper row shows results from the first experiment, in which a slice is placed through the aorta and the virtual bolus is positioned near the aortic valve, in a diastolic phase (left two columns) and a systolic phase (right two columns). The lower row shows images for two cardiac phases from the second experiment, in which a single slice is positioned with a four-chamber view of the heart and the virtual bolus moves from the LA to the LV.
Figure 10.
VDA visualization in a normal human volunteer using the “interpolation-and-subtraction” visualization mode. In experiment #1 (upper row) flow is visualized in the aorta and in experiment #2 (lower row) flow is visualized from the LA to the LV. Color-blended and the corresponding raw difference images are shown for two cardiac phases from each experiment.
Discussion
We have developed a fully interactive, real-time non-invasive method for visualizing the flow of blood. In a workflow that resembles catheter-based X-ray angiography, contrast is delivered into specific cardiovascular chambers and its movement is observed. What makes Virtual Dye Angiography especially suitable for interventional imaging is that it is a) easy to use, b) quick to apply, c) non-disruptive of workflow, and d) compatible with the anatomical imaging used to guide the intervention such that the operator never loses image guidance during the intervention.
For increased contrast, ECG-synchronized subtraction images can be computed and displayed in real-time. To address the respiratory motion artifact that affect some of these subtraction images, interpolation and averaging over multiple cardiac cycles can be performed, and the resulting images displayed with a time-delay of a few seconds. The image subtraction makes colorization and overlay of the flow onto the real-time image very simple and requires no extra image processing. While the subtraction modes provide excellent visualization, in practice the ability of the operator to simply toggle the saturation on and off interactively, while viewing the raw real-time images, has been found to be often useful. This effectively allows the user to perform the subtraction visually and avoids the misregistration artifacts involved in actual image subtraction. Steady-state free precession (SSFP) imaging is favored for anatomical cardiac imaging, primarily because of its high SNR and the high blood-tissue contrast. Virtual Dye Angiography, being fully compatible with SSFP, allows the anatomical imaging to be undisrupted. In SSFP one or more preparation RF pulses (21) are played before the acquisition of data in order to reduce the time taken to reach steady-state. In our implementation these preparation pulses, and corresponding closing pulses, are used at the start, and end respectively, of the acquisition of every slice or image frame even in single-slice imaging. Because the Virtual Dye module is played before the preparation pulses and after the closing pulses, it does not affect the steady-state of the non-saturated spins in the SSFP imaging sequence.
While the excitation k-space analysis (16) used to design the 2D RF pulse is based on an analysis of small flip-angle excitations, for k-space trajectories that can be decomposed into a series of inherently refocused small-tip angle excitations the analysis still holds for large tip-angles (22). Since the spiral trajectory approximately satisfies these conditions it can be used to perform large flip-angle (90°) excitations.
From the excitation k-space framework (16) it is easy to see that a relative delay between the RF pulse and the gradients can cause distortions of the shape and location of the virtual bolus. For example if the gradient delays cause the actual trajectory to be rotated, in k-space, with respect to the intended trajectory, the excited column (and virtual bolus) will be rotated about the isocenter. While there are sophisticated methods (18) to calibrate and correct gradient delays, for our application the problem is simplified because a) the same gradient waveform is used in every instance regardless of the imaging parameters used (such as resolution and field-of-view) and b), unlike in spiral imaging, moderate distortions to the shape of the virtual bolus can be tolerated. As seen in Figure 5, introducing a corrective delay to the start of the RF pulse can rectify the bulk of this distortion.
Virtual Dye Angiography has several advantages over other reported flow visualization methods. In SSFP, flow can actually be visualized directly by observing the artifacts (jets) caused by fast-moving spins being dephased. While this method is real-time and does not disrupt the real-time workflow, it is not robust. The visualization of the artifact is dependant on the size of the structure through which the blood is flowing and the speed of the flow and is therefore only visible under limited conditions. Furthermore it requires the slice to be positioned precisely through the structure of interest, which is not necessary in Virtual Dye Angiography.
Phase-contrast velocity mapping, the most widely used flow visualization method, requires too much data, in its conventional form, to be suitable for interventional real-time guidance. While real-time PC color flow(5) provides visualization of the flow velocity in a single flow direction, determining where blood flows to from a particular location would probably require the acquisition of 4D PC velocity mapping data (6,7) and the application of particle tracing. Another limitation of PC is that it is not well-suited to incorporation into SSFP sequences due to the complicated dynamics of magnetization reuse (23). Because of this complexity, while it has been investigated (24–26) in a limited research context, PC under SSFP has not yet been widely adopted.
The method used to tag the blood in Virtual Dye Angiography— a 90° excitation followed by a dephasing gradient, is similar to that used by Edelman et al (9) to study flow in the portal venous system. The primary difference is the use, in (9), of 1D-selective excitations to saturate a 2D slice rather than a 2D-selective excitation to saturate a more localized, targeted region. The disadvantage of using a less targeted saturation region is that blood in vessels and chambers that are far away from the anatomy of interest can be tagged causing contamination of the image. This would likely limit its application in the complex anatomy of the heart.
GCFP (13) also uses a non-local 2D slice as the saturation region. Furthermore the contrast outside the saturation region (“excitation slice” in (13)) decays more quickly than in Virtual Dye Angiography or in (9). While the exponential decay has a time-constant of less than T2 in GCFP, the time-constant in this work and (9) are on the order of T1 (as seen in Figure 4). The in vivo “persistence time”, reported to be 200 ms for GCFP (13), is greater than 500 ms in Virtual Dye Angiography (as seen in Figure 7) and allows for the flowing blood to be visualized over larger distances. Moreover, GCFP requires a modification of the imaging sequence and can only be used with gradients satisfying certain conditions, in order to maintain the coherence of the tagged spins, while the modular nature of Virtual Dye Angiography allows it to be used with a wide variety of imaging sequences (including SSFP, GRE, and multiple k-space trajectories). Furthermore, because GCFP only tags moving spins it would not provide anatomical context in the way Virtual Dye Angiography does. It is also unclear if spins that move out and in of the imaging plane will still appear tagged or will fade because of loss of coherence.
2D-selective excitations have been used before for tagging blood. Stuber et al (15) use 180° 2D-selective excitations for 3D coronary imaging. The novelty of Virtual Dye Angiography, which unlike (15) uses a 90° excitation followed by a dephasing gradient, lies in the introduction of 2D-selective tagging into the interventional imaging context.
A notable feature of the method is that it explicitly demonstrates where blood travels to rather than the velocity of blood. Consequently, the flow through an anatomical location (such as a defect or lesion) can be visualized without actually positioning the imaging slice through the anatomy of interest allowing for the visualization of flow through structures through which precise slice positioning is difficult. For example, flow through a shunt can be visualized by placing the virtual bolus upstream of the shunt and placing the imaging slice downstream. It is also possible to use multiple boluses to visualize flow from multiple entry vessels. The placement of the virtual bolus can be finely synchronized with the ECG signal if necessary to explore blood flow in a specific phase of the cardiac cycle or finely synchronized with the image acquisition in order to explore the temporal evolution of the flow. Boluses can be placed in anatomical regions that are normally hard to access via catheterization (such as the left atrium). While this paper is focused on interventional imaging, the method might also be useful in diagnostic flow visualization applications
A limitation of Virtual Dye Angiography is that it does not provide quantitative information like PC. While it might be possible to extract quantitative information using image processing, it would not be trivial and it was not explored in this work. Another limitation is that the use of ECG-synchronized subtraction for visualization will fail if there is substantial arrhythmia or beat-to-beat variation. In such cases, the raw visualization mode would be the primary way to observe the flow patterns. Another scenario in which Virtual Dye Angiography might be less effective is in and around regions with artifacts, such as due to embedded metal devices, which result in reduced signal in the background image. Turbulent flow or the substantial mixing of tagged and untagged blood would also probably reduce the contrast of Virtual Dye Angiography, but it performs adequately in the presence of the mixing of a tagged and untagged blood stream near an ASD as seen in Figure 9.
The imaging resolution of Virtual Dye Angiography is largely limited by that of the imaging sequence used. In subtraction visualization modes the resolution and accuracy would degrade with increased motion and aperiodicity. The shape of the virtual bolus is currently limited to 2D-selective excitations i.e. columns that are “infinite” in one direction. A 3D-selective excitation would be prohibitively time consuming, but the use of parallel transmission methods (27,28) might, in the future, allow for boluses that have arbitrary 3D shapes.
Conclusions
We have introduced a method for flow visualization that is fully interactive and integrated into a real-time MR imaging system. Targeted at MRI-guided interventions, we have demonstrated its use in a normal human volunteer and in the visualization of an atrial septal defect in a porcine model.
Acknowledgments
This work is supported by the Division of Intramural Research, National Heart Lung and Blood Institute, National Institutes of Health USA (Z01-HL006039-01). We thank Victor Wright and Kathy Lucas for help with performing the in-vivo experiments. We thank Peter Kellman for sharing software to read the raw MR data.
Footnotes
Disclosures: NIH and Siemens Medical Systems have a collaborative research and development agreement for interventional cardiovascular MRI. Kanishka Ratnayaka serves without compensation on a Siemens Pediatric Advisory Council.
References
- 1.Ratnayaka K, Faranesh AZ, Guttman MA, Kocaturk O, Saikus CE, Lederman RJ. Interventional cardiovascular magnetic resonance: still tantalizing. J Cardiovasc Magn Reson. 2008;10:62. doi: 10.1186/1532-429X-10-62. [DOI] [PMC free article] [PubMed] [Google Scholar]
- 2.Saikus CE, Lederman RJ. Interventional cardiovascular magnetic resonance imaging: a new opportunity for image-guided interventions. JACC Cardiovasc Imaging. 2009;2(11):1321–1331. doi: 10.1016/j.jcmg.2009.09.002. [DOI] [PMC free article] [PubMed] [Google Scholar]
- 3.Lee VS. Cardiovascular MRI: physical principles to practical protocols. Lippincott Williams & Wilkins; 2005. [Google Scholar]
- 4.Nayler GL, Firmin DN, Longmore DB. Blood flow imaging by cine magnetic resonance. J Comput Assist Tomogr. 1986;10(5):715–722. doi: 10.1097/00004728-198609000-00001. [DOI] [PubMed] [Google Scholar]
- 5.Nayak KS, Pauly JM, Kerr AB, Hu BS, Nishimura DG. Real-time color flow MRI. Magn Reson Med. 2000;43(2):251–258. doi: 10.1002/(sici)1522-2594(200002)43:2<251::aid-mrm12>3.0.co;2-#. [DOI] [PubMed] [Google Scholar]
- 6.Wigstrom L, Ebbers T, Fyrenius A, Karlsson M, Engvall J, Wranne B, Bolger AF. Particle trace visualization of intracardiac flow using time-resolved 3D phase contrast MRI. Magn Reson Med. 1999;41(4):793–799. doi: 10.1002/(sici)1522-2594(199904)41:4<793::aid-mrm19>3.0.co;2-2. [DOI] [PubMed] [Google Scholar]
- 7.Wigstrom L, Sjoqvist L, Wranne B. Temporally resolved 3D phase-contrast imaging. Magn Reson Med. 1996;36(5):800–803. doi: 10.1002/mrm.1910360521. [DOI] [PubMed] [Google Scholar]
- 8.Nishimura DG, Macovski A, Pauly JM, Conolly SM. MR angiography by selective inversion recovery. Magn Reson Med. 1987;4(2):193–202. doi: 10.1002/mrm.1910040214. [DOI] [PubMed] [Google Scholar]
- 9.Edelman RR, Zhao B, Liu C, Wentz KU, Mattle HP, Finn JP, McArdle C. MR angiography and dynamic flow evaluation of the portal venous system. AJR Am J Roentgenol. 1989;153(4):755–760. doi: 10.2214/ajr.153.4.755. [DOI] [PubMed] [Google Scholar]
- 10.Foo TK, Perman WH, Poon CS, Cusma JT, Sandstrom JC. Projection flow imaging by bolus tracking using stimulated echoes. Magn Reson Med. 1989;9(2):203–218. doi: 10.1002/mrm.1910090206. [DOI] [PubMed] [Google Scholar]
- 11.Detre JA, Leigh JS, Williams DS, Koretsky AP. Perfusion imaging. Magn Reson Med. 1992;23(1):37–45. doi: 10.1002/mrm.1910230106. [DOI] [PubMed] [Google Scholar]
- 12.Macgowan CK, Henkelman RM, Wood ML. Pulse-wave velocity measured in one heartbeat using MR tagging. Magn Reson Med. 2002;48(1):115–121. doi: 10.1002/mrm.10177. [DOI] [PubMed] [Google Scholar]
- 13.Rehwald WG, Chen EL, Kim RJ, Judd RM. Noninvasive cineangiography by magnetic resonance global coherent free precession. Nat Med. 2004;10(5):545–549. doi: 10.1038/nm1027. [DOI] [PubMed] [Google Scholar]
- 14.Shao X, Fei DY, Kraft KA. Rapid measurement of pulse wave velocity via multisite flow displacement. Magn Reson Med. 2004;52(6):1351–1357. doi: 10.1002/mrm.20298. [DOI] [PubMed] [Google Scholar]
- 15.Stuber M, Bornert P, Spuentrup E, Botnar RM, Manning WJ. Selective three-dimensional visualization of the coronary arterial lumen using arterial spin tagging. Magn Reson Med. 2002;47(2):322–329. doi: 10.1002/mrm.10042. [DOI] [PubMed] [Google Scholar]
- 16.Pauly J, Nishimura D, Macovski A. A K-Space Analysis of Small-Tip-Angle Excitation. Journal of Magnetic Resonance. 1989;81(1):43–56. doi: 10.1016/j.jmr.2011.09.023. [DOI] [PubMed] [Google Scholar]
- 17.Hardy CJ, Cline HE. Broadband nuclear magnetic resonance pulses with two dimensional spatial selectivity. Journal of applied physics. 1989;66(4):1513–1516. [Google Scholar]
- 18.Tan H, Meyer CH. Estimation of k-space trajectories in spiral MRI. Magn Reson Med. 2009;61(6):1396–1404. doi: 10.1002/mrm.21813. [DOI] [PMC free article] [PubMed] [Google Scholar]
- 19.Scheffler K. On the transient phase of balanced SSFP sequences. Magn Reson Med. 2003;49(4):781–783. doi: 10.1002/mrm.10421. [DOI] [PubMed] [Google Scholar]
- 20.Liang ZP, Lauterbur PC. Principles of magnetic resonance imaging: a signal processing perspective. IEEE press; 2000. [Google Scholar]
- 21.Hargreaves BA, Vasanawala SS, Pauly JM, Nishimura DG. Characterization and reduction of the transient response in steady-state MR imaging. Magn Reson Med. 2001;46(1):149–158. doi: 10.1002/mrm.1170. [DOI] [PubMed] [Google Scholar]
- 22.Pauly J, Nishimura D, Macovski A. A Linear Class of Large-Tip-Angle Selective Excitation Pulses. Journal of Magnetic Resonance. 1989;82(3):571–587. [Google Scholar]
- 23.Gatehouse PD, Keegan J, Crowe LA, Masood S, Mohiaddin RH, Kreitner KF, Firmin DN. Applications of phase-contrast flow and velocity imaging in cardiovascular MRI. Eur Radiol. 2005;15(10):2172–2184. doi: 10.1007/s00330-005-2829-3. [DOI] [PubMed] [Google Scholar]
- 24.Markl M, Alley MT, Pelc NJ. Balanced phase-contrast steady-state free precession (PC-SSFP): a novel technique for velocity encoding by gradient inversion. Magn Reson Med. 2003;49(5):945–952. doi: 10.1002/mrm.10451. [DOI] [PubMed] [Google Scholar]
- 25.Overall WR, Nishimura DG, Hu BS. Fast phase-contrast velocity measurement in the steady state. Magn Reson Med. 2002;48(5):890–898. doi: 10.1002/mrm.10285. [DOI] [PubMed] [Google Scholar]
- 26.Pai VM. Phase contrast using multiecho steady-state free precession. Magn Reson Med. 2007;58(2):419–424. doi: 10.1002/mrm.21297. [DOI] [PubMed] [Google Scholar]
- 27.Katscher U, Bornert P, Leussler C, van den Brink JS. Transmit SENSE. Magn Reson Med. 2003;49(1):144–150. doi: 10.1002/mrm.10353. [DOI] [PubMed] [Google Scholar]
- 28.Zhu Y. Parallel excitation with an array of transmit coils. Magn Reson Med. 2004;51(4):775–784. doi: 10.1002/mrm.20011. [DOI] [PubMed] [Google Scholar]


