Abstract
Traveling-wave MRI utilizes far fields of a single-piece patch antenna in the magnet bore to generate RF fields for imaging large-size samples, such as the human body. In this work, the feasibility of applying the “traveling-wave” technique to parallel imaging is studied using microstrip patch antenna arrays with both the numerical analysis and experimental tests. A specific patch array model is built and each array element is a microstrip patch antenna. Bench tests show that decoupling between two adjacent elements is better than -26-dB while matching of each element reaches -36-dB, demonstrating excellent isolation performance and impedance match capability. The sensitivity patterns are simulated and g-factors are calculated for both unloaded and loaded cases. The results on B1− sensitivity patterns and g-factors demonstrate the feasibility of the traveling-wave parallel imaging. Simulations also suggest that different array configuration such as patch shape, position and orientation leads to different sensitivity patterns and g-factor maps, which provides a way to manipulate B1 fields and improve the parallel imaging performance. The proposed method is also validated by using 7T MR imaging experiments.
Keywords: Traveling-wave, finite-difference time-domain, parallel imaging, high field, MRI
INTRODUCTION
Parallel imaging technique is able to accelerate MR imaging by using the different sensitivity patterns of RF array elements to replace part of phase encoding, followed by a special reconstruction method based on the sensitivity information to recover the undersampled raw data to a correct image without aliasing(1–9). Based on the pioneering study of SMASH (1) and SENSE(2), various parallel imaging methods have been developed to achieve higher Signal-to-Noise Ratio (SNR) and better image quality for practical applications. These parallel imaging techniques have provided effective ways to make tradeoffs between the imaging speed and the SNR.
On the other hand, conventional MRI utilizes the near field of RF coils to excite and receive MR signals. In such a case, the amplitude and phase of standing wave within the imaging samples varies with the spatial position, especially in the case of surface coils that have a strong gradient field distribution, and in the case of ultrahigh magnetic field where the wavelength approaches the biological sample size. These variations in amplitude make image intensity inhomogeneous. In the imaging coverage, due to the large inductance and parasitic capacitance, it is technically challenging to design a large-size RF coil resonating at high frequency to cover the human body at high and ultrahigh fields(10–15). Recently the far field of a single piece patch antenna has been utilized along with the magnetic bore to excite and receive MR signals at 7T(16–18). By utilizing the traveling-wave whose intensity in the far field is constant along the spatial position in the magnet bore, comparatively homogeneous RF field can be achieved in a large area to cover the whole human body, making large field-of-view (FOV) imaging, particularly the signal excitation, convenient at ultra-high fields(17). Studies on whole-body traveling-wave MRI using simulation methods and MR imaging have also demonstrated that the traveling-wave MRI method has a unique capability of generating homogeneous RF fields over a large FOV and potentially helping acquisition of uniform whole-body MR imaging for clinical diagnosis(19).
Some studies on implementing parallel imaging using traveling-wave have recently been reported(20–24). In this work, we explore the possibility of extending the traveling-wave method to parallel imaging, an emerging MR imaging technique that is able to significantly increase the imaging speed with an acceptable SNR compromise, and facilitate the whole-body parallel imaging at ultrahigh fields. To implement the traveling-wave MR to parallel imaging, we propose a method using multiple microstrip patch antennas as the RF excitation and reception device. The performance of the traveling-wave parallel imaging proposed is investigated. For patch antennas, different patch shape, orientation, and even a different driven point on the same RF antenna, generate different magnetic field pattern and directivity(25). This feature would be beneficial to parallel imaging because it is able to provide a design flexibility to generate different sensitivity profile from each patch antenna element, resulting in a good geometry factor (g-factor)(2). The Finite-Difference Time-Domain (FDTD) algorithm (26–29) is employed to analyze the proposed parallel traveling-wave MRI system. A standard human head is modeled within a copper cylinder to mimic the magnetic bore which acts as a waveguide in the “traveling-wave” MRI. A 4-element transceiver patch antenna array resonating at 298MHz is modeled as the RF source (for signal excitation) and also the receive device. Each patch element is a nearly square ring microstrip patch antenna and the feed port is along the diagonal (23,30,31). The B1− profile of each patch element and the g-factor maps are evaluated for both unloaded and loaded cases. To further verify the decoupling between the elements and the parallel imaging performance, a two-element patch array with the same element structure as that in the traveling-wave array has also been built and validated by using network analyzer and MR experiments. MR imaging of a human head phantom was performed by using a 7T MR scanner, and the MR images were reconstructed for both axial and sagittal planes using SENSE (2) and GRAPPA (5) methods. Moreover, simulations also demonstrate that different patch array configurations lead to different B1 profiles and g-factor maps, which alter the performance of parallel imaging.
MATERIALS AND METHODS
1. FDTD model of traveling-wave array in unloaded case
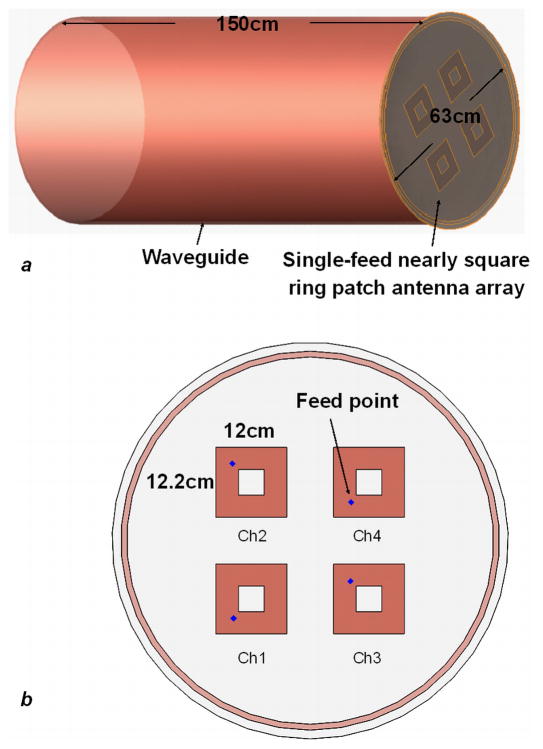
The software xFDTD6.4 (Remcom Inc. State College, PA) was used to build the model of the traveling-wave patch array and evaluate its performance. As shown in Figure 1a, a cylindrical copper bore with 63 cm ID, 65 cm OD and 150 cm length acted as a waveguide was chosen to mimic the magnetic bore of the GE 7T whole body MR scanner used in this study. The cutoff frequency of a 63-cm diameter waveguide is 278.9MHz, which well supports the wave propagation at the proton Larmor frequency of 7 Tesla (298.2MHz for our 7T scanner). The length of the copper bore was reduced from the magnet bore length ~300 cm to 150 cm to reduce the simulation time to an acceptable level. On one end of the copper bore the 4-element antenna array was built as the source of RF field and also as a receiver of MR signals, as shown in Figure 1b. Each element was a nearly square ring microstrip patch antenna made from copper foil and low-loss dielectric materials(30,31). This type of nearly square ring patch antenna is commonly used for signal transmission and reception in telecommunications. The resonant frequency of the antenna is inversely proportional to the size of the square slot, and its size is determined by sweeping frequency using Gaussian waveform. The outer dimension of the ring was fixed at 12.2 cm by 12 cm, while the inner dimension was a square with 4.4 cm side length, which yielded the resonant frequency of approximately 298.5 MHz, the proton Larmor frequency of our whole body 7T MR system. The feed point of the patch antennas was along the diagonal and was very close to the square slot to ensure the required impedance match. These 4 elements were equispaced with neighboring distance of 8 cm. Relatively large permittivity 13.1 of the antenna substrate was used in this model. It helps reduce the size of the patch antenna to a reasonable range for this study. The material with a permittivity of 13.1 is commercially available. The coaxial cables connected to the feed ports were modeled as series voltage sources with 50 ohm impedance. The Yee cell (26) was 1 mm on transverse plane and 5 mm along the longitudinal axis, which was small enough for satisfying the simulation accuracy. The boundary condition was set as Perfectly Electric Conductor (PEC) at the ground plane of the patch antenna. For the other boundaries the Perfectly Matching Layers (PML) was applied. To ensure the calculation stability and accurate performance of the PML absorbing boundaries, free space padding with 20 Yee cells were placed between each PML boundary and the conducting materials. In Figure 2 the PEC boundary is indicated using white dashed line while the PML boundaries are indicated using orange dashed lines.
Figure 1.
Traveling-wave array model: (a) copper waveguide to model the magnet; (b) Original patch array configuration: 4-element nearly square ring microstrip patch array acts as RF source and signal-receiving device.
Figure 2.
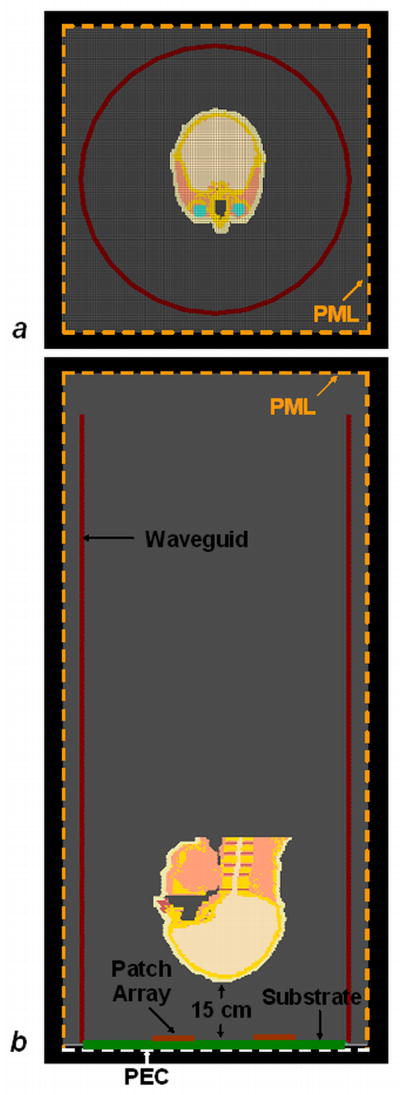
A standard human head model positioned at 15-cm array from the patch antenna array in the waveguide is modeled to investigate the behavior and performance of the traveling-wave parallel imaging: (a) axial plane view; (b) sagittal plane view. Given the physical size of the patch antenna array employed in this study, the field at 15cm or beyond is considered “far field” based on the far-field criteria Eq. 1. The orange dashed lines denote the Perfect Matching Layer (PML) boundaries, while the white dashed line denotes the Perfect Electric Conductor (PEC) boundaries which acted as the ground.
The Gauss waveform was used to sweep frequency to determine the dimension of the square slot cut and evaluate the decoupling between array elements. The stop criteria were that the calculation converged to −35 dB or reached the maximum iteration number of 106. Then, the sinusoid waveform was used to calculate the B1− field distributions and the stop criteria were that the sinusoid waveform period reached 65 which were enough to reach steady state. For traveling-wave MRI, we are more interested in the B1 distributions of the far field within the waveguide. The far field definition used in this work followed the Fraunhofer distance:
| [1] |
where D is the largest dimension of the antenna and λ is the wavelength of RF wave. If the distance between the transmitter and imaging object is larger than d, it is considered far field. Based on the dimension of our proposed patch array, the far field distance d was approximately 6 cm. Therefore, to ensure far field measurement, the B1− distributions of axial plane from 25 cm to the end of the waveguide were simulated and the g-factors for 1D SENSE reconstruction were calculated to demonstrate the parallel imaging performance at different positions. The g-factor can be calculated using(2):
| [2] |
where ρ denote the index of voxel in the FOV, and S is the reduced Fourier encoding. ψ is the noise correlation matrix between channels. The g-factor is strongly depends on the voxel position and is directly related to SNR(2):
| [3] |
where R is the reduction factor (or acceleration factor). This relationship means the SNR of the accelerated image is inversely proportional to the g-factor. The larger the g-factor, the worse the parallel imaging performance is.
2. FDTD model of traveling-wave array in loaded case
A standard human head model was modeled within the copper waveguide which is shown in Figure 2. The head was placed at 15 cm away from the patch antenna array to ensure that the far field of the array was used to excite the MR signal. The setups of the waveguide and the patch array were the same as those of the array configuration 1 (shown in Figure 1b) in unloaded case. The Yee cell within the head model was 1 mm on transverse plane and 3.9 mm along the longitudinal axis to meet the accuracy requirement of the head model. For the other part in the waveguide, the Yee cell size was the same as that used in the unloaded case, i.e. 1mm by 5mm. The boundary conditions were the same as those used in unloaded case. The parameter settings for convergence kept unchanged. The B1− field distribution within the human head model was simulated and the B1− field distributions were calculated for each element. Then the noise correlation matrix in Eq.[2] was estimated by using the correlation coefficients among the B1− field pattern of each element (2,9). Noise matrix can also be calculated using the electric transmit fields (32–34) if the noise are predominantly from thermal motion of charges in the sample (35). Finally, the g-factor maps at different reduction factors were calculated and plotted to demonstrate the parallel imaging performance in loaded case.
3. Design, construction and bench test of the patch antenna array
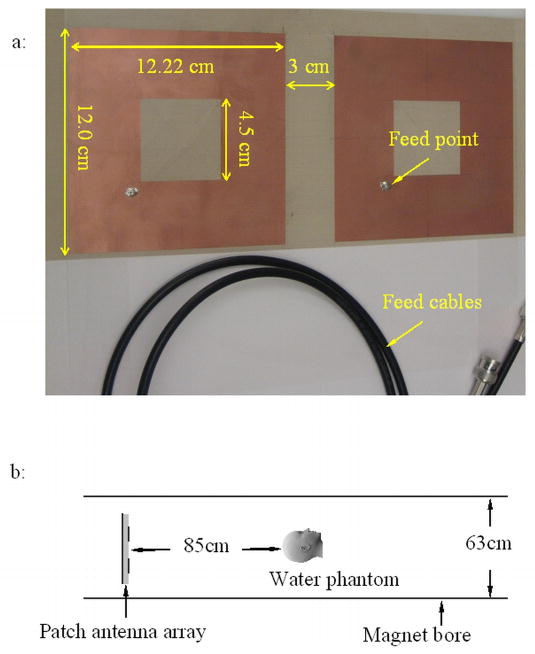
To further verify the performance of the proposed microstrip patch antenna array for the traveling-wave parallel imaging in terms of resonant frequency, impedance matching and element decoupling, a two-element patch antenna array was built as shown in Figure 3 and bench test was performed. Each element was a nearly square ring microstrip patch antenna made from copper foil and Duroid TMM 13I (Rogers Corporation, Chandler, AZ), low loss material with a permittivity of 13.1(30,31). The outer dimension of the ring was fixed at 12.2 cm by 12 cm, while the inner dimension was a square with 4.5 cm side length. The ground planes of the microstrip patch antenna elements were made from a single piece copper foil. The resonant frequency of this antenna is inversely proportional to the size of the square slot, the larger the slot size, the smaller the resonant frequency is. Therefore this square slot was carefully cut to make the frequency of the antenna be approximately 298 MHz. The feed point was along the diagonal and very close to the corner of the square slot to achieve acceptable impedance match. To obtain more convincible decoupling performance for the patch antenna array setup used in the proposed traveling-wave parallel imaging, the two antenna elements were placed much closer to each other (3 cm) than the gap used in the simulation model (8 cm). Bench test was performed using an Agilent E5070B network analyzer to evaluate the resonance frequency, impedance matching and electromagnetic decoupling between the elements in loaded case.
Figure 3.
(a) The single-feed nearly square ring patch array with two elements. The gap between the two elements is 3 cm, which is much smaller than that used in the simulation (8 cm). The decoupling is better than −26 dB while the match can reach −36 dB. (b) The MR experiment setup: the human head water phantom is 85 cm away from the patch antenna array and is placed at the center of the 63 cm diameter bore.
4. MR experiment validation
The proposed parallel traveling-wave technique using the microstrip patch antenna transceiver array was further validated by using 7T MR experiments. All the imaging experiments were performed on a General Electric (GE) 7 Tesla whole body MR scanner. The scanner was equipped with two transmit channels and two T/R switchers which were connected to our transceiver patch antenna array in this experiment. Figure 3b shows the detailed experiment setup. The patch antenna array was placed at the patient end of the magnetic bore. The imaging sample was a human head phantom which was placed approximately 85 cm away from the patch antenna array. Images of both the axial and sagittal planes of the head phantom were acquired with the traveling-wave patch antenna array by using gradient echo sequences. The acquisition parameters used were TE=3.2ms, TR=1000ms, matrix size =256×128, receiver bandwidth =31.3 kHz, field of view (FOV) =24cm, phase FOV = 1, slice thickness =5mm, slice spacing = 5mm, Average Number =10, and phase encoding direction is A/P. Total 10 axial slices and 8 sagittal slices were obtained.
In parallel imaging performance tests, two of the commonly used parallel imaging methods – SENSE and GRAPPA – were used for image reconstruction. In SENSE accelerated imaging the acceleration was applied to phase encoding direction and SENSE reconstruction with acceleration factor of 2 for each slice was performed. SENSE reconstruction with regularization method (9) was used to reconstruct the images. 48 central phase encoding lines were acquired to estimate the sensitivity maps and the reconstructed low resolution images were used as reference image for regularization. The sensitivity map of each channel was then estimated by dividing each channel’s individual pattern by their combined image. Finally, by using the Eq.[2] the g-factors for 1-D SENSE were also calculated to demonstrate the parallel imaging performance of the traveling-wave patch antenna array. In GRAPPA imaging, the acceleration was also applied to phase encoding direction and 48 Auto-Calibration Signal (ACS) lines in the center of the k-space were used to estimate the missing lines. The GRAPPA reconstruction with acceleration factor of 2 was performed to all the slices in both axial and sagittal planes. In addition, the reference image of each slice reconstructed from the sum of squares method from full k-space data were also calculated for comparison.
RESULTS
1. FDTD model of traveling-wave array in unloaded case
Figure 4 shows the conduction current density (J) on the patch antenna array surface. When only one element was fed, the currents induced on the other 3 elements were limited, indicating excellent decoupling performance among the elements. Figure 5 shows the B1− profiles (combination of x- and y- components) of 4 elements when fed individually. This axial plane was 25 cm away from the patch array and the FOV was 61 cm. Each element shows different B1− profile, making it possible to perform parallel imaging. At this axial plane the average g-factor for 1D SENSE at reduction factor R=2 can reach 1.12. Figure 6 shows the g-factor maps at R=2 and 3 for 12 different axial planes from 25 cm to 135 cm away from the antenna array. The row of ‘Mean g-factor for original array’ in Table 1 shows their corresponding g-factor average values. The g-factor maps varied with the targeted slice distance away from the patch array due to the propagation of the wave and the coupling between the array element and the waveguide.
Figure 4.
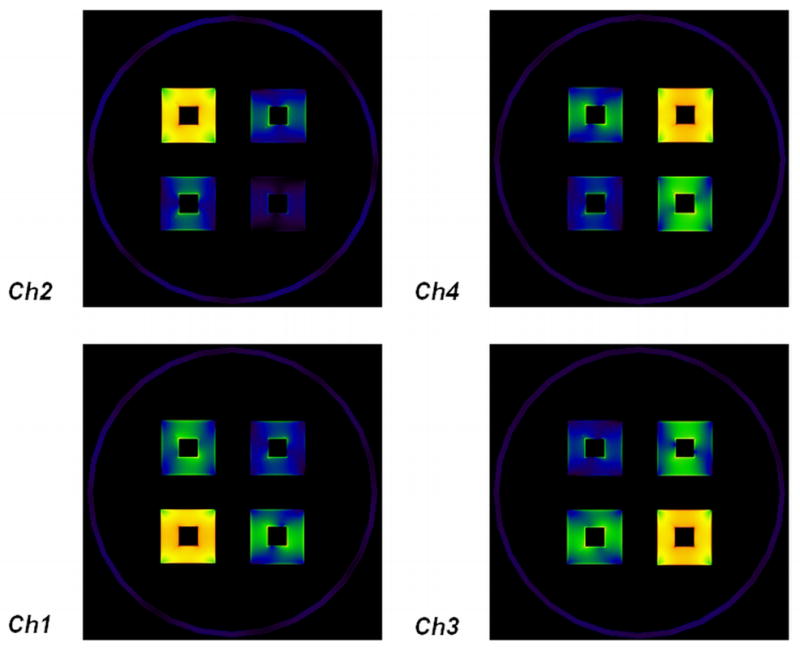
In unloaded case, the conduction current density J distribution on the array surface. When one element is fed individually, the currents induced on the other 3 elements are very small, indicating excellent isolation among elements.
Figure 5.
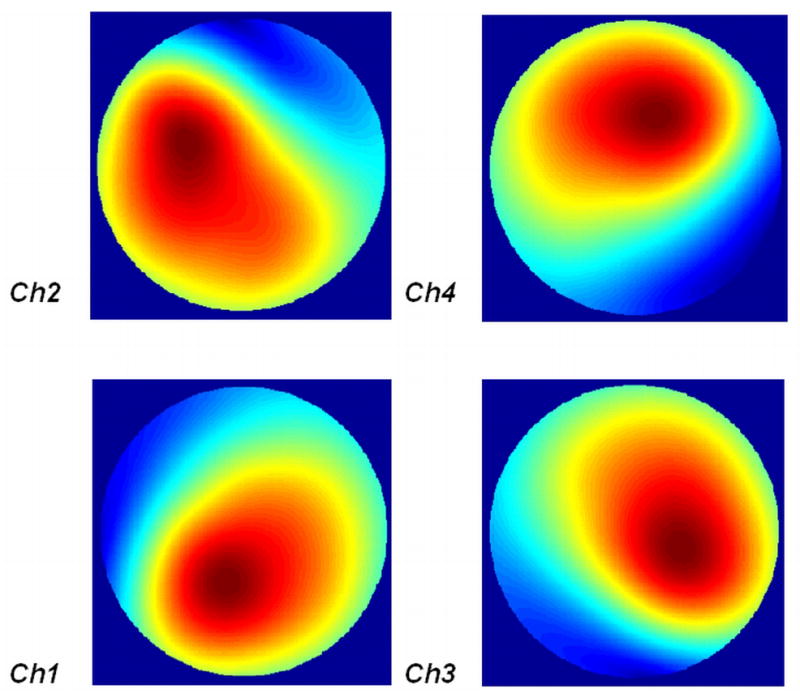
For the original array configuration in unloaded case, the B1− profiles are different from each other, making it possible to perform parallel imaging.
Figure 6.
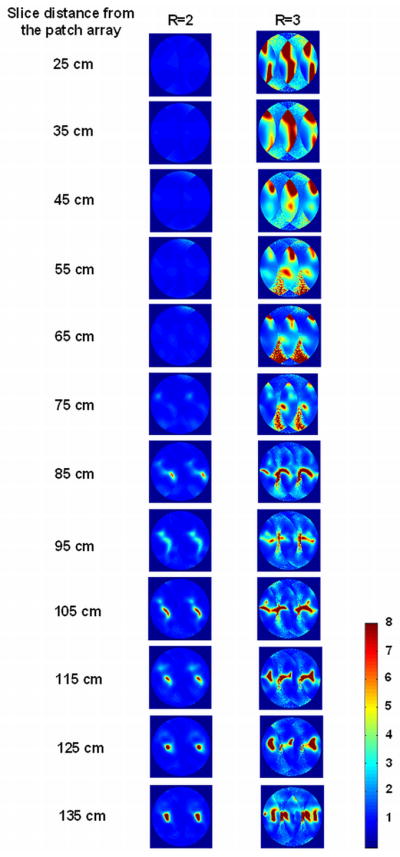
Simulation results: g-factor maps for 1D SENSE at reduction factor R of 2 and 3 for the original array configuration in unloaded case, regarding the average g-factors shown in Table 1. It is clearly shown that the g-maps vary with the position along the magnet.
Table 1.
In unloaded case simulation of both array configurations before and after rotating the two elements of the patch antenna array, the g-factors for 1D SENSE at 12 different axial planes (25cm to 135cm away from patch array), with reduction factor R of 2 and 3. Different array configurations lead to different g-factors; and the g-factors also vary with the distance between the targeted slice and the antenna array.
| Position z (cm) | 25 | 35 | 45 | 55 | 65 | 75 | 85 | 95 | 105 | 115 | 125 | 135 | |
|---|---|---|---|---|---|---|---|---|---|---|---|---|---|
| Mean g-factors for original array | R=2 | 1.12 | 1.12 | 1.15 | 1.18 | 1.18 | 1.25 | 1.47 | 1.46 | 1.51 | 1.52 | 1.54 | 1.68 |
| R=3 | 8.7 | 5.1 | 4.31 | 4.09 | 4.06 | 3.07 | 3.16 | 2.61 | 3.36 | 2.90 | 2.96 | 3.77 | |
| Mean g-factors for array after rotating two elements | R=2 | 1.30 | 1.22 | 1.20 | 1.19 | 1.21 | 1.26 | 1.27 | 1.25 | 1.25 | 1.23 | 1.22 | 1.20 |
| R=3 | 2.94 | 4.15 | 4.10 | 3.73 | 3.27 | 2.61 | 2.55 | 2.78 | 2.63 | 2.52 | 2.65 | 2.51 | |
2. FDTD model of traveling-wave array in loaded case
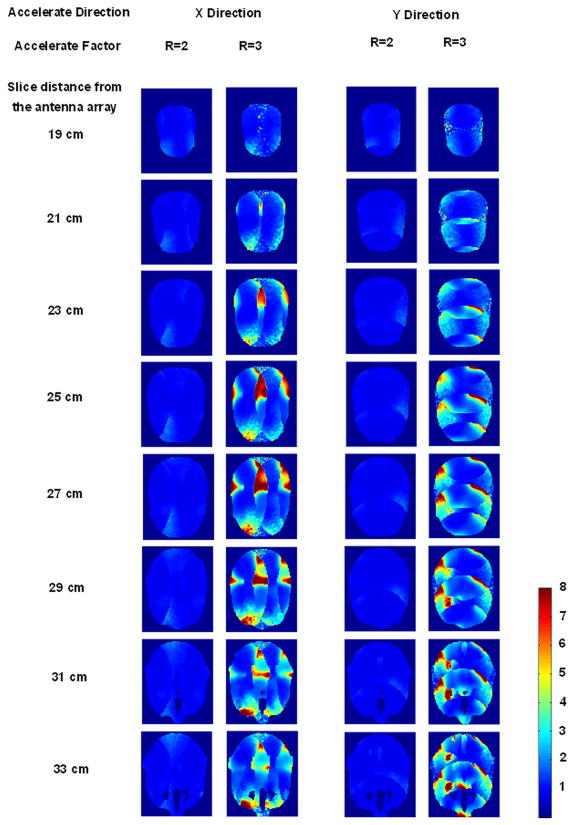
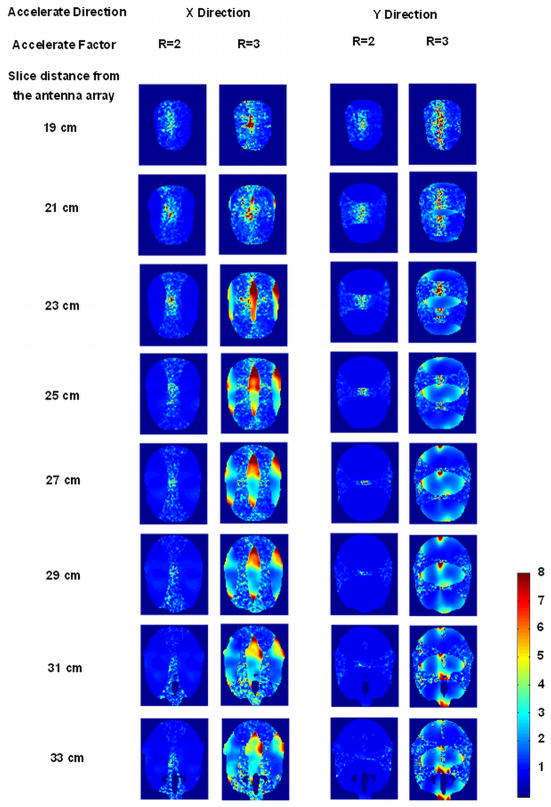
Figure 7 shows the individual B1− profile of each array element at 25 cm away from the antenna array. When loaded with high permittivity head model, the sensitivity patterns became highly asymmetric. This would lead to the improvement of parallel imaging performance. The average g-factors of 8 targeted slices from 19 cm to 33 cm at different reduction factor and 2 acceleration directions in loaded case are shown in the row of ‘Mean g-factor for original array’ in Table 2 and their corresponding g-maps are shown in Figure 8. The calculation results showed that when the system loaded with the head model, the g-factors were significantly improved over the unloaded case, especially in the high reduction factors.
Figure 7.
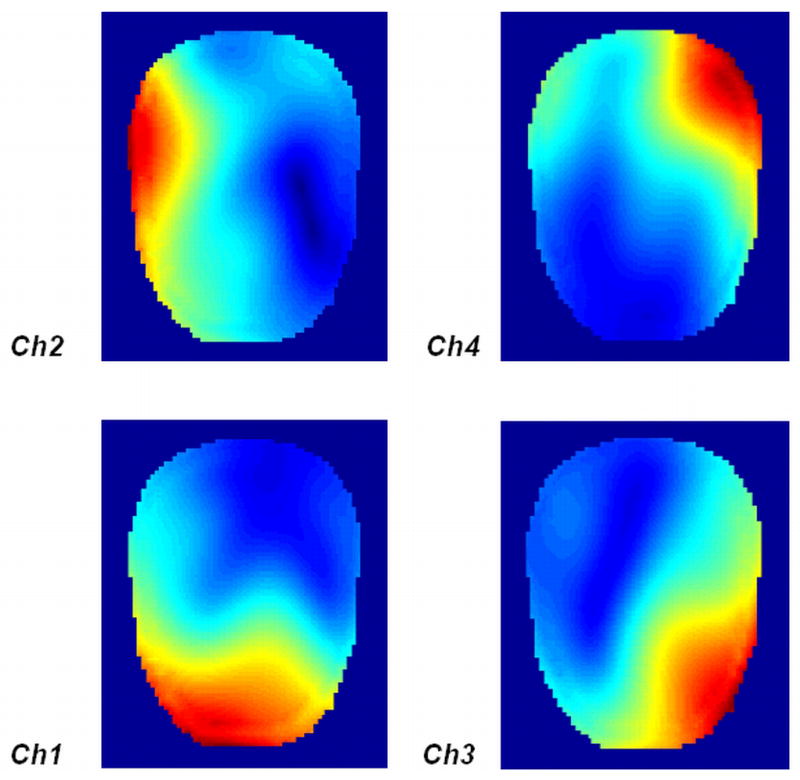
For the original array configuration in loaded case, the B1− profiles at 25 cm away from the patch array. High permittivity head model makes the sensitivity patterns highly asymmetric compared with the unloaded case. This increased asymmetric distribution of the loaded case is desired because it helps to improve the parallel imaging performance.
Table 2.
In loaded case simulation of both array configurations before and after rotating the two elements of the patch antenna array, the average g-factors for 1D SENSE at 21 cm, 23 cm, 25 cm and 27 cm targeted slices at reduction factor R of 2 and 3. Different array configurations lead to different g-factors; and the g-factors also vary with the distance between the targeted slice and the antenna array.
| Position z (cm) | 19 | 21 | 23 | 25 | 27 | 29 | 31 | 33 | |||
|---|---|---|---|---|---|---|---|---|---|---|---|
| Original array | X-direction acceleration | R=2 | Average g-factor | 1.26 | 1.15 | 1.13 | 1.14 | 1.17 | 1.18 | 1.18 | 1.19 |
| Maximum g-factor | 2.56 | 2.42 | 2.44 | 2.59 | 2.68 | 2.81 | 2.48 | 2.76 | |||
| R=3 | Average g-factor | 1.66 | 1.99 | 2.55 | 3.10 | 3.50 | 3.32 | 2.97 | 2.8 | ||
| Maximum g-factor | 14.2 | 24.8 | 14.3 | 18.5 | 37.9 | 31.0 | 19.9 | 13.4 | |||
| Y-direction acceleration | R=2 | Average g-factor | 1.23 | 1.14 | 1.13 | 1.12 | 1.10 | 1.09 | 1.09 | 1.10 | |
| Maximum g-factor | 2.6 | 2.45 | 2.37 | 2.27 | 2.26 | 2.16 | 1.89 | 2.02 | |||
| R=3 | Average g-factor | 1.78 | 2.11 | 2.47 | 2.81 | 2.96 | 2.90 | 3.13 | 3.28 | ||
| Maximum g-factor | 252 | 46.3 | 23.3 | 35.8 | 59.3 | 39.8 | 26.6 | 32.6 | |||
| Array after rotating two elements | X-direction acceleration | R=2 | Average g-factor | 1.66 | 1.60 | 1.51 | 1.41 | 1.40 | 1.38 | 1.35 | 1.3 |
| Maximum g-factor | 18.1 | 18.0 | 47 | 25 | 15.0 | 9.62 | 19 | 9.21 | |||
| R=3 | Average g-factor | 2.56 | 2.68 | 3.44 | 3.5 | 3.28 | 3.11 | 3.13 | 3.14 | ||
| Maximum g-factor | 42.8 | 95.3 | 41.7 | 25.7 | 17.2 | 16.0 | 20.7 | 97.3 | |||
| Y-direction acceleration | R=2 | Average g-factor | 1.58 | 1.45 | 1.31 | 1.17 | 1.14 | 1.11 | 1.13 | 1.13 | |
| Maximum g-factor | 13 | 27 | 28.8 | 21 | 13.4 | 18.1 | 6.66 | 5.07 | |||
| R=3 | Average g-factor | 3.14 | 2.46 | 2.41 | 2.24 | 2.29 | 2.37 | 2.61 | 2.66 | ||
| Maximum g-factor | 125 | 117 | 136 | 97.7 | 30.3 | 33.2 | 62.2 | 107 | |||
Figure 8.
Simulation results: g-factor maps for 1D SENSE at reduction factor R of 2 and 3 for the original array configuration in loaded case, regarding the average g-factors shown in Table 2. Eight targeted slices were at the distance of 19 cm, 21 cm, 23 cm, 25 cm, 27 cm, 29 cm, 31 cm and 33 cm from the patch array. Left two columns: g-maps for 1-D SENSE at acceleration direction of x; Right two columns: g-maps for 1-D SENSE at acceleration direction of y.
3. Bench test of the patch antenna array and B1 profile of a single patch
The reflection parameter S11 and the transmission parameter S21 of the patch antenna array were measured on the network analyzer. The S21 between the elements was better than −26 dB at only 3 cm gap while the S11 of each element could reach −36 dB, demonstrating excellent performance in electromagnetic decoupling and impedance matching. In this array setup, the resonant elements were placed as close as 3 cm apart which gives the upper limits of the measurements for the array model proposed for investigating the traveling-wave parallel imaging where the array elements were separated 8 cm apart.
Figure 9a shows the B1− profile of a single patch element. It is noticed that the B1- profile is not symmetric, making it possible to change the sensitivity pattern by simply rotating the patch with a specified angle. This characteristic of the microstrip patch antenna arrays is advantageous, providing the possibility of manipulating the coil array’s geometry factor (g-factor) by changing the sensitivity pattern of each resonant element in order to optimize the parallel imaging performance.
Figure 9.
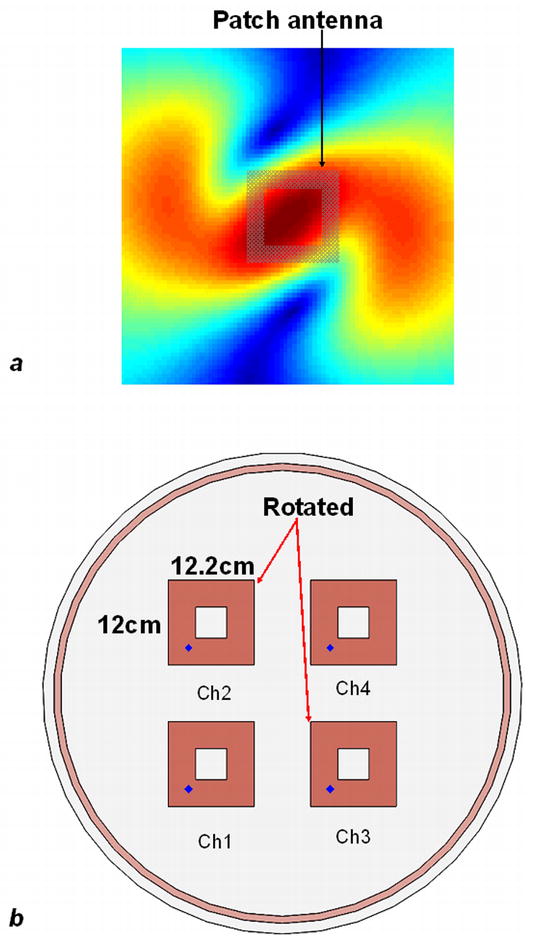
(a) B1− profile of a single piece nearly square ring patch antenna mapped by using FDTD simulation. The RF field of the antenna illustrates a highly asymmetric distribution, therefore the sensitivity pattern can be manipulated by rotating the patch with a specified angle. (b) Another possible array configuration generated by rotating the two elements of channel 2 and 3, which is expected to have a different B1 distribution (thus different g-maps) from the previous configuration.
To evaluate the efficiency of the patch antenna, bench measurements on the patch antenna and a shielded loop coil with 15 cm diameter at 298.2MHz were performed and compared. To make it closer to the real imaging environment, the two different coils were put into the magnet bore of the 7T MR scanner which was used for our MR experiment and acted as the waveguide. The length of the magnet bore is 316 cm. Both the patch antenna and the loop coil had the same reflection coefficient at the resonant frequency. The coil was put at one end of the magnet bore and a sniffer (pick-up coil) was positioned inside the magnet bore and 200 cm away from the coil. The strongest S21 of the patch antenna detected by the sniffer is −50 dB, while for the loop coil the S21 is also approximately −50 dB. When measuring the S21 of the loop coil the sniffer is parallel with the loop coil, while measuring the patch antenna, the sniffer is orthogonal to the patch. This indicates that the RF efficiency of the patch antenna is not worse than that of the loop coil.
4. MR experiment results
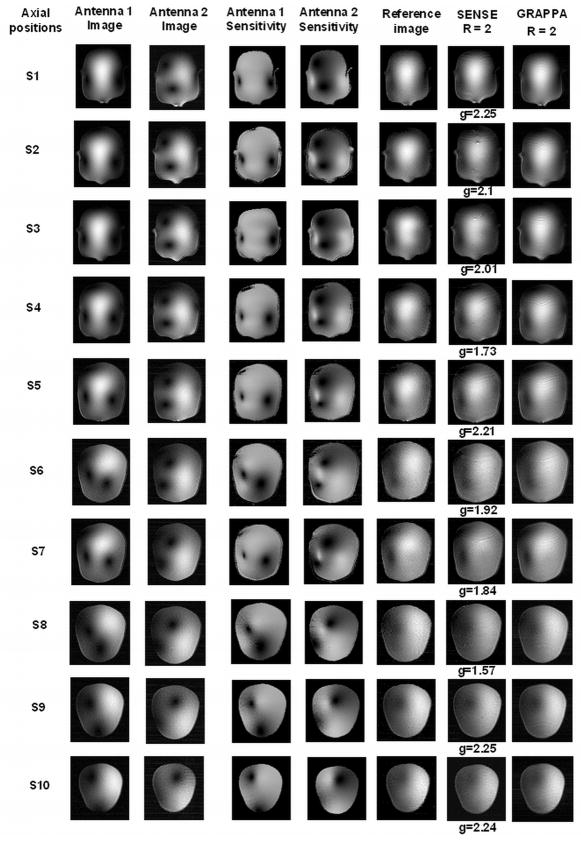
Figure 14 shows the axial images of 10 slices at different position within the head phantom. The 1st and 2nd columns are the images of each patch element at different slices. The 3rd and 4th columns are the sensitivity maps of each patch element calculated from the raw data. The 5th column images are reference images of the 10 axial slices, which were reconstructed by using the sum of squares method from the full k-space data. The 6th column images are SENSE reconstructed images at acceleration factor of 2. It is shown that some noise and aliasing artifacts appears in the phase encoding direction on the reconstructed image, this may be because the acceleration rate has reached the maximum value of 2 for this two element patch array. The average g-factors of each image are also presented. The 7th column images are GRAPPA reconstructed images with 48 ACS lines at acceleration factor of 2. From these parallel imaging performance results, it is illustrated that the traveling-wave parallel imaging is feasible by using the proposed patch antenna array approach.
Figure 14.
Axial images of the human head water phantom from MR experiments. 1st and 2nd columns: the image of each patch element; 3rd and 4th columns: the sensitivity maps of each element; 5th column: the images reconstructed from the sum of squares method of full k-space; 6th column: SENSE reconstructed images at acceleration factor of 2, average g-factor for each slice is shown beside the corresponding image; 7th column: GRAPPA reconstructed images with 48 ACS lines at acceleration factor of 2. These parallel imaging results demonstrate the feasibility of the parallel traveling-wave MR imaging using the proposed patch antenna array.
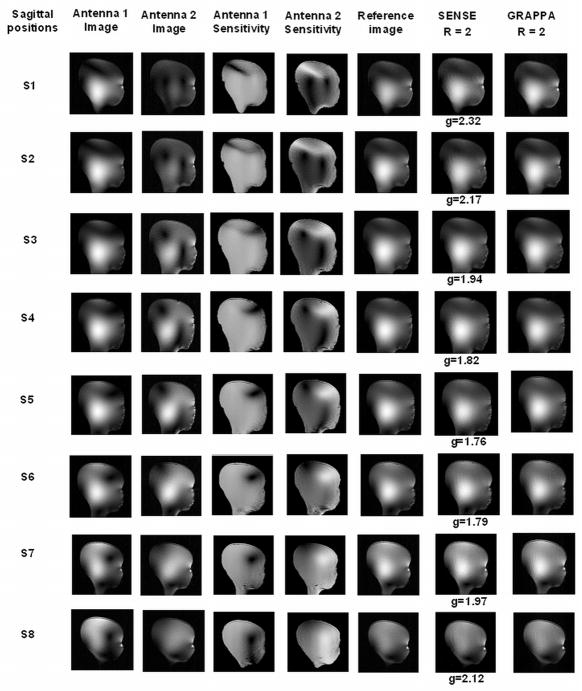
Figure 15 shows the sagittal images of 8 slices within the human head phantom. The 1st and 2nd columns are the images of each patch element at different slices. The 3rd and 4th columns are the sensitivity maps of each patch element calculated from the raw data. The last three column images are the reference images reconstructed from sum of squares method, SENSE reconstructed images and GRAPPA images respectively. The average g-factors for 1-D SENSE reconstruction at acceleration factor of 2 are also listed beside the SENSE images.
Figure 15.
Sagittal images of the human head water phantom from MR experiments. 1st and 2nd columns: the image of each patch element; 3rd and 4th columns: the sensitivity maps of each element; 5th column: the images reconstructed from the sum of squares method of full k-space; 6th column: SENSE reconstructed images at acceleration factor of 2, average g-factor for each slice is shown beside the corresponding image; 7th column: GRAPPA reconstructed images with 48 ACS lines at acceleration factor of 2. It is shown that the parallel imaging can be applied to different anatomical planes, and the performance is approximately the same.
5. Different array arrangement altering B1− profiles and G-factors
To provide a way to manipulating the B1− profile and changing the g-factors, patch antenna arrays with different configuration were investigated based on the B1− profile of a microstrip patch antenna element shown in Figure 9a. As an example, all setups of the waveguide and the patch antenna array were the same as those in the previous configuration, except that two elements of channel 2 and channel 3 were rotated counter-clockwise 90°, which is depicted in Figure 9b. The Yee cell size and the convergence stop criteria followed the previous settings. The B1− profiles of axial plane and the g-factor maps at different positions along the waveguide (or magnet) axis were all evaluated and compared with those in previous configuration for both unloaded and loaded cases.
In unloaded case, at 298 MHz the simulated transmission parameters S21, S31 and S41 are all better than −40 dB while the S11 is nearly −8 dB. Figure 10 shows the axial B1− profiles of 4 elements when fed individually. The axial plane was 25cm away from the patch array and the FOV in the study was 61cm. Each element shows different B1− profile, which is desired in performing parallel imaging. At this axial plane the g-factor for 1D SENSE at reduction factor R=2 can reach 1.19. The g-maps at R=2 and 3 for 12 different targeted slices from 25 cm to 135 cm along the magnet axis are shown in Figure 11, and their corresponding average g-factors are shown in the row ‘Mean g-factors for array after rotating two elements’ in Table 1.
Figure 10.
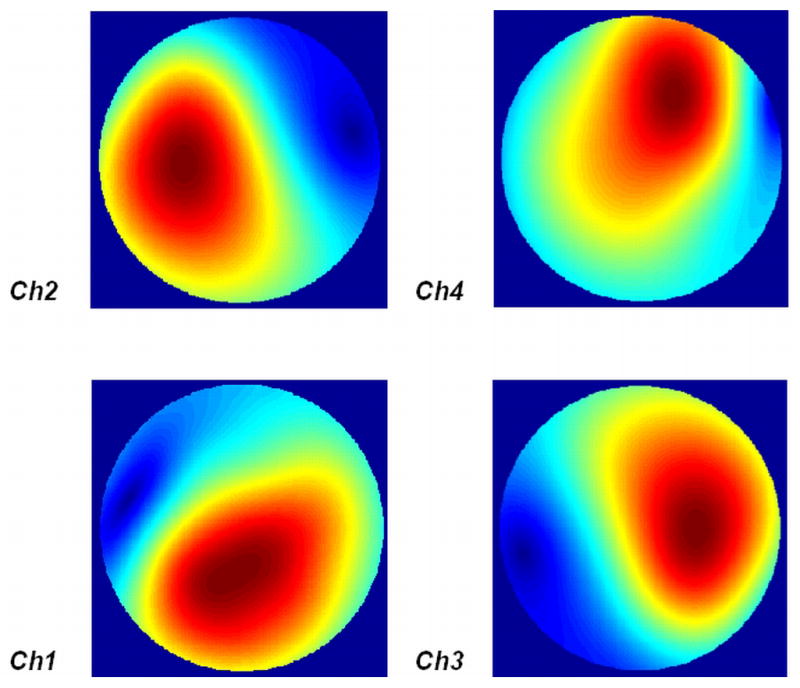
B1− profiles in the unloaded case (at 25cm away from the patch) after rotating two elements in the original array used in Fig 5, showing a field distribution change relative to the previous setup. This could be a potential way to alter B1− distribution and ultimately parallel imaging performance.
Figure 11.
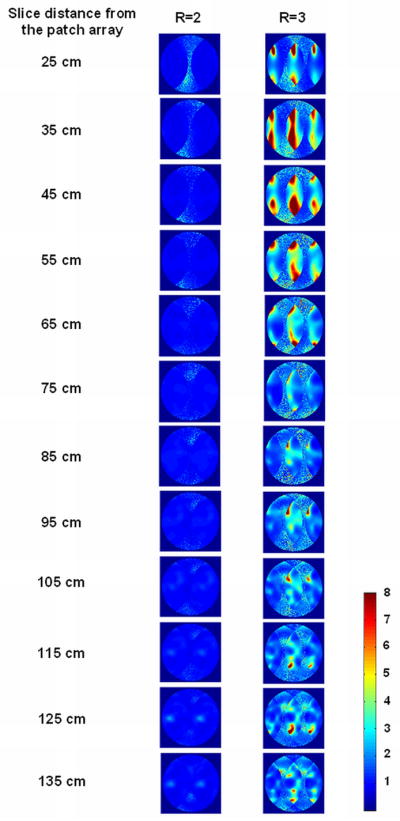
Simulation results: g-factor maps for 1D SENSE at reduction factor R of 2 and 3 for the array after rotating two elements in unloaded case, regarding the average g-factors shown in Table 1. It is clearly shown that the g-maps vary with the distance away from the patch array.
In loaded case, Figure 12 shows the B1− profile of each element within the human head. The g-factor maps of 8 targeted slices from 19 cm to 33 cm away from the array are shown in Figure 13 and their corresponding average g-factors in 2 acceleration directions are shown in the row ‘Mean g-factors for array after rotating two elements’ in Table 2.
Figure 12.
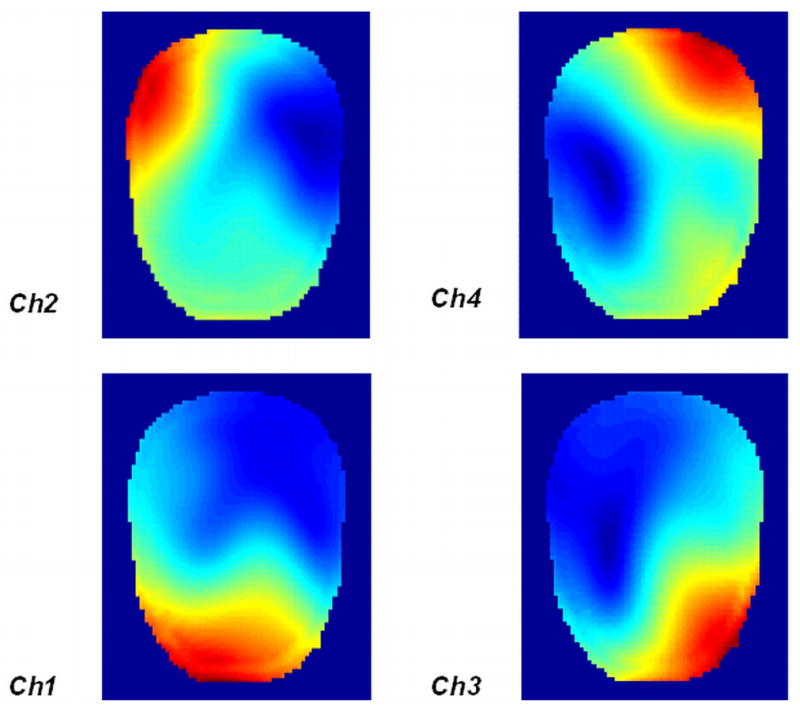
B1− profiles in the head phantom (at 25cm away from the patch) after rotating two elements in the original array used in Fig 7, showing a field distribution change relative to the previous setup.
Figure 13.
Simulation results: g-factor maps for 1D SENSE at reduction factor R of 2 and 3 for the array after rotating two elements in loaded case, regarding the average g-factors in Table 2. Eight targeted slices were at the distance of 19 cm, 21 cm, 23 cm, 25 cm, 27 cm, 29 cm, 31 cm and 33 cm from the patch array. Left two columns: g-maps for 1-D SENSE at acceleration direction of x; Right two columns: g-maps for 1-D SENSE at acceleration direction of y.
From above comparisons, it is noticed that there is an apparent difference between the g-factors of the two array configurations in both unloaded and loaded cases, demonstrating that different configuration of the array leads to different sensitivity pattern and parallel imaging performance. This provides a feasible way to manipulating the B1− profile of each element and optimizing the parallel imaging performance.
DISCUSSIONS AND CONCLUSIONS
The FDTD simulation, bench test and MR experiment results have demonstrated that it is feasible to apply the ‘traveling-wave’ technique to parallel imaging by using an array of antennas. The different sensitivity maps of each element and good g-factor maps at far field make it possible to implement parallel imaging using traveling-wave. In in-vivo experiments where the B1− profiles of individual array element become more asymmetric due to the unique wave behavior in high dielectric samples at high fields(29,36), it is expected to achieve a better parallel imaging performance based on the loaded simulation results with a standard human head model. In this work, the simulation and MR experiments were made with a head phantom inside the magnet bore. Such a setup may not be comparable to an in-vivo situation where usually a full human body (i.e. a larger sample) is inside the bore. Further study on the whole body case is necessary to be performed to thoroughly investigate the performance of parallel traveling wave imaging.
The measured transmission coefficients and the simulated conduction current density of each element have demonstrated excellent isolation between array elements, which is an important issue in parallel imaging because strong isolation leads to reduced noise correlation (37,38). Thus better g-factor and higher SNR are expected to be achieved. The results of SENSE and GRAPPA accelerated imaging have also demonstrated good parallel imaging performance in both axial and sagittal planes in MR phantom imaging.
Another important issue in parallel imaging is the diversity of the sensitivity pattern. Our simulation results have shown that the sensitivity pattern is closely related to the configuration of the patch array. The two configurations used in this work lead to different sensitivity patterns and g-factor maps in both unloaded and loaded cases, which have provided us feasible ways to manipulate the sensitivity pattern of each element and thus improve the g-factor. It is believed that the g-factor maps shown in this work can be further optimized. Array elements using different shaped patch antennas, such as rectangular patches, elliptical patches, circular ring patches and disc sector patches (25) will be investigated for achieving better parallel imaging performance.
The single-feed nearly square ring microstrip patch antenna (31) has been utilized to build the traveling-wave array in this work. The patch antenna shows better radiation efficiency in free space when compared with the conventional loop coil. Unlike the conventional RF coils designed for MR applications which use the coil’s near-fields, the microstrip patch antenna is designed to radiate with specific directivity, yielding a specific far-field radiation pattern, which results in radiating more power at a certain direction. The results of numerical simulations, bench tests and the parallel imaging performance of the MR imaging experiments using the two element patch antenna array demonstrate the excellent decoupling performance between the patch antenna array elements. This is essential for parallel traveling-wave MRI.
Parallel transmit is desired for high and ultrahigh field MR imaging in humans because of the demands of fast excitation, B1 shimming, and optimizing SAR to improve safety in human imaging at ultrahigh fields(36–43). Parallel transmit/receive using traveling wave would enable an efficient, fast and safer imaging technique for large sized biological samples, such as human body, at ultrahigh fields. However, at ultrahigh magnetic fields, due to high operating frequency, it is technically challenging to build large sized transmit or transceiver coil arrays to cover whole body. Traveling wave technique has demonstrated its capability for very large sample imaging using a whole body 7T MR system. This would open a new avenue to ultrahigh field MR imaging and reduce the difficulties in hardware designs. The development of the traveling wave parallel transmission and parallel acquisition techniques requires dedicated transceiver antenna array with excellent decoupling performance. The proposed approach by using transceiver patch antenna array has promising decoupling performance. In our experiment, this patch array acted as both transmitter and receiver, showing its potential to be used for traveling wave parallel transmission.
It is also noticed that in the proposed technique, the g-factor maps at different targeted slice distances away from the antenna array vary with the distance, this may be caused by the different interaction between the wave and the heterogeneous samples, such as human body. The simulation results also suggested that the use of the antennas with high degree of directivity or low beam divergence would aid to generate more B1 dissimilarity of each element of the antenna array and thus to improve the g-factors and the traveling-wave parallel imaging performance.
In addition, the number of patch antenna elements can be increased by using smaller size antennas. For the antenna design used in this work, the antenna size can be reduced by using high permittivity dielectric substrates and changing the size of the antenna slot.
Acknowledgments
The authors would like to thank Jenny Che for manuscript editing and proofreading. This work was partially supported by NIH grants EB004453, EB008699 and EB007588, and ITL-Bio 04-10148, and a QB3 Research Award.
References
- 1.Sodickson DK, Manning WJ. Simultaneous acquisition of spatial harmonics (SMASH): fast imaging with radiofrequency coil arrays. Magn Reson Med. 1997;38(4):591–603. doi: 10.1002/mrm.1910380414. [DOI] [PubMed] [Google Scholar]
- 2.Pruessmann KP, Weiger M, Scheidegger MB, Boesiger P. SENSE: sensitivity encoding for fast MRI. Magn Reson Med. 1999;42(5):952–962. [PubMed] [Google Scholar]
- 3.Jakob PM, Griswold MA, Edelman RR, Sodickson DK. AUTO-SMASH: a self-calibrating technique for SMASH imaging. SiMultaneous Acquisition of Spatial Harmonics Magma. 1998;7(1):42–54. doi: 10.1007/BF02592256. [DOI] [PubMed] [Google Scholar]
- 4.Heidemann RM, Griswold MA, Haase A, Jakob PM. VD-AUTO-SMASH imaging. Magn Reson Med. 2001;45(6):1066–1074. doi: 10.1002/mrm.1141. [DOI] [PubMed] [Google Scholar]
- 5.Griswold MA, Jakob PM, Heidemann RM, Nittka M, Jellus V, Wang J, Kiefer B, Haase A. Generalized autocalibrating partially parallel acquisitions (GRAPPA) Magn Reson Med. 2002;47(6):1202–1210. doi: 10.1002/mrm.10171. [DOI] [PubMed] [Google Scholar]
- 6.Wang J, Kluge T, Nittka M, Jellus V, Kuehn B. Parallel acquisition techniques with modified SENSE reconstruction mSENSE. Proceedings of the First Wurzburg Workshop on Parallel Imaging; Wurzburg, Germany. 2001. p. 92. [Google Scholar]
- 7.Griswold MA, Jakob PM, Nittka M, Goldfarb JW, Haase A. Partially parallel imaging with localized sensitivities (PILS) Magn Reson Med. 2000;44(4):602–609. doi: 10.1002/1522-2594(200010)44:4<602::aid-mrm14>3.0.co;2-5. [DOI] [PubMed] [Google Scholar]
- 8.Ji JX, Son JB, Rane SD. PULSAR: a matlab toolbox for parallel magnetic resonance imaging using array coils and multiple channel receivers. Concepts Magn Reson B: Magn Reson Eng. 2007;31B:24–36. [Google Scholar]
- 9.Lin FH, Kwong KK, Belliveau JW, Wald LL. Parallel imaging reconstruction using automatic regularization. Magn Reson Med. 2004;51(3):559–567. doi: 10.1002/mrm.10718. [DOI] [PubMed] [Google Scholar]
- 10.Vaughan JT, Adriany G, Snyder CJ, Tian J, Thiel T, Bolinger L, Liu H, DelaBarre L, Ugurbil K. Efficient high-frequency body coil for high-field MRI. Magn Reson Med. 2004;52(4):851–859. doi: 10.1002/mrm.20177. [DOI] [PubMed] [Google Scholar]
- 11.Vaughan JT, Snyder C, DelaBarre L, Bolinger L, Tian J, Andersen P, Strupp JP, Adriany G, Ugurbil K. 7T body imaging: first results. Proceedings of the 14th Annual Meeting of ISMRM; Seattle, WA. 2006. p. 213. [Google Scholar]
- 12.Zhang X, Ugurbil K, Chen W. Microstrip RF surface coil design for extremely high-field MRI and spectroscopy. Magn Reson Med. 2001;46(3):443–450. doi: 10.1002/mrm.1212. [DOI] [PubMed] [Google Scholar]
- 13.Zhang X, Ugurbil K, Chen W. A microstrip transmission line volume coil for human head MR imaging at 4T. J Magn Reson. 2003;161(2):242–251. doi: 10.1016/s1090-7807(03)00004-1. [DOI] [PubMed] [Google Scholar]
- 14.Zhang X, Ugurbil K, Sainati R, Chen W. An inverted-microstrip resonator for human head proton MR imaging at 7 tesla. IEEE Trans Biomed Eng. 2005;52(3):495–504. doi: 10.1109/TBME.2004.842968. [DOI] [PubMed] [Google Scholar]
- 15.Zhang X, Zhu XH, Chen W. Higher-order harmonic transmission-line RF coil design for MR applications. Magn Reson Med. 2005;53(5):1234–1239. doi: 10.1002/mrm.20462. [DOI] [PubMed] [Google Scholar]
- 16.Brunner DO, De Zanche N, Frohlich J, Paska J, Pruessmann KP. Travelling-wave nuclear magnetic resonance. Nature. 2009;457(7232):994–998. doi: 10.1038/nature07752. [DOI] [PubMed] [Google Scholar]
- 17.Smith N, Haines K, Versluis M, Webb A. Large field-of-view in vivo imaging using travelling waves on a whole body 7 tesla scanner. Proceedings of the 17th Scientific Meeting and Exhibition of ISMRM; Honolulu, HI. 2009. p. 2941. [Google Scholar]
- 18.Webb AG, Collins CM, Versluis MJ, Kan HE, Smith NB. MRI and localized proton spectroscopy in human leg muscle at 7 Tesla using longitudinal traveling waves. Magn Reson Med. 2010;63(2):297–302. doi: 10.1002/mrm.22262. [DOI] [PMC free article] [PubMed] [Google Scholar]
- 19.Zhang B, Wiggins G, Duan Q, Lattanzi R, Sodickson DK. Whole-body travelling-wave imaging at 7 tesla: simulations and early in-vivo experience. Proceedings of the 17th Scientific Meeting and Exhibition of ISMRM; Honolulu, HI. 2009. p. 499. [Google Scholar]
- 20.Brunner DO, Paska J, Graesslin I, Froehlich J, Pruessmann KP. Travelling wave parallel imaging. Proceedings of the 18th Scientific Meeting and Exhibition of ISMRM; Stockholm. 2010. p. 646. [Google Scholar]
- 21.Paska J, Brunner DO, Pruessmann KP, Graesslin I, Froehlich J, Vahldieck R. A travelling-wave setup for parallel RF transmission. Proceedings of the 18th Scientific Meeting and Exhibition of ISMRM; Stockholm. 2010. p. 3793. [Google Scholar]
- 22.Webb AG, Smith NB. MRI of the human torso at 7 Tesla using dual quadrature patch antennas. Proceedings of the 18th Scientific Meeting and Exhibition of ISMRM; Stockholm. 2010. p. 3798. [Google Scholar]
- 23.Pang Y, Wang C, Vigneron D, Zhang X. Parallel traveling-wave MRI: antenna array approach to traveling-wave MRI for parallel transmission and acquisition. Proceedings of the 18th Scientific Meeting and Exhibition of ISMRM; Stockholm. 2010. p. 3794. [Google Scholar]
- 24.Pang Y, Vigneron D, Zhang X. MR experiment validation of parallel traveling-wave with quadrature patch antenna transceiver array. Proceedings of the 19th Scientific Meeting and Exhibition of ISMRM; Montreal. 2011. p. 1904. [Google Scholar]
- 25.Balanis C. Microstrip antennas. New Jersey: Wiley-Interscience; 2005. pp. 811–882. [Google Scholar]
- 26.Yee KS. Numerical solution of initial boundary value problems involving Maxwell equations in isotropic media. IEEE Trans Ant Propag. 1966;14:302–307. [Google Scholar]
- 27.Collins CM, Smith MB. Calculations of B(1) distribution, SNR, and SAR for a surface coil adjacent to an anatomically-accurate human body model. Magn Reson Med. 2001;45(4):692–699. doi: 10.1002/mrm.1092. [DOI] [PubMed] [Google Scholar]
- 28.Wang J, Yang QX, Zhang X, Collins CM, Smith MB, Zhu XH, Adriany G, Ugurbil K, Chen W. Polarization of the RF field in a human head at high field: a study with a quadrature surface coil at 7.0 T. Magn Reson Med. 2002;48(2):362–369. doi: 10.1002/mrm.10197. [DOI] [PubMed] [Google Scholar]
- 29.Yang QX, Wang J, Zhang X, Collins CM, Smith MB, Liu H, Zhu XH, Vaughan JT, Ugurbil K, Chen W. Analysis of wave behavior in lossy dielectric samples at high field. Magn Reson Med. 2002;47(5):982–989. doi: 10.1002/mrm.10137. [DOI] [PubMed] [Google Scholar]
- 30.Kumar G, Ray KP. Broadband microstrip antennas. Boston and London: Artech House; 2003. Broadband circularly polarized MSAs; pp. 309–356. [Google Scholar]
- 31.Zhang X, Wang C. Single-feed quadrature coils as transceiver array elements for improved SNR and transmit efficiency. Proceedings of the 17th Scientific Meeting and Exhibition of ISMRM; Honolulu, HI. 2009. p. 3014. [Google Scholar]
- 32.Roemer PB, Edelstein WA, Hayes CE, Souza SP, Mueller OM. The NMR phased array. Magn Reson Med. 1990;16(2):192–225. doi: 10.1002/mrm.1910160203. [DOI] [PubMed] [Google Scholar]
- 33.Ocali O, Atalar E. Ultimate intrinsic signal-to-noise ratio in MRI. Magn Reson Med. 1998;39(3):462–473. doi: 10.1002/mrm.1910390317. [DOI] [PubMed] [Google Scholar]
- 34.Wiesinger F, Van de Moortele PF, Adriany G, De Zanche N, Ugurbil K, Pruessmann KP. Parallel imaging performance as a function of field strength--an experimental investigation using electrodynamic scaling. Magn Reson Med. 2004;52(5):953–964. doi: 10.1002/mrm.20281. [DOI] [PubMed] [Google Scholar]
- 35.Hoult DI, Bhakar B. NMR signal reception: virtual photons and coherent spontaneous emission. Concepts in Magnetic Resonance. 1997;9(5):277–297. [Google Scholar]
- 36.Adriany G, Van de Moortele PF, Wiesinger F, Moeller S, Strupp JP, Andersen P, Snyder C, Zhang X, Chen W, Pruessmann KP, Boesiger P, Vaughan T, Ugurbil K. Transmit and receive transmission line arrays for 7 Tesla parallel imaging. Magn Reson Med. 2005;53(2):434–445. doi: 10.1002/mrm.20321. [DOI] [PubMed] [Google Scholar]
- 37.Wu B, Wang C, Kelley DA, Xu D, Vigneron DB, Nelson SJ, Zhang X. Shielded microstrip array for 7T human MR imaging. IEEE Trans Med Imaging. 2010;29(1):179–184. doi: 10.1109/TMI.2009.2033597. [DOI] [PMC free article] [PubMed] [Google Scholar]
- 38.Wu B, Wang C, Krug R, Kelley DA, Xu D, Pang Y, Banerjee S, Vigneron DB, Nelson SJ, Majumdar S, Zhang X. 7T human spine imaging arrays with adjustable inductive decoupling. IEEE Trans Biomed Eng. 2010;57(2):397–403. doi: 10.1109/TBME.2009.2030170. [DOI] [PMC free article] [PubMed] [Google Scholar]
- 39.Hoffmann MB, Stadler J, Kanowski M, Speck O. Retinotopic mapping of the human visual cortex at a magnetic field strength of 7T. Clin Neurophysiol. 2009;120(1):108–116. doi: 10.1016/j.clinph.2008.10.153. [DOI] [PubMed] [Google Scholar]
- 40.Speck O, Stadler J, Zaitsev M. High resolution single-shot EPI at 7T. Magma. 2008;21(1–2):73–86. doi: 10.1007/s10334-007-0087-x. [DOI] [PubMed] [Google Scholar]
- 41.Gorny KR, Bernstein MA, Watson RE., Jr 3 Tesla MRI of patients with a vagus nerve stimulator: initial experience using a T/R head coil under controlled conditions. J Magn Reson Imaging. 2010;31(2):475–481. doi: 10.1002/jmri.22037. [DOI] [PubMed] [Google Scholar]
- 42.Bernstein MA, Huston J, 3rd, Lin C, Gibbs GF, Felmlee JP. High-resolution intracranial and cervical MRA at 3.0T: technical considerations and initial experience. Magn Reson Med. 2001;46(5):955–962. doi: 10.1002/mrm.1282. [DOI] [PubMed] [Google Scholar]
- 43.Bernstein MA, Huston J, 3rd, Ward HA. Imaging artifacts at 3.0T. J Magn Reson Imaging. 2006;24(4):735–746. doi: 10.1002/jmri.20698. [DOI] [PubMed] [Google Scholar]


