

Abstract
In this review focus is on structural imaging in the Alzheimer’s disease pre-states, particularly cognitively normal (CN) persons at future dementia risk. Findings in mild cognitive impairment (MCI) are described here only for comparison with CN. Cited literature evidence and commentary address issues of structural imaging alterations in CN that precede MCI and AD, regional patterns of such alterations, and the time relationship between structural imaging alterations and the appearance of symptoms of AD, issues relevant to the conduct of future AD prevention trials.
Keywords: review, human, mild cognitive impairment, Alzheimer’s disease, magnetic resonance imaging, morphometry, cognitive normality, normal aging
1. Introduction
Interpretation of structural imaging in normal persons depends critically on beliefs concerning the individuals being imaged. Clarity in key general terms is needed before proceeding with a review of this topic, particularly because the same term may be used in both a theoretical and a practical sense in the literature without distinction. Cognitive normality, for example, may denote concepts of a particular range of expected behaviors attributed to brain performance together with theoretical factors contributing to variability in this performance. In practice cognitive normality may be assessed using interviews that probe relevant behaviors based on clinical knowledge and experience, or defined by scores on cognitive tests [1-3].
The mutual interaction between the theoretical and practical sense of cognitive normality (CN) in persons being imaged is revealed in its application to aging [4]. Is CN the ideal preservation of adult brain performance at any time point, in which case psychometric test norms might be independent of age, or should CN include acknowledgement of universally observed declines with age, particularly in certain domains such as processing speed, and hence interviews and cognitive tests should somehow adjust for age [5]?
A second general term relevant to the interpretation of structural imaging in cognitively normal persons at risk of AD is atrophy. Atrophy as a medical concept refers to the reduction of brain substance relative to a presumed prior healthy normal state, and in addition implies this reduction is an effect of disease rather than from a normal process, e.g., pruning due to developmental changes during puberty. Some studies are designed to assess longitudinal change and thus define an atrophy rate, but cross-sectional studies have to make an assumption of comparability with the normal control group when referring to atrophy [6].
A second issue related to atrophy is uncertainty in the apportionment of structural (e.g., volume, thickness or shape) differences between: (1) longstanding effects of brain development or prior injury, (2) ongoing alterations due to aging or to disease processes that are not primary to the study, and (3) the focus of the study, in the current instance risk of clinical AD. By clinical AD is meant the expression of the underlying pathophysiology of AD in the form of memory or other symptoms. Developmental endowments, life experiences or specific activities such as exercise could both protect the individual from clinical AD and subtly influence brain structures, e.g., by increasing cortical thickness, thus decreasing risk of AD even though they have no direct connection to AD pathophysiology [7]. The essence of the problem is whether one is “finding the beginning or predicting the future” [8]. However, the issue of apportionment is often not explicitly considered in the literature.
Finally, the general term “risk of AD” needs to be qualified by being specific about the time interval over which risk is defined. It is important to recognize the observation period of individual imaging studies because if they are short, there is little time for the underlying biology of AD to express itself, whereas if it is long, there is greater likelihood of cognitive decline or AD expression but also greater effects of competing risks, such as co-morbid cardiovascular disease. Likewise with the term “prediction”, but that term is avoided herein.
This review will attempt to be mindful of the general terms CN, atrophy and AD risk as describe above, while addressing the following questions: (1) Are there structural imaging alterations in CN that precede MCI and AD?, (2) Is there a regional pattern of such alterations and does this pattern provide insight into AD pathophysiology?, and (3) How long before symptoms of AD appear do structural alterations occur? A context for addressing these questions is provided first in terms of a simple model and a brief description of brain structural alterations in aging.
2. Conceptual Model for AD Pathology & Expression
A basic framework for this article is illustrated in Figure 1. In this simple model, the basic assumptions are that: (1) underlying AD neuropathology accumulates in many CN persons years before any cognitive symptoms or even measurable declines in cognitive testing occur, (2) the brain has intrinsic neural mechanisms that compensate for injury due to AD neuropathology (ADN) at all stages, e.g. by synaptic remodeling, and (3) the human brain has inborn, developmental and learned sources of cerebral reserve that may offset the cognitive effects of injury, or, inversely, specific liabilities to the effects of ADN.
Figure 1.

Simple Model of the AD Timecourse (Modified from [17]). A. Illustration of a statistical cohort of 100,000 persons beginning at age 25 years, with bar height representing the expected remaining population at each 5-year interval to age 85 based on the US census [88, 89]. Each bar divided into proportionate parts representing the expected number of persons with AD (black) or MCI (white), or who remain normal (grey), based on US population model estimates [89, 90]. The incidence of MCI and AD, and overall death rate accelerate after age 55. B. Percentage of Braak stages over the same age range based on Braak [89, 91, 92]. C. Conceptual diagram of the appearance of different image features by modality and age in a nominal cohort of persons who develop symptoms of AD at age 75 years, based on results in the current literature [17]. Dotted lines represent the variable appearance in individuals of the first detectible image changes within each modality, some of which may precede symptoms by several years. Solid lines represent the more certain appearance of alterations near the time symptoms appear (within a few years). The character and distribution of image alterations may change over time, e.g., in functional MRI activation, a subtlety not captured in this simplified diagram. D. In the nominal cohort, memory decline within the normal range of scores becomes detectible by sensitive tests and longitudinal assessment, later associated with a complaint noticed by patient and outside observers, but without functional decline. Differences in rate of decline within the normal range may be dissected out using imaging and other biomarkers of AD neuropathology. These differences could result in a re-definition of CN.
To clarify the framework, more needs to be said about “underlying AD pathology”. Here the essence of AD pathology is taken to be the coupling between amyloid and tau. In this view beta-amyloid is not necessarily in the form of an accumulation (as in plaques) particularly in the earliest stages [9], but it must be present and coupled to abnormal tau for there to be AD pathology. This coupling could be mediated through, for example, prion protein [10, 11]. Accumulations of both amyloid and tau are the evidence this coupling has occurred, and indicate the severity of the process and likely the duration. Atrophy is taken as evidence of synaptic and neuronal loss or shrinkage. These changes are accompanied by widespread tau aggregates within the affected region. The amount of amyloid in a region does not always correspond with atrophy – in this framework that is determined by the strength of the coupling with tau (the signature of an underlying process of synaptic and neuronal degeneration).
Neuropathologically amyloid alone is not sufficient. Most radionucleide-label imaging only assesses amyloid, so the coupling to tau is only a presumption. There is a strong correlation between tau measured in CSF and (decreased) CSF amyloid and (increased) brain amyloid. So while not perfect, the amyloid-tau relationship is strong. However, combined amyloid-tau labels such as FDDNP (2-(1-{6-[(2-[F-18]fluoroethyl)(methyl)amino]-2-naphthyl}ethylidene)malononitrile ([(18)F]FDDNP)) may in future prove better markers of AD pathology than amyloid-only agents [12]. Tau alone may be present in other conditions, but it is the coupling with beta-amyloid that is distinctive of AD pathology. Whether a decoupling might occur later in the process wherein further neurodegeneration becomes autocatalyzing is unknown.
Within this framework the mere presence of AD-like brain pathology by itself doesn’t provide enough information to predict later dementia. It could be that the rate of accumulation is low, at least low enough to be successfully compensated, or that factors leading to an acceleration of the AD neuropathologic process are absent. Additional evidence that detected AD pathology is causing brain dysfunction may be needed in early cases, e.g., subtle cognitive impairment or at least decline, or brain network disruption detected by functional studies. However, it is reasonable to assume that the more pathology that is present, the more likely it is to be predictive of later AD, and that the absence of pathology is prognostically favorable [13].
Alzheimer’s disease occurs in late life and thus in an environment of multiple competing causes of death (Figure 1A). The earliest Alzheimer’s disease neuropathology (Figure 1B; nominal age range 55-65 years) occurs in middle adulthood, accompanied by “compensatory” imaging functional changes (Figure 1C) but unaccompanied by brain volume loss on imaging or by diminished cognitive performance (Figure 1D; [14]). As age and ADN increase (nominal age range 65-75 years), compensatory functional changes accompany early regional brain atrophy associated with increasing global amyloid and regional tau accumulation. This stage represents the borderland between CN and early cognitive changes (memory decline +/− MCI). Subsequent symptoms of cognitive impairment represent a critical point beyond which functional alterations, brain atrophy, and cognitive performance continually worsen (nominal age in this diagram 75 years). Functional losses in addition to compensations, increasing atrophy, and diminishing cognitive performance ensue in diagnosed clinical AD [15-17].
3. Structural Imaging in Aging
Well-characterized, longitudinally followed cognitively normal persons undergo brain volume losses with age, emphasizing the need for carefully selected age-matched controls in cross-sectional structural studies [18-20]. Only longitudinal studies can confirm baseline normal individuals who develop cognitive decline, MCI or AD at some future time. Retrospectively removing from analysis baseline structural scans from CN subjects who later develop MCI or AD could reduce effects of subtle disease-related volume losses, on the assumption these scans could skew regional volume distributions for CN [21]. Even when this step is taken, age-associated volume reductions are still observed. Grey matter volume reductions with age are generalized, without the relatively selective regional medial temporal, lateral temporal and parietal reductions characteristic of AD. Selective volume reduction with age also occurs in the deep frontal white matter and genu of the corpus callosum [21, 22]. In one recent study cortical thickness was reduced predominantly in primary sensorimotor regions, but did not correlate with cognitive performance, whereas white matter integrity (assessed by fractional anisotropy) was reduced in genu of corpus callosum and in frontal white matter, and correlated with deficits of “cognitive control” in 38 CN elders [23].
Grey matter volume is not a static property and is potentially modifiable in aging. Erickson et al found that vigorous levels of baseline physical activity (operationalized as blocks walked per week) were associated with increased cortical volume, particularly in premotor and prefrontal regions, nine years later [24]. Grey matter volume increases are seen in aging even after short exercise interventions [25]. The main caveat to these studies is the possibility that disease associated with brain volume losses biases toward non-participation in exercise.
Studies of hippocampal function (using cerebral blood pool volume measurements, CBV) suggest that losses with aging, including memory decline, may occur in the subiculum and dentate nucleus, whereas entorhinal functional changes are more specifically associated with disease [26], particularly AD. Diabetes may be associated specifically with dentate gyrus functional decreases, hippocampal ischemia with CA1 decreases, and more generalized ischemia both with CA1 and subiculum sector decreases [27]. A structural study of hippocampal formation subfields in subjects carefully screened for vascular risk and diabetes demonstrated an age-related reduction in subiculum volume commensurate with global grey matter reductions, but relative preservation of other hippocampal segments (CA1 and dentate subfields; [28]). These results are consistent with the pattern of subfield changes associated with specific pathologies and with aging seen in CBV-based studies.
Involutional age-related erosion of brain reserve and mild cognitive decline appears to be a fact of life in brain aging [16]. However, more sensitive methods for evaluating grey and white matter structure, and finer resolution of these methods to the level of individual grey matter nuclei and subfields, are now demonstrating subtle structural alterations that can be apportioned to specific co-morbid pathologies. As discussed further on, risk factors for pathologies, e.g., maternal family history of AD, may be associated with alterations in grey matter in CN aged subjects. Thus, apportionment of structural alterations between aging involution and underlying pathologies may soon be placed on a better scientific footing. Finally, effects of intervention such as exercise show that the aging brain may demonstrate plastic re-growth detectible as structural change.
4. Structural Imaging in MCI
MCI is defined as a mild but definite decline from previous cognitive ability, confirmed by a reliable observer, and substantiated by deficits on neurocognitive testing [29-31]. Generally structural MRI studies have demonstrated decreased size of the hippocampal formation in MCI, by rating techniques [32] and in both region-of-interest [32-36] and voxel-based volumetric studies [32, 37-41]. Studies are mixed regarding the presence of more global grey matter reductions in MCI compared to CN, e.g., in frontal and parietal regions [32, 42, 43]. Older adults who have memory complaints but do not meet formal criteria for MCI may nonetheless show similar grey matter reductions [32, 44].
A recent study based on subjects from the landmark Alzheimer’s disease Neuroimaging Initiative (ADNI) demonstrated that structural imaging data added significantly to the prediction of AD in patients with amnestic MCI [45]. The study used a modified version of freesurfer software [46] to compute cortical thickness and volumes from salient regions in subjects comparing CN and AD at baseline and over time using discriminant analysis. The discriminant functions were then used to compute risk scores for the MCI subjects. Subjects with high percentile scores were much more likely to convert to AD (odds ratios of 7.2 for highest vs. lowest percentiles for baseline scans, increasing to 12.0 when one-year longitudinal change was included in the analysis).
5. Structural Imaging in CN Persons at Risk of AD
5.1. Overview
This section refers to imaging studies characterizing the brain in cognitively normal (also denoted by CN in context) subjects with the goal of characterizing risk for MCI or AD (cf. Figure 1). Studies have operationalized CN by using expected cognitive test scores as they must, as discussed in the introduction. But this approach may not answer the question of whether the subjects “truly” have CN from an evolving theoretical point of view based on neurobiology of AD, because there is always a better cognitive test, clinical interview, or longitudinal follow-up method for assessment of cognitive decline that might yet detect a subtle difference. This is a practical problem only if this potential difference would alter treatment or prevention, an important unresolved issue. Despite uncertainty, if risk stratification in defined CN subjects could be accomplished with reasonable accuracy using structural imaging, then interventions might be made to slow the progress of ADN or to enhance intrinsic brain compensatory mechanisms before symptoms, perhaps entirely preventing or at least delaying these symptoms [47, 48]. This consideration motivates the search for structural, and other, biomarkers of AD in CN persons.
5.2. Brain Structure and Amyloid
The issue of defining CN mentioned in the introduction has a specific application to presumed pre-state Alzheimer’s disease (AD), because it has been found that brain amyloid accumulation is correlated negatively with memory scores in CN, although the scores are in the normal range [49]. Nonetheless, cognitive differences in general were not found between the 20-30% of CN with positive amyloid scans and the remainder with amyloid negative scans [13, 50]. In a group of 95 CN subjects, 32 were found to have elevated 11C-PIB amyloid brain labeling (PIB-positive; 34%). Again there were no cognitive differences or mean hippocampal volume differences between PIB-positive and PIB-negative CN, but there was a negative correlation between hippocampal volume and inferior temporal PIB retention in the former group [51]. Other recent studies have demonstrated decreased volume [52] or cortical thickness [53] in regions associated with early AD pathology (hippocampus, temporal neocortex, anterior and posterior cingulate) in CN subjects with increased amyloid burden. It was structural loss and not amyloid burden that correlated with cognitive performance in these studies, a finding that can be interpreted within our framework as the result of amyloid coupling to synaptic and neuronal degeneration associated with abnormal tau.
These findings suggest that in its early stages amyloid accumulation may not be associated with cognitive alterations but rather with subtle asymptomatic structural volume loss, implying ongoing brain injury that is somehow compensated. Evidence that structural alterations are associated with cognitive performance in CN subjects with increased amyloid burden, and amyloid burden with subsequent cognitive decline, suggests this state of compensation is not long-lived [52]. The reverse conclusion, that amyloid accumulation is the consequence of volume loss, is less likely because there was no correlation of between brain volumes and amyloid burden in the frontal lobes, for example [51]. Nonetheless, amyloid accumulation correlating with hippocampal volume was located exclusively in local inferior temporal regions immediately upstream of the entorhinal cortex and hippocampus, not in other neocortical regions (Figure 2).
Figure 2.
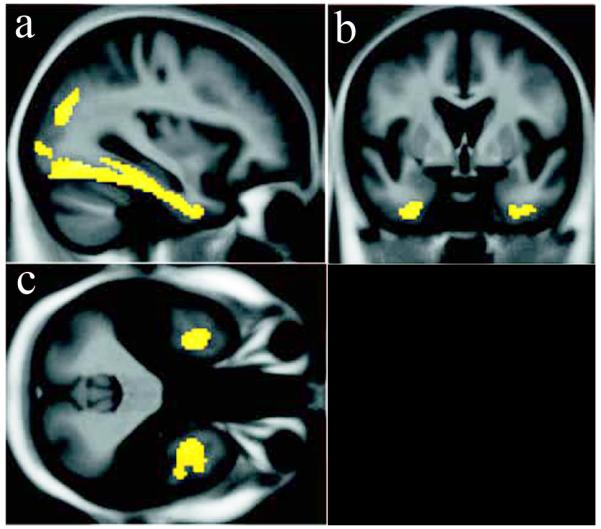
Voxelwise negative correlation between amyloid burden in normal subjects with elevated global 11C-PIB binding and hippocampal volume (r = −0.6, p = 0.02 using inferior temporal region). This relationship was not seen in subjects with MCI or AD, or in other brain regions outside of the inferomedial temporal lobe and parieto-occipital junction. With permission from [51]. Views: a- sagittal; b- coronal; c- axial.
Amyloid positive subjects are CN in one practical sense but not necessarily in a theoretical sense, because there is evidence of an underlying disease process, a process excluded from the concept of aging, which might cause the observed disease biomarker correlations with memory scores or with brain volumes. In this grey area lies the borderland between very early mild cognitive impairment (MCI) and CN aging.
5.3. Longitudinal Structural Studies
Annual rates of ventricular expansion have shown an increase in baseline CN subjects who received a clinical diagnosis of MCI within an average of 2.3 years, with an apparent acceleration of ventricular volume expansion rate in the two-year lead-up to MCI diagnosis [51, 54]. In a second study with 3.4 years follow-up from the last structural scan, ventricular expansion rate was associated with subsequent MCI diagnosis [55]. Volume loss rate in whole brain, hippocampus and entorhinal cortex was not associated with MCI conversion in this study, but regional medial temporal boundary shift atrophy rate has been associated with this conversion over 6 years observation [56].
Because the earliest ADN involves entorhinal cortex, amygdala, hippocampus and other medial temporal structures, early atrophy in these regions could predict normal subjects who will later develop MCI or AD [57-61]. Medial temporal (particularly entorhinal) baseline volume also predicted decline on tests of delayed memory in CN subjects imaged at baseline and followed for 3.8 years [61, 62].
An unexpected and significant early finding in the ADNI study was that temporal lobe atrophy predicted subsequent cognitive decline even in the baseline cognitively normal participants in that study [41, 61]. It has since been found that rate of atrophy in medial temporal structures in these subjects was associated with cognitive decline assessed by logical memory and AVLT tests [61, 63]. These studies have been supplemented by analyses demonstrating cortical thinning can be detected over one year in normal subjects, particularly in temporal and prefrontal regions [64]. These reductions were not confined to subjects with low CSF beta-amyloid levels, a marker of potential AD neuropathology, but in subjects with levels below a threshold, a correlation with cortical thinning was evident [65].
A longitudinal general community study of 511 nondemented subjects demonstrated that reduced global, hippocampal and amygdalar volumes at baseline were predictive of dementia within average 6 years [66], with rate of volume change serving as an independent predictor [66, 67]. Another recent study on 136 longitudinally-followed normal subjects undergoing a baseline structural scan demonstrated that volume in a combined region identified from these scans using VBM (anteromedial temporal and left angular gyrus grey matter; Figure 3A) predicted MCI within five years with 76% accuracy. Predictive accuracy increased to 87% by combining volume in the combined region with a cognitive measure, raw Wechsler Memory Scale score [66, 68, 69]. A study using a subset of these subjects for manual medial temporal tracing further supported these results [70].
Figure 3.
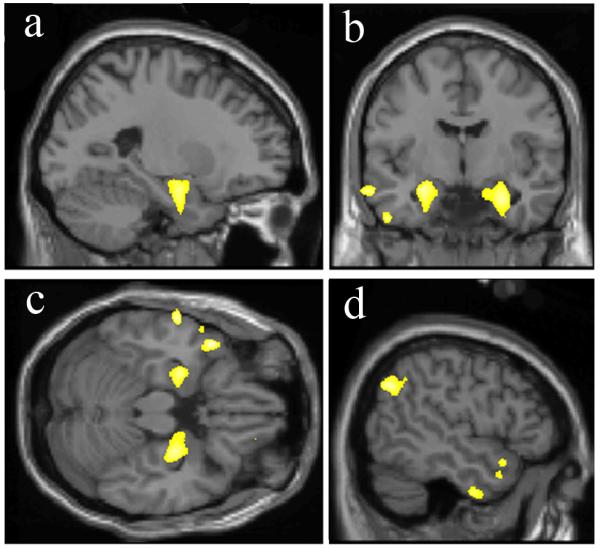

Brain structural alterations in cognitively normal persons at risk of MCI or AD. A. Volume within a template identified by retrospective classification of baseline scans in CN subjects demonstrating a region of significantly reduced grey matter volume at baseline in those who later developed MCI within 5 years (yellow-white color scale). Views: a,d- sagittal; b- coronal; c- axial. Prediction accuracy of volume within this brain region alone was 76%, and 87% when combined with psychometric data (With permission from [21]). B. Decreasing rates of conversion from CN to AD over the observation period by average baseline cortical thickness, averaged across nine regions of interest, classified as low (1 SD below the entire cohort mean), average (within 1 SD of the mean), and high (1 SD above the mean – the rate was zero in this group). Regions of interest were selected by finding significant differences in cortical thickness between AD and CN in a prior study (inset left, nine color-coded regions projected on partially inflated brain surface image). Retrospective classification of baseline scans in CN subjects allowed calculation of thickness differences between baseline CN who developed AD vs. those who remained CN (With permission from [71]).
A second potential structural signature of AD was found in a collection of cortical thickness measures in two independent groups of CN subjects using a retrospective comparison between subjects who developed AD versus groups of 25 control subjects who remained normal over the same observation periods of 7.1 (7 converters) and 11.1 (8 converters) years [71]. The sample sizes are relatively small and thus findings are prudently viewed as preliminary. The regions for cortical thickness comparison were established from previous studies of AD. Although medial temporal lobe (MTL), temporal pole, and superior frontal gyrus thickness was significantly less in CN to AD converters, averaging MTL with six additional region thickness values appeared to add further predictive power. The additional regions were inferior temporal, angular gyrus, supramarginal gyrus, superior parietal, precuneus, and middle frontal gyrus regions segmented in freesurfer. High cortical thickness in some of these regions could have been protective for conversion to AD, because the conversion rate in the18% of subjects with this signature was zero (Figure 3B).
5.4. Structural Studies in CN Involving Genetics
Normal subjects with a maternal history of AD (+FHm) have demonstrated decreased cortical volumes compared to subjects with a paternal AD history or no family AD history, mainly in frontal regions [72, 73]. Grey matter loss over two years in +FHm, however, displayed a somewhat different pattern, incorporating the dorsal frontal lobes but also the precuneus and inferotemporal cortex. A maternal inheritance influence on both earlier cortical development and later degenerative change is one explanation for these findings.
Apolipoprotein E (APOE) is a cholesterol carrier linked with cardivascular disease and late-onset AD [74], particularly though the influence of the epsilon-4 allele on age of AD onset. Cognitive decline in CN APOE epsilon-4 carriers diverges from that of non-carriers before age 60 years according to one model based on longitudinal observation of approximately five years [75]. APOE allele status was not found to add to risk of future cognitive impairment in CN subjects over an observation period of six years when medial temporal volume, walking speed and logical memory II baseline scores were included in the analysis [76]. Increased amyloid burden has been associated in a dose-dependent manner with the epsilon-4 allele [77] in CN subjects. Reduced grey matter density in the right medial temporal lobe and in frontotemporal cortex has been reported in of CN carriers of a singe epsilon-4 allele [78]. These findings suggest that APOE risk in CN subjects has proxies through amyloid accumulation and tissue loss in grey matter areas known to harbor neuropathology early in AD.
Familial Alzheimer’s disease (FAD) involving single autosomal dominant gene mutations with early-onset dementia has been studied to provide insights into the far more common sporadic, polygenetic disease late-onset Alzheimer’s disease (LOAD). Mutations in the amyloid preursor protein (APP) gene on chromosome 21 are quite rare. One study of presymtomatic APP V717G mutation carriers demonstrated slight baseline left hippocampal volume difference compared to controls with a rapid hippocampal volume loss (4.8% per year, n=3) as symptoms appeared over two years [79]. These subjects retrospectively had lower than expected global or memory scores despite normal day-to-day function and absence of reported memory decline. For comparison a later study in the same family using a global brain volume technique, median global annualized volume change was 0.2 %/year in 26 matched controls, 0.1%/year in 23 at-risk carriers who remained well, and 1.5 %/per year in 5 who became symptomatic within two years of baseline scan [80]. These findings suggest the timeline for structural alterations in FAD due to APP mutations may be compressed compared to LOAD, with accelerated brain losses occurring in parallel with asymptomatic cognitive decline on testing, and the appearance of symptoms at an early age.
Of the three known FAD genes, the presenillin-1 (PSEN1) gene on chromosome 14 harbors the most common mutations. A study of six CN PSEN1 mutation carriers gathered from four families found increased cortical thickness in precuneus and parietotemporal regions approximately 10 years before expected symptoms, whereas symptomatic subjects demonstrated diffuse cortical thinning, including areas of increase found in asymptomatic subjects [81]. Other studies in FAD demonstrate cortical thinning in the precuneus at 4.1 years prior to symptoms, and at 1.8 years in posterior cingulate in mutation carriers [82]. Thus the full trajectory of structural change in CN persons at risk of FAD is incomplete, and might include a very early phase of cortical swelling or enlargement.
A large family harboring the E280A PSEN1 mutation has been identified in Columbia, South America and characterized from the earliest, pre-symptomatic stages through dementia, serving as a model for sporadic AD [83-85]. Structural studies in this large kindred (449 identified mutation carriers) have not yet been reported but will be extremely important because these subjects are likely to participate in clinical prevention trials in the near future. Family members who are PSEN1 carriers have a cognitive phenotype that parallels LOAD, a decade time scale for evolution of symptoms from earliest cognitive alterations, and certainty of dementia. In contrast, LOAD has no model that can approach the predictive power of an autosomal dominant mutation in patient selection for prevention trials [82, 86]. Thus, in addition to the great medical significance of prevention in this particular family, there are many important implications of a successful prevention trial in this kindred for the worldwide family of the AD-at-risk.
6. Summary and Future Directions
In summary, responses to the three questions posed at the beginning of this review are:
(1) Are there structural imaging alterations in CN that precede MCI and AD?
Approximately half of normal persons harbor Braak stage I-II neurofibrillary pathology by age 55 years, approximately 20 years before nominal onset of AD at 75 years (Figure 1B). The neuropathologic burden increases progressively with age thereafter, at least in many persons. The exact manner of this progression is however unknown – whether it is linear, stuttering in bursts, or accelerating at some time. These unknowns become more important as we focus attention on AD neuropathology in CN subjects. Structural alterations in CN are observable well before dementia onset, and, when these alterations involve grey matter, may be associated with subtle cognitive decline in groups of clinically normal persons. Grey matter losses during this pre-state are also associated with fibrillary amyloid burden in the brain assessed by imaging or CSF studies, but these losses are more likely related to the amyloid coupling to abnormal tau than to amyloid per se. White matter diffusion changes are observed perhaps even earlier in interhemispheric and intrahemispheric long association tracts (cf. companion review on white matter neuroimaging in this issue).
(2) Is there a regional pattern of such alterations and does this pattern provide insight into AD pathophysiology?
The most consistent finding is a decrease in medial temporal volume well before clinically symptomatic stages (MCI or AD). However cortical thinning has been detected in other regions in CN subjects, particularly the temporal and parietal neocortex. Grey matter atrophy appears in areas where AD neurofibrillary pathology is known to be heaviest, and is correlated both globally and locally with amyloid burden. Under our framework this association is mediated by the coupling between amyloid and abnormal tau, the latter representing the marker for synaptic and neuronal shrinkage and loss. For example, CN individuals with increased global amyloid burden demonstrate strong correlation between regional amyloid burden in the inferolateral temporal lobe and hippocampal atrophy. Thus structural imaging in grey matter, by itself, only confirms gross shrinkage of neurons and neuropil in a pattern consistent with expected local AD neuropathology. When marked by the detection of amyloid globally and locally, the strength of the inference that underlying AD neuropathology associated with abnormal tau increases. Insight into how this coupling might come about is not forthcoming from these findings alone.
White matter alterations in association fibers appear to involve large stretches of neocortex, but a more detailed review appearing elsewhere in this volume qualifies this conclusion. Early work suggests that white matter alterations may be reporting on altered axonal-myelin signaling interactions, perhaps an earlier indication of underlying AD neuropathology than grey matter atrophy.
(3) How long before clinical symptoms of MCI or AD appear do structural alterations occur?
Approximately 5-10 years for grey matter atrophy, and perhaps longer for white matter diffusion alterations. This estimate suggests that interventions to prevent AD will need to begin early indeed, before the expected onset of even the earliest symptoms of cognitive impairment.
One understudied area of structural imaging is analysis of dynamic compensatory change (e.g., due to exercise or intensive educational activity) or components of cerebral reserve such as cortical thickness that may confer resistance to the effects of aging, AD, and co-morbid pathologies. Measures to enhance compensation for the presence of existing early AD neuropathology is an underexplored area of research in AD.
Many other questions regarding AD neuropathology in CN remain, some of which can be addressed with structural imaging. The answers are important for the rational consideration of AD prevention. The data presented here and elsewhere in this volume are sufficiently convincing that, for the purposes of including and excluding potential participants in clinical prevention trials, a combination of: (a) amyloid/FDDNP imaging [12, 52] or CSF [87] and (b) a structural MRI pattern signature [67, 68, 71] would enhance the efficiency and speed of these trials. In a long-term trial, even expense might be reduced.
*Highlights.
-
➢
Review focuses on MRI imaging in normal subjects before symptoms of dementia
-
➢
Structural MRI changes are found in normal persons at risk of Alzheimer’s Disease
-
➢
These findings are important for prevention of dementia
Acknowledgments
I am grateful to my many valued and insightful teachers and colleagues at the Alzheimer’s Disease Center, Magnetic Resonance Imaging and Spectroscopy Center, and the College of Medicine at the University of Kentucky, particularly my mentor, Dr. William Markesbery. This work supported by a gift from Robert P. and Mildred Moores, and by grants from the National Institutes of Health Institute on Aging (P50 AG05144) and Institute for Neurologic Disorders and Stroke (R01-36660).
Footnotes
Publisher's Disclaimer: This is a PDF file of an unedited manuscript that has been accepted for publication. As a service to our customers we are providing this early version of the manuscript. The manuscript will undergo copyediting, typesetting, and review of the resulting proof before it is published in its final citable form. Please note that during the production process errors may be discovered which could affect the content, and all legal disclaimers that apply to the journal pertain.
Conflict of Interest. The author has no financial or ethical conflict of interest with regard to the content of this manuscript.
References
- [1].Caselli RJ, Dueck AC, Locke DE, Hoffman-Snyder CR, Woodruff BK, Rapcsak SZ, Reiman EM. Longitudinal modeling of frontal cognition in APOE {varepsilon}4 homozygotes, heterozygotes, and noncarriers. Neurology. 2011;76:1383–1388. doi: 10.1212/WNL.0b013e3182167147. [DOI] [PMC free article] [PubMed] [Google Scholar]
- [2].Goldman WP, Price JL, Storandt M, Grant EA, McKeel DW, Jr., Rubin EH, Morris JC. Absence of cognitive impairment or decline in preclinical Alzheimer’s disease. Neurology. 2001;56:361–367. doi: 10.1212/wnl.56.3.361. [DOI] [PubMed] [Google Scholar]
- [3].Linn RT, Wolf PA, Bachman DL, Knoefel JE, Cobb JL, Belanger AJ, Kaplan EF, D’Agostino RB. The ‘preclinical phase’ of probable Alzheimer’s disease. A 13-year prospective study of the Framingham cohort. Arch Neurol. 1995;52:485–490. doi: 10.1001/archneur.1995.00540290075020. [DOI] [PubMed] [Google Scholar]
- [4].Fjell AM, Walhovd KB. Structural brain changes in aging: courses, causes and cognitive consequences. Rev Neurosci. 2010;21:187–221. doi: 10.1515/revneuro.2010.21.3.187. [DOI] [PubMed] [Google Scholar]
- [5].Salthouse TA. Selective review of cognitive aging. J Int Neuropsychol Soc. 2010;16:754–760. doi: 10.1017/S1355617710000706. [DOI] [PMC free article] [PubMed] [Google Scholar]
- [6].Jack CR, Jr., Shiung MM, Gunter JL, O’Brien PC, Weigand SD, Knopman DS, Boeve BF, Ivnik RJ, Smith GE, Cha RH, Tangalos EG, Petersen RC. Comparison of different MRI brain atrophy rate measures with clinical disease progression in AD. Neurology. 2004;62:591–600. doi: 10.1212/01.wnl.0000110315.26026.ef. [DOI] [PMC free article] [PubMed] [Google Scholar]
- [7].Stern Y. What is cognitive reserve? Theory and research application of the reserve concept. Journal of the International Neuropsychological Society. 2002;8:448–460. [PubMed] [Google Scholar]
- [8].Mayeux R, Small SA. Finding the beginning or predicting the future? Arch Neurol. 2000;57:783–784. doi: 10.1001/archneur.57.6.783. [DOI] [PubMed] [Google Scholar]
- [9].Braak H, Del Tredici K. The pathological process underlying Alzheimer’s disease in individuals under thirty. Acta Neuropathol. 2011;121:171–181. doi: 10.1007/s00401-010-0789-4. [DOI] [PubMed] [Google Scholar]
- [10].Freir DB, Nicoll AJ, Klyubin I, Panico S, Mc Donald JM, Risse E, Asante EA, Farrow MA, Sessions RB, Saibil HR, Clarke AR, Rowan MJ, Walsh DM, Collinge J. Interaction between prion protein and toxic amyloid beta assemblies can be therapeutically targeted at multiple sites. Nat Commun. 2011;2:336. doi: 10.1038/ncomms1341. [DOI] [PMC free article] [PubMed] [Google Scholar]
- [11].Lauren J, Gimbel DA, Nygaard HB, Gilbert JW, Strittmatter SM. Cellular prion protein mediates impairment of synaptic plasticity by amyloid-beta oligomers. Nature. 2009;457:1128–1132. doi: 10.1038/nature07761. [DOI] [PMC free article] [PubMed] [Google Scholar]
- [12].Braskie MN, Klunder AD, Hayashi KM, Protas H, Kepe V, Miller KJ, Huang SC, Barrio JR, Ercoli LM, Siddarth P, Satyamurthy N, Liu J, Toga AW, Bookheimer SY, Small GW, Thompson PM. Plaque and tangle imaging and cognition in normal aging and Alzheimer’s disease. Neurobiol Aging. 2010;31:1669–1678. doi: 10.1016/j.neurobiolaging.2008.09.012. [DOI] [PMC free article] [PubMed] [Google Scholar]
- [13].Villemagne VL, Pike KE, Chetelat G, Ellis KA, Mulligan RS, Bourgeat P, Ackermann U, Jones G, Szoeke C, Salvado O, Martins R, O’Keefe G, Mathis CA, Klunk WE, Ames D, Masters CL, Rowe CC. Longitudinal assessment of Abeta and cognition in aging and Alzheimer disease. Ann Neurol. 2011;69:181–192. doi: 10.1002/ana.22248. [DOI] [PMC free article] [PubMed] [Google Scholar]
- [14].Reitz C, Brickman AM, Brown TR, Manly J, DeCarli C, Small SA, Mayeux R. Linking hippocampal structure and function to memory performance in an aging population. Arch Neurol. 2009;66:1385–1392. doi: 10.1001/archneurol.2009.214. [DOI] [PMC free article] [PubMed] [Google Scholar]
- [15].Smith AD. Imaging the progression of Alzheimer pathology through the brain. Proc Natl Acad Sci U S A. 2002;99:4135–4137. doi: 10.1073/pnas.082107399. [DOI] [PMC free article] [PubMed] [Google Scholar]
- [16].Smith CD. Mild cognitive impairment is too late: The case for presymtomatic detection and treatment for Alzheimer’s disease. Cognitive Sciences. 2007;3:127–177. [Google Scholar]
- [17].Smith CD. Neuroimaging through the course of Alzheimer’s disease. J Alzheimers Dis. 2010;19:273–290. doi: 10.3233/JAD-2010-1217. [DOI] [PubMed] [Google Scholar]
- [18].Good CD, Johnsrude IS, Ashburner J, Henson RN, Friston KJ, Frackowiak RS. A voxel-based morphometric study of ageing in 465 normal adult human brains. Neuroimage. 2001;14:21–36. doi: 10.1006/nimg.2001.0786. [DOI] [PubMed] [Google Scholar]
- [19].Taki Y, Goto R, Evans A, Zijdenbos A, Neelin P, Lerch J, Sato K, Ono S, Kinomura S, Nakagawa M, Sugiura M, Watanabe J, Kawashima R, Fukuda H. Voxel-based morphometry of human brain with age and cerebrovascular risk factors. Neurobiol Aging. 2004;25:455–463. doi: 10.1016/j.neurobiolaging.2003.09.002. [DOI] [PubMed] [Google Scholar]
- [20].Fotenos AF, Snyder AZ, Girton LE, Morris JC, Buckner RL. Normative estimates of cross-sectional and longitudinal brain volume decline in aging and AD. Neurology. 2005;64:1032–1039. doi: 10.1212/01.WNL.0000154530.72969.11. [DOI] [PubMed] [Google Scholar]
- [21].Smith CD, Chebrolu H, Wekstein DR, Schmitt FA, Markesbery WR. Age and gender effects on human brain anatomy: A voxel-based morphometric study in healthy elderly. Neurobiol Aging. 2006 doi: 10.1016/j.neurobiolaging.2006.05.018. [DOI] [PubMed] [Google Scholar]
- [22].Wu YC, Field AS, Whalen PJ, Alexander AL. Age- and gender-related changes in the normal human brain using hybrid diffusion imaging (HYDI) Neuroimage. 2011;54:1840–1853. doi: 10.1016/j.neuroimage.2010.09.067. [DOI] [PMC free article] [PubMed] [Google Scholar]
- [23].Ziegler DA, Piguet O, Salat DH, Prince K, Connally E, Corkin S. Cognition in healthy aging is related to regional white matter integrity, but not cortical thickness. Neurobiol Aging. 2010;31:1912–1926. doi: 10.1016/j.neurobiolaging.2008.10.015. [DOI] [PMC free article] [PubMed] [Google Scholar]
- [24].Erickson KI, Raji CA, Lopez OL, Becker JT, Rosano C, Newman AB, Gach HM, Thompson PM, Ho AJ, Kuller LH. Physical activity predicts gray matter volume in late adulthood: the Cardiovascular Health Study. Neurology. 2010;75:1415–1422. doi: 10.1212/WNL.0b013e3181f88359. [DOI] [PMC free article] [PubMed] [Google Scholar]
- [25].Colcombe SJ, Erickson KI, Scalf PE, Kim JS, Prakash R, McAuley E, Elavsky S, Marquez DX, Hu L, Kramer AF. Aerobic exercise training increases brain volume in aging humans. J Gerontol A Biol Sci Med Sci. 2006;61:1166–1170. doi: 10.1093/gerona/61.11.1166. [DOI] [PubMed] [Google Scholar]
- [26].Small SA, Tsai WY, DeLaPaz R, Mayeux R, Stern Y. Imaging hippocampal function across the human life span: is memory decline normal or not? Ann Neurol. 2002;51:290–295. doi: 10.1002/ana.10105. [DOI] [PubMed] [Google Scholar]
- [27].Wu W, Brickman AM, Luchsinger J, Ferrazzano P, Pichiule P, Yoshita M, Brown T, DeCarli C, Barnes CA, Mayeux R, Vannucci SJ, Small SA. The brain in the age of old: the hippocampal formation is targeted differentially by diseases of late life. Ann Neurol. 2008;64:698–706. doi: 10.1002/ana.21557. [DOI] [PMC free article] [PubMed] [Google Scholar]
- [28].La Joie R, Fouquet M, Mezenge F, Landeau B, Villain N, Mevel K, Pelerin A, Eustache F, Desgranges B, Chetelat G. Differential effect of age on hippocampal subfields assessed using a new high-resolution 3T MR sequence. Neuroimage. 2010;53:506–514. doi: 10.1016/j.neuroimage.2010.06.024. [DOI] [PubMed] [Google Scholar]
- [29].Flicker C, Ferris SH, Reisberg B. Mild cognitive impairment in the elderly: predictors of dementia. Neurology. 1991;41:1006–1009. doi: 10.1212/wnl.41.7.1006. [DOI] [PubMed] [Google Scholar]
- [30].Petersen RC, Doody R, Kurz A, Mohs RC, Morris JC, Rabins PV, Ritchie K, Rossor M, Thal L, Winblad B. Current concepts in mild cognitive impairment. Arch Neurol. 2001;58:1985–1992. doi: 10.1001/archneur.58.12.1985. [DOI] [PubMed] [Google Scholar]
- [31].Petersen RC, Parisi JE, Dickson DW, Johnson KA, Knopman DS, Boeve BF, Jicha GA, Ivnik RJ, Smith GE, Tangalos EG, Braak H, Kokmen E. Neuropathologic features of amnestic mild cognitive impairment. Arch Neurol. 2006;63:665–672. doi: 10.1001/archneur.63.5.665. [DOI] [PubMed] [Google Scholar]
- [32].Golomb J, de Leon MJ, Kluger A, George AE, Tarshish C, Ferris SH. Hippocampal atrophy in normal aging. An association with recent memory impairment. Arch.Neurol. 1993;50:967–973. doi: 10.1001/archneur.1993.00540090066012. [DOI] [PubMed] [Google Scholar]
- [33].Grundman M, Sencakova D, Jack CR, Jr., Petersen RC, Kim HT, Schultz A, Weiner MF, DeCarli C, DeKosky ST, van Dyck C, Thomas RG, Thal LJ. Brain MRI hippocampal volume and prediction of clinical status in a mild cognitive impairment trial. J Mol Neurosci. 2002;19:23–27. doi: 10.1007/s12031-002-0006-6. [DOI] [PubMed] [Google Scholar]
- [34].Pantel J, Kratz B, Essig M, Schroder J. Parahippocampal volume deficits in subjects with aging-associated cognitive decline. American Journal of Psychiatry. 2003;160:379–382. doi: 10.1176/appi.ajp.160.2.379. [DOI] [PubMed] [Google Scholar]
- [35].Dickerson BC, Salat DH, Bates JF, Atiya M, Killiany RJ, Greve DN, Dale AM, Stern CE, Blacker D, Albert MS, Sperling RA. Medial temporal lobe function and structure in mild cognitive impairment. Ann Neurol. 2004;56:27–35. doi: 10.1002/ana.20163. [DOI] [PMC free article] [PubMed] [Google Scholar]
- [36].Jack CR, Jr., Petersen RC, Xu YC, Waring SC, O’Brien PC, Tangalos EG, Smith GE, Ivnik RJ, Kokmen E. Medial temporal atrophy on MRI in normal aging and very mild Alzheimer’s disease. Neurology. 1997;49:786–794. doi: 10.1212/wnl.49.3.786. [DOI] [PMC free article] [PubMed] [Google Scholar]
- [37].Chetelat G, Desgranges B, De La Sayette V, Viader F, Eustache F, Baron JC. Mapping gray matter loss with voxel-based morphometry in mild cognitive impairment. Neuroreport. 2002;13:1939–1943. doi: 10.1097/00001756-200210280-00022. [DOI] [PubMed] [Google Scholar]
- [38].Karas GB, Scheltens P, Rombouts SA, Visser PJ, van Schijndel RA, Fox NC, Barkhof F. Global and local gray matter loss in mild cognitive impairment and Alzheimer’s disease. Neuroimage. 2004;23:708–716. doi: 10.1016/j.neuroimage.2004.07.006. [DOI] [PubMed] [Google Scholar]
- [39].Pennanen C, Testa C, Laakso MP, Hallikainen M, Helkala EL, Hanninen T, Kivipelto M, Kononen M, Nissinen A, Tervo S, Vanhanen M, Vanninen R, Frisoni GB, Soininen H. A voxel based morphometry study on mild cognitive impairment. J Neurol Neurosurg Psychiatry. 2005;76:11–14. doi: 10.1136/jnnp.2004.035600. [DOI] [PMC free article] [PubMed] [Google Scholar]
- [40].Becker JT, Davis SW, Hayashi KM, Meltzer CC, Toga AW, Lopez OL, Thompson PM. Three-dimensional patterns of hippocampal atrophy in mild cognitive impairment. Arch Neurol. 2006;63:97–101. doi: 10.1001/archneur.63.1.97. [DOI] [PubMed] [Google Scholar]
- [41].Hua X, Leow AD, Parikshak N, Lee S, Chiang MC, Toga AW, Jack CR, Jr., Weiner MW, Thompson PM. Tensor-based morphometry as a neuroimaging biomarker for Alzheimer’s disease: An MRI study of 676 AD, MCI, and normal subjects. Neuroimage. 2008 doi: 10.1016/j.neuroimage.2008.07.013. [DOI] [PMC free article] [PubMed] [Google Scholar]
- [42].Duarte A, Hayasaka S, Du A, Schuff N, Jahng GH, Kramer J, Miller B, Weiner M. Volumetric correlates of memory and executive function in normal elderly, mild cognitive impairment and Alzheimer’s disease. Neurosci Lett. 2006;406:60–65. doi: 10.1016/j.neulet.2006.07.029. [DOI] [PMC free article] [PubMed] [Google Scholar]
- [43].Apostolova LG, Steiner CA, Akopyan GG, Dutton RA, Hayashi KM, Toga AW, Cummings JL, Thompson PM. Three-dimensional gray matter atrophy mapping in mild cognitive impairment and mild Alzheimer disease. Arch Neurol. 2007;64:1489–1495. doi: 10.1001/archneur.64.10.1489. [DOI] [PMC free article] [PubMed] [Google Scholar]
- [44].Saykin AJ, Wishart HA, Rabin LA, Santulli RB, Flashman LA, West JD, McHugh TL, Mamourian AC. Older adults with cognitive complaints show brain atrophy similar to that of amnestic MCI. Neurology. 2006;67:834–842. doi: 10.1212/01.wnl.0000234032.77541.a2. [DOI] [PMC free article] [PubMed] [Google Scholar]
- [45].McEvoy LK, Holland D, Hagler DJ, Jr., Fennema-Notestine C, Brewer JB, Dale AM. Mild Cognitive Impairment: Baseline and Longitudinal Structural MR Imaging Measures Improve Predictive Prognosis. Radiology. 2011 doi: 10.1148/radiol.11101975. [DOI] [PMC free article] [PubMed] [Google Scholar]
- [46].Makris N, Kaiser J, Haselgrove C, Seidman LJ, Biederman J, Boriel D, Valera EM, Papadimitriou GM, Fischl B, Caviness VS, Jr., Kennedy DN. Human cerebral cortex: a system for the integration of volume- and surface-based representations. Neuroimage. 2006;33:139–153. doi: 10.1016/j.neuroimage.2006.04.220. [DOI] [PubMed] [Google Scholar]
- [47].Khachaturian ZS, Barnes D, Einstein R, Johnson S, Lee V, Roses A, Sager MA, Shankle WR, Snyder PJ, Petersen RC, Schellenberg G, Trojanowski J, Aisen P, Albert MS, Breitner JC, Buckholtz N, Carrillo M, Ferris S, Greenberg BD, Grundman M, Khachaturian AS, Kuller LH, Lopez OL, Maruff P, Mohs RC, Morrison-Bogorad M, Phelps C, Reiman E, Sabbagh M, Sano M, Schneider LS, Siemers E, Tariot P, Touchon J, Vellas B, Bain LJ. Developing a national strategy to prevent dementia: Leon Thal Symposium 2009. Alzheimers Dement. 2010;6:89–97. doi: 10.1016/j.jalz.2010.01.008. [DOI] [PMC free article] [PubMed] [Google Scholar]
- [48].Reiman EM, Langbaum JB, Tariot PN. Alzheimer’s prevention initiative: a proposal to evaluate presymptomatic treatments as quickly as possible. Biomark Med. 2010;4:3–14. doi: 10.2217/bmm.09.91. [DOI] [PMC free article] [PubMed] [Google Scholar]
- [49].Mormino EC, Kluth JT, Madison CM, Rabinovici GD, Baker SL, Miller BL, Koeppe RA, Mathis CA, Weiner MW, Jagust WJ. Episodic memory loss is related to hippocampal-mediated {beta}-amyloid deposition in elderly subjects. Brain. 2008 doi: 10.1093/brain/awn320. [DOI] [PMC free article] [PubMed] [Google Scholar]
- [50].Jack CR, Jr., Lowe VJ, Senjem ML, Weigand SD, Kemp BJ, Shiung MM, Knopman DS, Boeve BF, Klunk WE, Mathis CA, Petersen RC. 11C PiB and structural MRI provide complementary information in imaging of Alzheimer’s disease and amnestic mild cognitive impairment. Brain. 2008;131:665–680. doi: 10.1093/brain/awm336. [DOI] [PMC free article] [PubMed] [Google Scholar]
- [51].Bourgeat P, Chetelat G, Villemagne VL, Fripp J, Raniga P, Pike K, Acosta O, Szoeke C, Ourselin S, Ames D, Ellis KA, Martins RN, Masters CL, Rowe CC, Salvado O, Group AR. Beta-amyloid burden in the temporal neocortex is related to hippocampal atrophy in elderly subjects without dementia. Neurology. 2010;74:121–127. doi: 10.1212/WNL.0b013e3181c918b5. [DOI] [PubMed] [Google Scholar]
- [52].Storandt M, Mintun MA, Head D, Morris JC. Cognitive decline and brain volume loss as signatures of cerebral amyloid-beta peptide deposition identified with Pittsburgh compound B: cognitive decline associated with Abeta deposition. Arch Neurol. 2009;66:1476–1481. doi: 10.1001/archneurol.2009.272. [DOI] [PMC free article] [PubMed] [Google Scholar]
- [53].Becker JA, Hedden T, Carmasin J, Maye J, Rentz DM, Putcha D, Fischl B, Greve DN, Marshall GA, Salloway S, Marks D, Buckner RL, Sperling RA, Johnson KA. Amyloid-beta associated cortical thinning in clinically normal elderly. Ann Neurol. 2011;69:1032–1042. doi: 10.1002/ana.22333. [DOI] [PMC free article] [PubMed] [Google Scholar]
- [54].Carlson NE, Moore MM, Dame A, Howieson D, Silbert LC, Quinn JF, Kaye JA. Trajectories of brain loss in aging and the development of cognitive impairment. Neurology. 2008;70:828–833. doi: 10.1212/01.wnl.0000280577.43413.d9. [DOI] [PubMed] [Google Scholar]
- [55].Jack CR, Jr., Shiung MM, Weigand SD, O’Brien PC, Gunter JL, Boeve BF, Knopman DS, Smith GE, Ivnik RJ, Tangalos EG, Petersen RC. Brain atrophy rates predict subsequent clinical conversion in normal elderly and amnestic MCI. Neurology. 2005;65:1227–1231. doi: 10.1212/01.wnl.0000180958.22678.91. [DOI] [PMC free article] [PubMed] [Google Scholar]
- [56].Rusinek H, De Santi S, Frid D, Tsui WH, Tarshish CY, Convit A, de Leon MJ. Regional brain atrophy rate predicts future cognitive decline: 6-year longitudinal MR imaging study of normal aging. Radiology. 2003;229:691–696. doi: 10.1148/radiol.2293021299. [DOI] [PubMed] [Google Scholar]
- [57].Kaye JA, Swihart T, Howieson D, Dame A, Moore MM, Karnos T, Camicioli R, Ball M, Oken B, Sexton G. Volume loss of the hippocampus and temporal lobe in healthy elderly persons destined to develop dementia. Neurology. 1997;48:1297–1304. doi: 10.1212/wnl.48.5.1297. [DOI] [PubMed] [Google Scholar]
- [58].Jack CR, Jr., Shiung MM, Weigand SD, O’Brien PC, Gunter JL, Boeve BF, Knopman DS, Smith GE, Ivnik RJ, Tangalos EG, Petersen RC, Jack CR, Jr., Shiung MM, Gunter JL, O’Brien PC, Weigand SD, Knopman DS, Boeve BF, Ivnik RJ, Smith GE, Cha RH, Tangalos EG, Petersen RC. Brain atrophy rates predict subsequent clinical conversion in normal elderly and amnestic MCI Comparison of different MRI brain atrophy rate measures with clinical disease progression in AD. Neurology. 2005;65:1227–1231. doi: 10.1212/01.wnl.0000180958.22678.91. [DOI] [PMC free article] [PubMed] [Google Scholar]
- [59].Adak S, Illouz K, Gorman W, Tandon R, Zimmerman EA, Guariglia R, Moore MM, Kaye JA. Predicting the rate of cognitive decline in aging and early Alzheimer disease. Neurology. 2004;63:108–114. doi: 10.1212/01.wnl.0000132520.69612.ab. [DOI] [PubMed] [Google Scholar]
- [60].Apostolova LG, Mosconi L, Thompson PM, Green AE, Hwang KS, Ramirez A, Mistur R, Tsui WH, de Leon MJ. Subregional hippocampal atrophy predicts Alzheimer’s dementia in the cognitively normal. Neurobiol Aging. 2008 doi: 10.1016/j.neurobiolaging.2008.08.008. [DOI] [PMC free article] [PubMed] [Google Scholar]
- [61].Schlosser R, Hutchinson M, Joseffer S, Rusinek H, Saarimaki A, Stevenson J, Dewey SL, Brodie JD. Functional magnetic resonance imaging of human brain activity in a verbal fluency task. J Neurol Neurosurg Psychiatry. 1998;64:492–498. doi: 10.1136/jnnp.64.4.492. [DOI] [PMC free article] [PubMed] [Google Scholar]
- [62].Jagust W, Gitcho A, Sun F, Kuczynski B, Mungas D, Haan M. Brain imaging evidence of preclinical Alzheimer’s disease in normal aging. Ann Neurol. 2006;59:673–681. doi: 10.1002/ana.20799. [DOI] [PubMed] [Google Scholar]
- [63].Murphy EA, Holland D, Donohue M, McEvoy LK, Hagler DJ, Jr., Dale AM, Brewer JB. I. Alzheimer’s Disease Neuroimaging, Six-month atrophy in MTL structures is associated with subsequent memory decline in elderly controls. Neuroimage. 2010;53:1310–1317. doi: 10.1016/j.neuroimage.2010.07.016. [DOI] [PMC free article] [PubMed] [Google Scholar]
- [64].Fjell AM, Walhovd KB, Fennema-Notestine C, McEvoy LK, Hagler DJ, Holland D, Brewer JB, Dale AM. One-year brain atrophy evident in healthy aging. J Neurosci. 2009;29:15223–15231. doi: 10.1523/JNEUROSCI.3252-09.2009. [DOI] [PMC free article] [PubMed] [Google Scholar]
- [65].Fjell AM, Walhovd KB, Fennema-Notestine C, McEvoy LK, Hagler DJ, Holland D, Blennow K, Brewer JB, Dale AM. Brain atrophy in healthy aging is related to CSF levels of Abeta1-42. Cereb Cortex. 2010;20:2069–2079. doi: 10.1093/cercor/bhp279. [DOI] [PMC free article] [PubMed] [Google Scholar]
- [66].den Heijer T, Geerlings MI, Hoebeek FE, Hofman A, Koudstaal PJ, Breteler MM. Use of hippocampal and amygdalar volumes on magnetic resonance imaging to predict dementia in cognitively intact elderly people. Arch Gen Psychiatry. 2006;63:57–62. doi: 10.1001/archpsyc.63.1.57. [DOI] [PubMed] [Google Scholar]
- [67].den Heijer T, van der Lijn F, Koudstaal PJ, Hofman A, van der Lugt A, Krestin GP, Niessen WJ, Breteler MM. A 10-year follow-up of hippocampal volume on magnetic resonance imaging in early dementia and cognitive decline. Brain. 2010;133:1163–1172. doi: 10.1093/brain/awq048. [DOI] [PubMed] [Google Scholar]
- [68].Smith CD, Chebrolu H, Wekstein DR, Schmitt FA, Jicha GA, Cooper G, Markesbery WR. Brain structural alterations before mild cognitive impairment. Neurology. 2007;68:1268–1273. doi: 10.1212/01.wnl.0000259542.54830.34. [DOI] [PubMed] [Google Scholar]
- [69].Smith CD, Chebrolu H, Markesbery WR, Liu J. Improved Predictive Model for Presymptomatic Mild Cognitive Impairment and Alzheimer’s Disease. Neurological Research. 2008 doi: 10.1179/174313208X327973. In Press. [DOI] [PubMed] [Google Scholar]
- [70].Martin SB, Smith CD, Collins HR, Schmitt FA, Gold BT. Evidence that volume of anterior medial temporal lobe is reduced in seniors destined for mild cognitive impairment. Neurobiol Aging. 2010;31:1099–1106. doi: 10.1016/j.neurobiolaging.2008.08.010. [DOI] [PMC free article] [PubMed] [Google Scholar]
- [71].Dickerson BC, Stoub TR, Shah RC, Sperling RA, Killiany RJ, Albert MS, Hyman BT, Blacker D, Detoledo-Morrell L. Alzheimer-signature MRI biomarker predicts AD dementia in cognitively normal adults. Neurology. 2011;76:1395–1402. doi: 10.1212/WNL.0b013e3182166e96. [DOI] [PMC free article] [PubMed] [Google Scholar]
- [72].Honea RA, Swerdlow RH, Vidoni ED, Burns JM. Progressive regional atrophy in normal adults with a maternal history of Alzheimer disease. Neurology. 2011;76:822–829. doi: 10.1212/WNL.0b013e31820e7b74. [DOI] [PMC free article] [PubMed] [Google Scholar]
- [73].Honea RA, Swerdlow RH, Vidoni ED, Goodwin J, Burns JM. Reduced gray matter volume in normal adults with a maternal family history of Alzheimer disease. Neurology. 2010;74:113–120. doi: 10.1212/WNL.0b013e3181c918cb. [DOI] [PMC free article] [PubMed] [Google Scholar]
- [74].Sparks DL. Coronary artery disease, hypertension, ApoE, and cholesterol: a link to Alzheimer’s disease? Ann N Y Acad Sci. 1997;826:128–146. doi: 10.1111/j.1749-6632.1997.tb48466.x. [DOI] [PubMed] [Google Scholar]
- [75].Caselli RJ, Dueck AC, Osborne D, Sabbagh MN, Connor DJ, Ahern GL, Baxter LC, Rapcsak SZ, Shi J, Woodruff BK, Locke DE, Snyder CH, Alexander GE, Rademakers R, Reiman EM. Longitudinal modeling of age-related memory decline and the APOE epsilon4 effect. N Engl J Med. 2009;361:255–263. doi: 10.1056/NEJMoa0809437. [DOI] [PMC free article] [PubMed] [Google Scholar]
- [76].Marquis S, Moore MM, Howieson DB, Sexton G, Payami H, Kaye JA, Camicioli R. Independent predictors of cognitive decline in healthy elderly persons. Arch Neurol. 2002;59:601–606. doi: 10.1001/archneur.59.4.601. [DOI] [PubMed] [Google Scholar]
- [77].Reiman EM, Chen K, Liu X, Bandy D, Yu M, Lee W, Ayutyanont N, Keppler J, Reeder SA, Langbaum JB, Alexander GE, Klunk WE, Mathis CA, Price JC, Aizenstein HJ, DeKosky ST, Caselli RJ. Fibrillar amyloid-beta burden in cognitively normal people at 3 levels of genetic risk for Alzheimer’s disease. Proc Natl Acad Sci U S A. 2009;106:6820–6825. doi: 10.1073/pnas.0900345106. [DOI] [PMC free article] [PubMed] [Google Scholar]
- [78].Wishart HA, Saykin AJ, McAllister TW, Rabin LA, McDonald BC, Flashman LA, Roth RM, Mamourian AC, Tsongalis GJ, Rhodes CH. Regional brain atrophy in cognitively intact adults with a single APOE epsilon4 allele. Neurology. 2006;67:1221–1224. doi: 10.1212/01.wnl.0000238079.00472.3a. [DOI] [PubMed] [Google Scholar]
- [79].Fox NC, Warrington EK, Stevens JM, Rossor MN. Atrophy of the hippocampal formation in early familial Alzheimer’s disease. A longitudinal MRI study of at-risk members of a family with an amyloid precursor protein 717Val-Gly mutation. Ann N.Y.Acad Sci. 1996;777:226–232. doi: 10.1111/j.1749-6632.1996.tb34423.x. [DOI] [PubMed] [Google Scholar]
- [80].Fox NC, Warrington EK, Rossor MN. Serial magnetic resonance imaging of cerebral atrophy in preclinical Alzheimer’s disease. Lancet. 1999;353:2125. doi: 10.1016/S0140-6736(99)00496-1. [DOI] [PubMed] [Google Scholar]
- [81].Fortea J, Sala-Llonch R, Bartres-Faz D, Bosch B, Llado A, Bargallo N, Molinuevo JL, Sanchez-Valle R. Increased cortical thickness and caudate volume precede atrophy in PSEN1 mutation carriers. J Alzheimers Dis. 2010;22:909–922. doi: 10.3233/JAD-2010-100678. [DOI] [PubMed] [Google Scholar]
- [82].Knight WD, Kim LG, Douiri A, Frost C, Rossor MN, Fox NC. Acceleration of cortical thinning in familial Alzheimer’s disease. Neurobiol Aging. 2009 doi: 10.1016/j.neurobiolaging.2009.11.013. [DOI] [PubMed] [Google Scholar]
- [83].Lopera F, Ardilla A, Martinez A, Madrigal L, Arango-Viana JC, Lemere CA, Arango-Lasprilla JC, Hincapie L, Arcos-Burgos M, Ossa JE, Behrens IM, Norton J, Lendon C, Goate AM, Ruiz-Linares A, Rosselli M, Kosik KS. Clinical features of early-onset Alzheimer disease in a large kindred with an E280A presenilin-1 mutation. Jama. 1997;277:793–799. [PubMed] [Google Scholar]
- [84].Acosta-Baena N, Sepulveda-Falla D, Lopera-Gomez CM, Jaramillo-Elorza MC, Moreno S, Aguirre-Acevedo DC, Saldarriaga A, Lopera F. Pre-dementia clinical stages in presenilin 1 E280A familial early-onset Alzheimer’s disease: a retrospective cohort study. Lancet Neurol. 2011;10:213–220. doi: 10.1016/S1474-4422(10)70323-9. [DOI] [PubMed] [Google Scholar]
- [85].Quiroz YT, Budson AE, Celone K, Ruiz A, Newmark R, Castrillon G, Lopera F, Stern CE. Hippocampal hyperactivation in presymptomatic familial Alzheimer’s disease. Ann Neurol. 2010;68:865–875. doi: 10.1002/ana.22105. [DOI] [PMC free article] [PubMed] [Google Scholar]
- [86].Cummings JL, Doody R, Clark C. Disease-modifying therapies for Alzheimer disease: challenges to early intervention. Neurology. 2007;69:1622–1634. doi: 10.1212/01.wnl.0000295996.54210.69. [DOI] [PubMed] [Google Scholar]
- [87].Shaw LM, Vanderstichele H, Knapik-Czajka M, Figurski M, Coart E, Blennow K, Soares H, Simon AJ, Lewczuk P, Dean RA, Siemers E, Potter W, Lee VM, Trojanowski JQ. Qualification of the analytical and clinical performance of CSF biomarker analyses in ADNI. Acta Neuropathol. 2011;121:597–609. doi: 10.1007/s00401-011-0808-0. [DOI] [PMC free article] [PubMed] [Google Scholar]
- [88].Hoyert DL, Kung H-C, Smith BL. Deaths: Preliminary Data for 2003 National Vital Statistics Reports. 2005;53 [PubMed] [Google Scholar]
- [89].Knight BG, Silverstein M, McCallum TJ, Fox LS. A sociocultural stress and coping model for mental health outcomes among African American caregivers in Southern California. J Gerontol B Psychol Sci Soc Sci. 2000;55:P142–150. doi: 10.1093/geronb/55.3.p142. [DOI] [PubMed] [Google Scholar]
- [90].Yesavage JA, O’Hara R, Kraemer H, Noda A, Taylor JL, Ferris S, Gely-Nargeot MC, Rosen A, Friedman L, Sheikh J, Derouesne C. Modeling the prevalence and incidence of Alzheimer’s disease and mild cognitive impairment. J Psychiatr Res. 2002;36:281–286. doi: 10.1016/s0022-3956(02)00020-1. [DOI] [PubMed] [Google Scholar]
- [91].Braak H, Braak E. Frequency of stages of Alzheimer-related lesions of different age categories. Neurobiol.Aging. 1997;18:351–357. doi: 10.1016/s0197-4580(97)00056-0. [DOI] [PubMed] [Google Scholar]
- [92].Ohm TG, Muller H, Braak H, Bohl J. Close-meshed prevalence rates of different stages as a tool to uncover the rate of Alzheimer’s disease-related neurofibrillary changes. Neuroscience. 1995;64:209–217. doi: 10.1016/0306-4522(95)90397-p. [DOI] [PubMed] [Google Scholar]