Abstract
The general consensus from epidemiological game-theory studies is that vaccination coverage driven by self-interest (Nash vaccination) is generally lower than group-optimal coverage (utilitarian vaccination). However, diseases that become more severe with age, such as chickenpox, pose an exception to this general consensus. An individual choice to be vaccinated against chickenpox has the potential to harm those not vaccinated by increasing the average age at infection and thus the severity of infection as well as those already vaccinated by increasing the probability of breakthrough infection. To investigate the effects of these externalities on the relationship between Nash and utilitarian vaccination coverages for chickenpox, we developed a game-theory epidemic model that we apply to the USA and Israel, which has different vaccination programmes, vaccination and treatment costs, as well as vaccination coverage levels. We find that the increase in chickenpox severity with age can reverse the typical relationship between utilitarian and Nash vaccination coverages in both the USA and Israel. Our model suggests that to obtain herd immunity of chickenpox vaccination, subsidies or external regulation should be used if vaccination costs are high. By contrast, for low vaccination costs, improving awareness of the vaccine and the potential cost of chickenpox infection is crucial.
Keywords: chickenpox, Nash equilibrium, utilitarian vaccination, game theory, epidemic model
1. Introduction
Chickenpox, a highly transmissible childhood disease that becomes more severe with age, has a 10–30 times greater mortality rate for adults than for juveniles [1,2]. Vaccination of children is currently recommended by the Centers for Disease Control (CDC) in the USA prior to the widespread availability of the vaccine in 1995, there were an estimated 4 million annual cases of chickenpox resulting in 11 000 hospitalizations and 100 deaths in the USA [3,4]. Currently, most states in the USA mandate vaccination for school admission, resulting in vaccination coverage close to 90 per cent for juveniles [5]. By 2002, because of this mandated vaccination, the number of hospitalizations owing to chickenpox had decreased by 88 per cent [6].
In contrast to the USA, childhood immunization against chickenpox is not a standard practice in most of the world [7,8]. In Israel, for example, vaccination is voluntary and has been steadily increasing since the availability of chickenpox vaccine in 2000 [9]. Yet, vaccination coverage is less than 50 per cent despite the low cost of vaccination in Israel [10,11].
Chickenpox vaccination decisions at the individual level may not always correlate with population-coverage externalities, costs and benefits that do not directly affect the individual. When an individual is vaccinated, costs and benefits accrue both to that individual directly and to the society as a whole. Internal costs include not only expenses but also vaccination risk and inconvenience (table 1). The internal benefit to an individual is direct protection from the disease.
Table 1.
Nomenclature.
| symbol | description |
|---|---|
| r | births per year |
| f | maturity rate |
| d1 | juvenile death rate |
| d2 | adult death rate |
| ks,1 | juvenile death rate from varicella (no vaccine) |
| ks,2 | adult death rate from varicella (no vaccine) |
| kv,1 | varicella mortality of vaccinated juveniles |
| kv,2 | varicella mortality of vaccinated adults |
| σ | 1/duration of incubation period |
| δs | 1/duration of infectious period (no vaccine) |
| δv | 1/duration of infectious period if vaccinated |
| β1 | transmission rate—juveniles to juveniles |
| β2 | transmission rate—adults to adults, adults to juveniles and juveniles to adults |
| v | vaccination probability |
| p | probability of primary failure |
| φ | probability of temporary protection |
| ε | probability of becoming infected if vaccinated |
| b | probability that immunity will be ‘boosted’ if exposed to varicella while vaccine protected |
| ρ | relative infectiousness of breakthrough varicella |
| ψ | waning rate (year−1) |
| λ1 | forces of infection in juveniles |
| λ2 | forces of infection in adults |
| pIJ | infection probability for juveniles |
| pBJ | breakthrough probability for juveniles |
| pIA | infection probability for adults |
| pBA | breakthrough probability for adults |
| CIJ | total expected costs of infection per case in juveniles |
| CIA | total expected costs of infection per case in adults |
| CBJ | total expected costs of breakthrough infection in juveniles |
| CBA | total expected costs of breakthrough infection in adults |
| Cv | vaccination cost |
| DR | disutility of vaccine refusal (expected cost to individuals who do not receive the vaccine) |
| DV | disutility of vaccination (expected cost to vaccinated individuals) |
| Dave | average disutility to the society (expected societal cost per person) |
| VN | Nash equilibrium vaccination coverage |
From the utilitarian perspective, externalities are also important. One externality of vaccination is the reduction of transmission to others through herd immunity. For most diseases, this reduced transmission is a positive externality [12,13], because any reduction in the total number of cases will reduce the societal burden of disease. Another externality of vaccination is an increased average age of infection. Generally, this externality is inconsequential, or even positive. However, chickenpox can present an exception to this generalization, because its virulence increases with age. This externality is potentially negative, depending on the extent of vaccination coverage. If there is already widespread vaccination, the absolute infection probabilities in both childhood and adulthood decrease with further vaccination, making the externality of the decision to vaccinate positive [14–17]. However, if there is low vaccination coverage, the absolute probability of adult infection increases, making the externality of the decision to vaccinate negative for the rest of the population [14–16].
Cost-effectiveness studies have examined chickenpox vaccination from societal and healthcare provider perspectives [1,18–20]. There has been no epidemiological game-theory analysis to determine how perceived costs and benefits affect chickenpox vaccination decisions or to assess whether the optimal coverage of vaccination may be achieved through individual action. The general consensus is that the Nash coverage of vaccination is lower than the community optimum owing to the positive externality of vaccination [13,21,22].
We present the first application of epidemiological game-theory modelling to chickenpox vaccination, which demonstrates that the relationship between the Nash and utilitarian vaccination is complicated by a positive correlation between age and disease severity. We determine how the relationship between the utilitarian and Nash equilibrium coverages of chickenpox vaccination changes as costs of vaccination are varied for two sample countries with different vaccination programmes, the USA and Israel. In contrast to the current consensus, we show that vaccination coverage for the Nash equilibrium can actually be higher than that for the community optimum depending on the costs and efficacy of the vaccine owing to potential negative externalities. We also find that there can be three Nash equilibria, two stable and one unstable, for both the USA and Israel.
2. Methods
2.1. The model
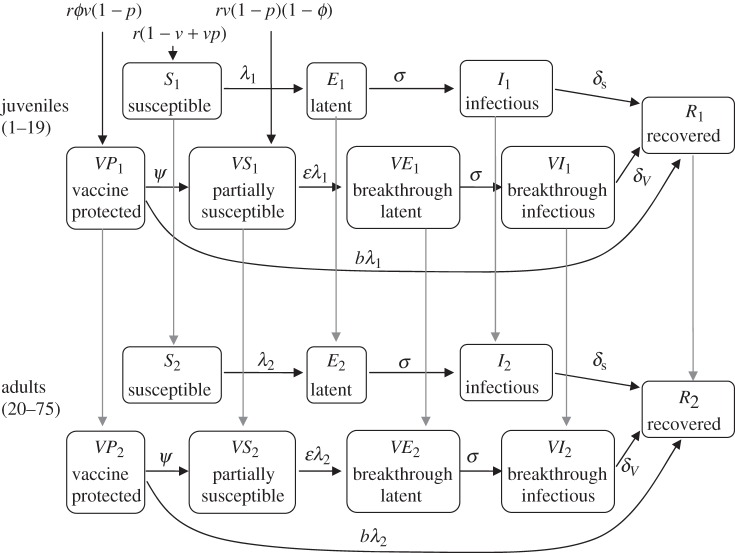
We developed an age-structured epidemic model of chickenpox transmission and vaccination, which separates individuals on the basis of their infection, immunity and vaccination status (figure 1). The model was parametrized from epidemiological, clinical and economic data for the USA and Israel (tables 2 and 3). Juveniles enter the model at an age of 1 year in either the susceptible or vaccinated juvenile class and then move into the adult stage at age 20, consistent with clinical data showing a sharp increase in chickenpox morbidity at 20 years [3,25]. The birth rate (r) is assumed to be constant, such that the population size is maintained in the absence of chickenpox (table 2).
Figure 1.
Flowchart of chickenpox epidemiological model. For the simplicity of the flowchart, we did not draw death terms into the chart, ks,1,ks,2, kv,1 and kv,2 indicating juvenile death rate from varicella with no vaccine, adult death rate from varicella with no vaccine, varicella mortality of vaccinated juveniles and varicella mortality of vaccinated adults, respectively.
Table 2.
Epidemiological parameters.
| parameter |
values per year unit | remarks/sources | |
|---|---|---|---|
| r | births per year | 0.0127 | r = d2(d1 + f)/(d2 + f) |
| f | maturity rate | 1/19 | |
| d1 | juvenile death rate | 20/100 000 | US Census, CDC/NCHS |
| d2 | adult death rate | 1/55 | |
| ks,1 | juvenile death rate from varicella (no vaccine) | 1/100 000 | [3] |
| ks,2 | adult death rate from varicella (no vaccine) | 20/100 000 | |
| kv,1 | varicella mortality of vaccinated juveniles | 1/10 000 000 | [1] |
| kv,2 | varicella mortality of vaccinated adults | 20/10 000 000 | |
| σ | 1/duration of incubation period | 26 | [16] |
| δs | 1/duration of infectious period (no vaccine) | 52 | |
| δv | 1/duration of infectious period if vaccinated | 81 | [17] |
| β1 | transmission rate—juveniles to juveniles | 1760 | based on Ro = 9.4 and the probability (approx. 90%) of acquiring varicella by age 20 prior to the availability of vaccine |
| β2 | transmission rate—adults to adults, adults to juveniles and juveniles to adults | 250 | |
| v | vaccination probability | (variable of interest) | |
Table 3.
Expected cost of vaccination for chickenpox (US dollars, 2008). Sources: CDC Vaccine Price List, Zhou et al. [6], Halloran et al. [16], Brisson & Edmunds [23], Ginsberg & Somekh [24] and US Bureau of Labor Statistics.
| event |
expected cost (discounted values at age zero) |
||
|---|---|---|---|
| USA | Israel | ||
| varicella juvenile | CIJ | 127 | 160 |
| varicella adult | CIA | 405 | 637 |
| breakthrough varicella juvenile | CBJ | 22 | 40 |
| breakthrough varicella adult | CBA | 67 | 16 |
| total vaccination costs per vaccinated juvenile | Cv | 117 | 10 |
Our model (figure 1; appendix A) includes the probability of vaccine failure, p, and a temporary protection probability ϕ [14,15,26,27]. Vaccine immunity wanes at rate ψ, moving individuals from the protected to the partially protected class [14,15,26,27]. If exposed to disease while in the protected class, sub-clinical infection will develop with a probability of b, boosting immunity and moving the individual directly into the recovered class [14,15,26,27]. If exposed to disease while in the partially protected class, the probability of developing clinical chickenpox, ε, is reduced relative to the unvaccinated susceptible individuals [14,15,26,27]. If a clinical infection develops after vaccination, the resulting breakthrough disease is relatively mild with a shorter infectious period, reduced infectiousness and a greatly reduced risk of mortality compared with infection of unvaccinated individuals [1,15,28]. The baseline values of the five vaccine efficacy parameters (p, ϕ, ψ, b and ε) are summarized in table 4. In our analyses, baseline values are used unless explicitly stated.
Table 4.
Vaccine efficacy parameter values. Sources: Brisson et al. [14,15], Chaves et al. [26] and Seward et al. [27].
| parameter |
baseline values | highest efficacy | lowest efficacy | |
|---|---|---|---|---|
| p | probability of primary failure | 0.035 | 0.01 | 0.06 |
| φ | probability of temporary protection | 0.95 | 1 | 0.9 |
| ε | probability of becoming infected if vaccinated | 0.75 | 0.5 | 1 |
| b | probability that immunity will be ‘boosted’ if exposed to varicella while vaccine protected | 0.75 | 1 | 0.5 |
| ρ | relative infectiousness of breakthrough varicella | 0.6 | 0.2 | 1 |
| ψ | waning rate (year−1) | 0.06 | 0.02 | 0.1 |
On the basis that juveniles have more contacts with other juveniles than they do with adults or than adults have with each other, the transmission parameters, β1 for infection between juveniles and β2 for infection involving adults, are calculated based on an R0 of 9.4 [29–31]. We calculate β1 and β2 by fitting the model to observed distribution of chickenpox prior to the vaccine, in which 90 per cent of individuals were infected by age 20 [32].
2.2. Computing disutilities
The average costs of the vaccination, chickenpox infection and breakthrough infection in adults and juveniles, were calculated based on reported probabilities of complications and treatment costs for each age group [1,6,16,18,23,33]. Our analysis focused on total costs, which incorporate both direct costs (e.g. physician visits, hospitalization and death related costs), as well as indirect costs (work time lost owing to chickenpox; table 3). It should be noted that there are two doses currently given in the USA, but a second dose of varicella vaccine is not widely recommended outside of the USA. In order to apply our model to the regions outside the USA, we only consider one dose in this work. We define the disutility of vaccine refusal as the expected cost to individuals who do not receive the vaccine,
| 2.1 |
the disutility of vaccination as the expected cost to vaccinated individuals,
 |
2.2 |
and the average disutility (Dave) to the society as the expected societal cost per person,
| 2.3 |
Equations (2.1–2.3), CIJ and CIA cover the total expected costs of infection per case in juveniles and adults, respectively. CBJ and CBA denote the total expected costs of breakthrough infection in juveniles and adults, respectively. The infection and breakthrough probabilities for juveniles (pIJ and pBJ) and for adults (pIA and pBA) are defined in appendix B.
2.3. Evaluating the Nash and utilitarian vaccination coverages
We determined the Nash equilibrium (VN) by identifying the vaccination coverage whereby an individual has no incentive to change its strategies [13,34]. This equilibrium can occur anywhere from 0 to 100 per cent vaccination. Zero vaccination will be a Nash equilibrium if the disutility of refusal is lower than the disutility of vaccination when no one in the population has been vaccinated. Similarly, there will be a Nash equilibrium at 100 per cent vaccination if the disutility of vaccination is lower than the disutility of refusal when the entire population has been vaccinated. Finally, there will be a Nash equilibrium wherever the disutilities of vaccination and refusal are equal. If, at a vaccination coverage slightly below such a Nash equilibrium, the disutility of refusal is lower than the disutility of vaccination, the equilibrium will be stable; otherwise, the equilibrium will be unstable.
The utilitarian optimum coverage of vaccination occurs when total expected costs to the society are minimized [13,34]. Thus, we minimize equation (2.3) with respect to vaccination coverage v to calculate the utilitarian vaccination coverage. A summary of symbols used is given in table 1.
3. Results
3.1. Chickenpox infection and breakthrough probabilities
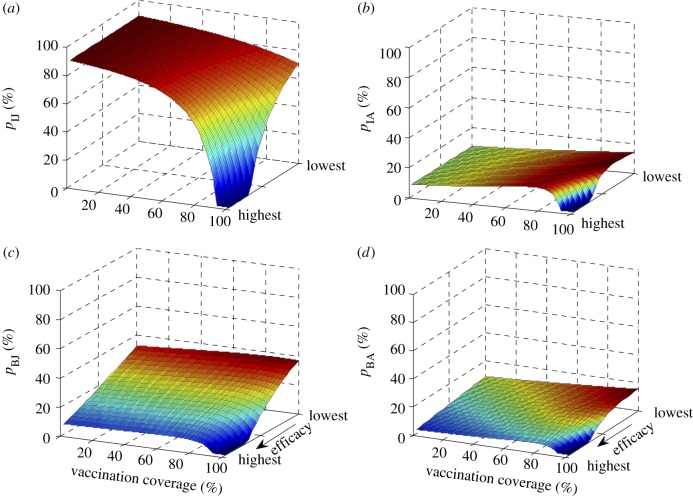
We found that without vaccination, infection probabilities are 90 per cent during childhood and 8.5 per cent during adulthood (figure 2a,b), consistent with actual infection probabilities prior to vaccine [32]. If the vaccine is highly efficacious, herd immunity is achieved with 92 per cent vaccination coverage. At low vaccine efficacies, herd immunity is not reached even when the entire population is vaccinated (figure 2).
Figure 2.
Probabilities of infection as a function of vaccine coverage and vaccine efficacy. (a,b) Probabilities of contracting chickenpox during childhood (pIJ) and adulthood (pIA) for those not vaccinated. (c,d) Probabilities of breakthrough infection during childhood (pBJ) and adulthood (pBA) for those who have received the vaccine. The vaccine efficacy varies linearly from lowest to highest values (table 4).
For unvaccinated juveniles (including those unprotected due to vaccination failure), the infection probability decreases as the vaccination coverage increases (figure 2a). However, the infection probability for adults rises with greater vaccination coverage (figure 2b). For a high vaccine efficacy, the infection probability for adults peaks at 18 per cent, when the background vaccination coverage is 77 per cent (figure 2b). As herd immunity is approached, the infection probability for adults quickly drops below the pre-vaccination coverage level (figure 2b). For a low vaccine efficacy, the infection probability for adults peaks at 17 per cent when the background vaccination coverage is near 100 per cent (figure 2b).
The probability of breakthrough infection for both successfully vaccinated juveniles (figure 2c) and adults (figure 2d) initially rises as the vaccination coverage increases. This is due to a decrease in boosting from chickenpox exposure as the force of infection falls, resulting in fewer fully protected individuals relative to partially protected individuals. At low vaccination coverages, the chance of these partially protected individuals becoming infected remains relatively high leading to a high prevalence of breakthrough infections. As herd immunity is approached, the chance of infection for partially protected individuals becomes very low, reducing the overall probability of breakthrough infection. The peak probabilities of breakthrough infection in childhood range from 7 to 37 per cent (figure 2c) and in adulthood from 8 to 18 per cent as vaccine efficacy decreases (figure 2d).
3.2. The effect of vaccination cost on the Nash equilibrium
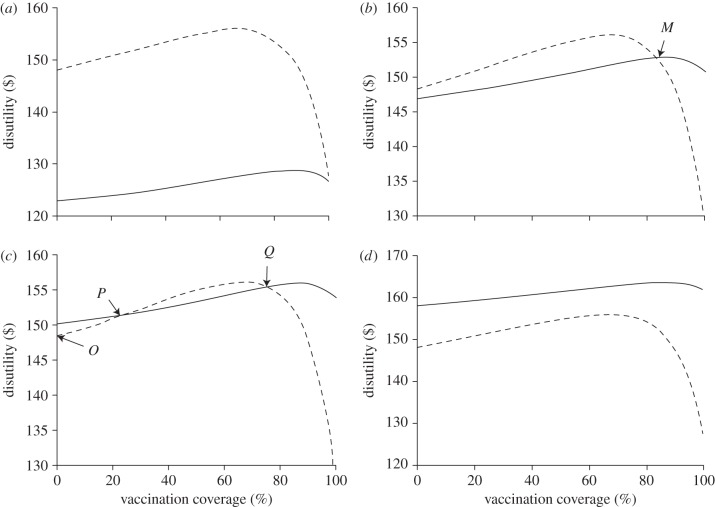
We evaluated the impact of vaccination cost, Cv, on the Nash equilibrium. For low vaccination cost (Cv = $108), the disutility of refusal is larger than the disutility of vaccination for any given vaccination coverage (figure 3a). In this case, 100 per cent vaccination is the unique stable Nash equilibrium. At a vaccination coverage slightly below 100 per cent, the disutility of refusal is larger than the disutility of vaccination. Consequently, non-vaccinators are motivated to switch to become vaccinators, this increases the vaccination coverage resulting in a stable Nash equilibrium at 100 per cent coverage. If we increase vaccination cost, the disutilities of vaccination and refusal intersect once between 0 and 100 per cent vaccination (figure 3b, for Cv = $134). At the intersection point (M in figure 3b), individuals are indifferent about whether to receive the vaccine. At lower vaccination coverages, individuals would prefer to be vaccinated. By contrast, at greater vaccination coverages, individuals would prefer not to be vaccinated. Thus, this intersection is the stable Nash equilibrium (figure 3b).
Figure 3.
Disutility of vaccination (solid line) and disutility of refusal (dashed line) across vaccine coverage at different costs of vaccination Cv in the USA. (a) Cv = $108, single stable Nash equilibrium at 100%; (b) Cv = $134, single stable Nash equilibrium at point M; (c) Cv = $137, three Nash equilibria: two stable (O and Q) and one unstable (p); (d) Cv = $145, single Nash equilibrium at 0%.
If we increase vaccination cost further (Cv = $137), the disutility of vaccination will intersect the disutility of refusal at two different points, p and Q (figure 3c). The vaccination coverage at p is an unstable Nash equilibrium, while Q is a stable Nash equilibrium (the first Nash). Another stable Nash equilibrium is 0 per cent vaccination at O (the second Nash). The intermediate equilibrium at point p is unstable because at slightly lower vaccination coverages, individuals would prefer not to be vaccinated, whereas at slightly greater vaccination coverages, individuals would prefer to be vaccinated. Thus, if the vaccination coverages were to move even slightly away from this unstable Nash equilibrium, we would expect the population to move towards one of the stable Nash equilibria. For sufficiently high vaccination cost (Cv = $145), the disutility of refusal will be smaller than the disutility of vaccination for any vaccination coverage (figure 3d). In this case, 0 per cent vaccination is the only stable Nash equilibrium.
3.3. Stable Nash versus utilitarian equilibria in the USA
Depending on vaccination cost, there is a single Nash equilibrium at different values of vaccination coverage: 100 per cent for Cv < $111, 0 per cent for Cv > $139, as well as near herd immunity if 111 < Cv < 136 (figure 4). By contrast, there are three Nash equilibria (two stable, at 0 and 100%, as well as one unstable) when $136 < Cv < $139 (figure 4). For these multiple Nash equilibria, the initial vaccination coverage determines the equilibrium state of the population: if the initial vaccination coverage is higher than the unstable equilibrium, the population will move towards the first stable Nash equilibrium at which there is an intermediate coverage of vaccination. By contrast, if the initial vaccination coverage is less than that at the unstable equilibrium, the population will settle on the 0 per cent stable Nash equilibrium (figure 4).
Figure 4.
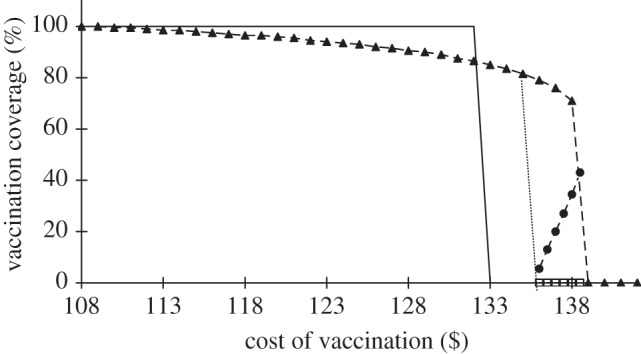
Nash equilibria versus utilitarian equilibria for a range of cost of vaccinations (Cv) in the USA. When $136 < Cv < $139, there are three Nash equilibria, two stable (first stable Nash: triangles; second stable Nash: squares) and one unstable (filled circles). Solid line (without symbols) indicates the utilitarian optima as a function of Cv.
Like the Nash equilibrium, the average societal disutility owing to chickenpox across vaccination coverage levels is calculated based on the disutilities of vaccination and refusal. This utilitarian vaccination coverage is found by minimizing the average disutility in equation (2.3) with respect to the vaccination coverage for fixed vaccination cost and efficacy parameters. Our calculations show that the utilitarian vaccination coverage is 100 per cent when Cv < $133 (figure 4). As vaccination cost is increased (Cv > $133), the utilitarian vaccination coverage shifts discontinuously to 0 per cent coverage (figure 4).
Nash and utilitarian vaccination coverages meet at 100 per cent when vaccination cost Cv ≤ $111 and at 0 per cent when Cv > $139 (figure 4). The utilitarian vaccination coverage is higher than the Nash equilibrium when $111 < Cv < $133. More importantly, the vaccination coverage at the Nash equilibrium is higher than the utilitarian coverage when $133 < Cv < $139 for the first Nash equilibrium and $133 < Cv < $136 for the second Nash equilibrium (figure 4). These results oppose the general conception that Nash coverage driven by self-interest is always lower than utilitarian vaccination.
The cost of chickenpox vaccination in the USA is $117 (table 3). For low vaccine efficacy, Nash and utilitarian vaccination coverages are both 100 per cent (figure 5). For vaccine efficacy from intermediate to high, Nash vaccination coverage is lower than the utilitarian optimum (figure 5). For the baseline vaccine efficacy, the Nash and utilitarian vaccination coverages are 93 and 100 per cent, respectively. These predictions are close to a vaccination coverage of 90 per cent in the USA [5].
Figure 5.
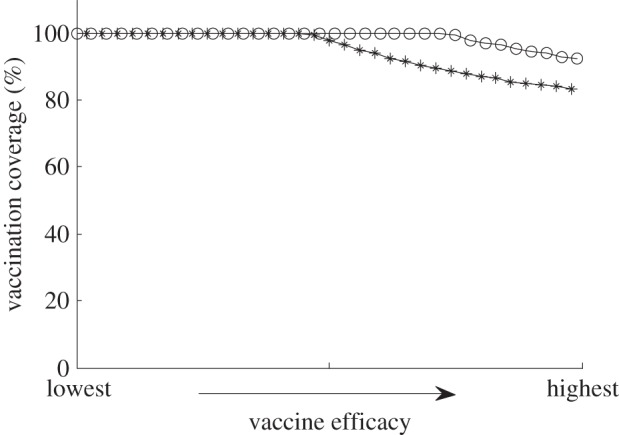
Nash (stars) and utilitarian (circles) vaccination levels as a function of vaccine efficacy for costs of vaccination Cv = $117 in the USA. For low vaccine efficacy, Nash and utilitarian vaccination levels are both equal to 100%. For vaccine efficacy from intermediate to high, the Nash vaccination coverage is lower than the utilitarian optimum. The vaccine efficacy varies linearly from lowest to highest values (table 4).
3.4. Stable Nash versus utilitarian equilibria in Israel
The Nash and utilitarian vaccination equilibria in Israel are similar to those calculated for the USA (figure 6). There are three Nash equilibria (two stable and one unstable), when $183 < Cv < $189. Nash and utilitarian vaccination coverages meet at 100 per cent, when Cv ≤ $182 and at 0 per cent when Cv > $199 (figure 6). The vaccination coverage at the first Nash equilibrium is higher than the utilitarian coverage when $183 < Cv < $189. This result again opposes the general understanding that the Nash equilibrium driven by self-interest is always lower than the utilitarian vaccination coverage.
Figure 6.
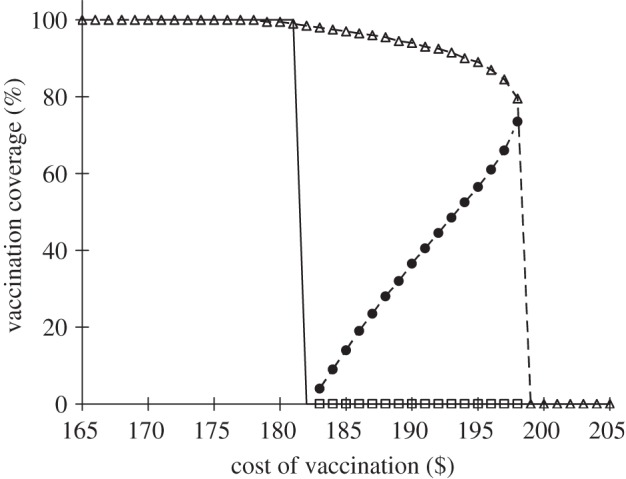
Nash equilibria versus utilitarian equilibria for a range of vaccination cost (Cv) in Israel. Solid line, utilitrian; triangles with dashed line, first Nash; filled circles with dashed line, unstable Nash; squares with dashed line, second Nash.
The Nash and utilitarian vaccination coverages are close to each other given a vaccine cost of $10 in Israel [24] (figure 7). The predicted vaccination coverages for both Nash and utilitarian are at least 90 per cent (figure 7), which is much higher than the voluntary vaccination coverage of 34.1 per cent, reported for Israel in 2005 [10], suggesting that education about chickenpox rather than further subsidy would be the most effective approach to promote vaccination.
Figure 7.
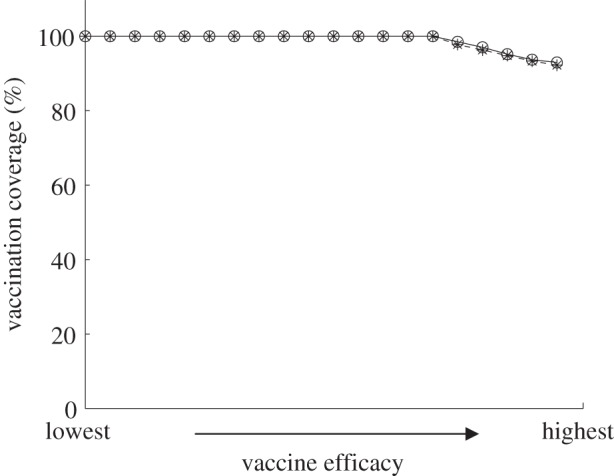
Nash (stars) and utilitarian (circles) vaccination levels as a function of vaccine efficacy for costs of vaccination Cv = $10 in Israel. The vaccine efficacy varies linearly from lowest to highest values (table 4).
4. Discussion
Our game-theory epidemic model demonstrates that vaccination cost is fundamental in determining the Nash and utilitarian equilibria of chickenpox vaccination in both the USA and Israel. When the vaccine is inexpensive, both the Nash and utilitarian vaccination coverages are either near herd immunity or at 100 per cent coverage. If the vaccine is very expensive, both the Nash and utilitarian vaccination coverages are 0 per cent. However, when the vaccine cost is intermediate relative to the infection cost, there can be three Nash equilibria (two stable and one unstable) and one of these Nash equilibria can be higher than the utilitarian vaccination coverage.
By determining how the Nash equilibrium differs from the utilitarian optimum, we can identify targets for intervention, such as subsidies or external regulation [13,34]. Generally, subsidies are required to achieve the utilitarian optimum [13,34]. However, for chickenpox, in many cases, subsidies would be unnecessary since the Nash equilibrium is already above the utilitarian optimum. In this case, subsidies would in fact exacerbate the discrepancy between the Nash equilibrium and the utilitarian optimum.
Depending on the vaccination cost, vaccination coverage can affect the utilitarian optimum differently. Low vaccination coverage can be less optimal to the population than no vaccination at all, given the potential for vaccination to raise the average age of infection and thus also elevate the virulence of chickenpox. Therefore, if a high vaccination coverage cannot be achieved, a vaccination campaign could perversely increase economic burden owing to the disease for the population overall. If the vaccine is expensive, no vaccination is the utilitarian optimum. However, if the vaccination cost is low, any vaccination is preferable to no vaccination. Intermediate levels of vaccination costs generate the most significant discrepancy between the Nash equilibrium and utilitarian optimum. If the vaccination cost is intermediate, chickenpox vaccination programmes should be implemented with an all-or-none approach.
The predicted vaccination at the Nash equilibrium is consistent with the actual observed vaccination coverage in the USA. Our analysis reveals a small discrepancy between the Nash equilibrium and the utilitarian optimum for high vaccine efficacy. Consequently, in the USA, subsidies or external regulations are required to achieve utilitarian vaccination coverage. By contrast, the predicted vaccination coverage at the Nash equilibrium in Israel is much higher than the actual level of voluntary vaccine uptake that has been observed, suggesting that information campaigns that dissemination awareness about chickenpox and its vaccine should suffice to promote vaccination. Consistent with this recommendation, survey results indicate that the major factor for hindering chickenpox immunization in Israel is the lack of information about the vaccine (49%), whereas financial limitation only accounts for about 5 per cent [10].
We found that vaccination cost is fundamental in determining the Nash and utilitarian equilibria for chickenpox vaccination and that herd immunity in the USA and Israel can be achieved under a voluntary programme for current costs of vaccination. Our game-theory epidemic model and analysis can be applied to other countries. To obtain herd immunity of chickenpox vaccination, subsidies or external regulation should be used in countries with high costs of vaccination. By contrast, for countries with low costs of vaccination, such as Israel and the USA, improving awareness of the vaccine and the potential cost of chickenpox infection is key to promoting vaccination coverage.
Acknowledgements
This work was supported by NIH MIDAS grant U01 GM087719-01.
Appendix A. Model equations
We considered two age groups: juveniles (group 1) and adults (group 2). There are eight potential states for each age group i (i = 1 or 2): susceptible to chickenpox (Si), latent (Ei), infectious (Ii), temporary vaccine-protected (VPi), partially susceptible (VSi), breakthrough latent (VEi), breakthrough infectious (VIi) and recovered (immune to chickenpox) (Ri). Based on the flowchart shown in figure 1, the epidemiological model can be described by the following deterministic differential equations (where the meaning of parameters is given in table 2):
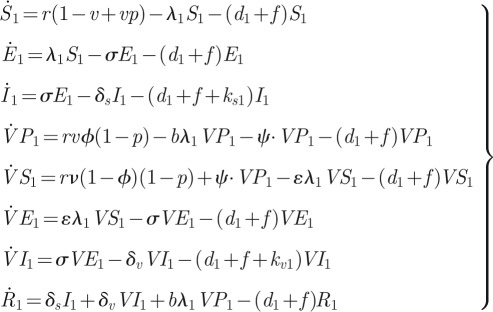 |
A 1 |
and
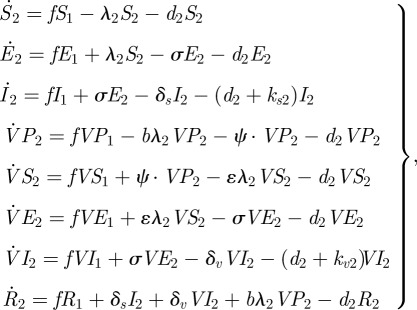 |
A 2 |
where
 |
A 3 |
Appendix B. Probability equations conditional on vaccine status
- — The probability of infection in childhood given that the individual was not vaccinated (or the vaccination failed) can be calculated by

B 1 — The probability of infection in adulthood given that the individual was not vaccinated (or the vaccination failed) is given by

B 2 - — The probability of breakthrough infection in childhood given that the individual was vaccinated successfully can be stated as

B 3 - — The probability of breakthrough infection in adulthood given that the individual was vaccinated successfully can be written as

B 4
References
- 1.Lenne X., Domingo J. D., Gil A., Ridao M., Lluch J. A., Dervaux B. 2006. Economic evaluation of varicella vaccination in Spain—results from a dynamic model. Vaccine 24, 6980–6989 10.1016/j.vaccine.2006.04.051 (doi:10.1016/j.vaccine.2006.04.051) [DOI] [PubMed] [Google Scholar]
- 2.Preblud S. R. 1986. Varicella: complications and costs. Pediatrics 78, 728–735 [PubMed] [Google Scholar]
- 3.Meyer P. A., Seward J. F., Jumaan A. O., Wharton M. 2000. Varicella mortality: trends before vaccine licensure in the United States, 1970–1994. J. Infect. Dis. 182, 383–390 10.1086/315714 (doi:10.1086/315714) [DOI] [PubMed] [Google Scholar]
- 4.Preblud S. R. 1981. Age-specific risks of varicella complications. Pediatrics 68, 14–17 [PubMed] [Google Scholar]
- 5.Wooten K. G., Darling N., Singleton J. A., Shefer A. & Cdc 2007. National, state, and local area vaccination coverage among children aged 19–35 months—United States, 2006. JAMA 298, 2475–2476 (Reprinted from MMWR, 56, 880–885, 2007.) (doi:10.1001/jama.298.21.2475) [Google Scholar]
- 6.Zhou F., Harpaz R., Jumaan A. O., Winston C. A., Shefer A. 2005. Impact of varicella vaccination on health care utilization. JAMA 294, 797–802 10.1001/jama.294.7.797 (doi:10.1001/jama.294.7.797) [DOI] [PubMed] [Google Scholar]
- 7.Pinot de Moira A., Nardone A. 2005. Varicella zoster virus vaccination policies and surveillance strategies in Europe. Euro. Surveill. 10, 43–45 [PubMed] [Google Scholar]
- 8.Rentier B., Gershon A. A. 2004. Consensus: varicella vaccination of healthy children—a challenge for Europe. Pediatr. Infect. Dis. J. 23, 379–389 10.1097/01.inf.0000122606.88429.8f (doi:10.1097/01.inf.0000122606.88429.8f) [DOI] [PubMed] [Google Scholar]
- 9.Grotto I., Balicer R. D., Smetana Z., Davidovitch N., Bar-Zeev Y., Mendelson E., Zarka S., Huerta M. 2008. Immunity to varicella zoster virus among young adults: a decline prior to widespread uptake of varicella vaccines. Infection 36, 130–134 10.1007/s15010-007-7192-7 (doi:10.1007/s15010-007-7192-7) [DOI] [PubMed] [Google Scholar]
- 10.Adler A., Herring E., Babilsky H., Gazala E., Cohen A., Levy I. 2007. Parent-dependent barriers to varicella immunization in Israel: the importance of adequate information. Acta Paediatr. 96, 428–431 10.1111/j.1651-2227.2007.00118.x (doi:10.1111/j.1651-2227.2007.00118.x) [DOI] [PubMed] [Google Scholar]
- 11.Miron D., Lavi I., Kitov R., Hendler A. 2005. Vaccine effectiveness and severity of varicella among previously vaccinated children during outbreaks in day-care centers with low vaccination coverage. Pediatr. Infect. Dis. J. 24, 233–236 10.1097/01.inf.0000154323.20387.82 (doi:10.1097/01.inf.0000154323.20387.82) [DOI] [PubMed] [Google Scholar]
- 12.Barrett S. 2003. Global disease eradication. J. Eur. Econ. Assoc. 1, 591–600 10.1162/154247603322391224 (doi:10.1162/154247603322391224) [DOI] [Google Scholar]
- 13.Bauch C. T., Galvani A. P., Earn D. J. D. 2003. Group interest versus self-interest in smallpox vaccination policy. Proc. Natl Acad. Sci. USA 100, 10 564–10 567 10.1073/pnas.1731324100 (doi:10.1073/pnas.1731324100) [DOI] [PMC free article] [PubMed] [Google Scholar]
- 14.Brisson M., Edmunds W. J., Gay N. J., Law B., De Serres G. 2000. Analysis of varicella vaccine breakthrough rates: implications for the effectiveness of immunisation programmes. Vaccine 18, 2775–2778 10.1016/S0264-410X(00)00100-6 (doi:10.1016/S0264-410X(00)00100-6) [DOI] [PubMed] [Google Scholar]
- 15.Brisson M., Edmunds W. J., Gay N. J., Law B., De Serres G. 2000. Modelling the impact of immunization on the epidemiology of varicella zoster virus. Epidemiol. Infect. 125, 651–669 10.1017/S0950268800004714 (doi:10.1017/S0950268800004714) [DOI] [PMC free article] [PubMed] [Google Scholar]
- 16.Halloran M. E., Cochi S. L., Lieu T. A., Wharton M., Fehrs L. 1994. Theoretical epidemiologic and morbidity effects of routine varicella immunization of preschool-children in the United-States. Am. J. Epidemiol. 140, 81–104 [DOI] [PubMed] [Google Scholar]
- 17.Schuette M. C., Hethcote H. W. 1999. Modeling the effects of varicella vaccination programs on the incidence of chickenpox and shingles. Bull. Math. Biol. 61, 1031–1064 10.1006/bulm.1999.0126 (doi:10.1006/bulm.1999.0126) [DOI] [PubMed] [Google Scholar]
- 18.Huse D. M., Meissner H. C., Lacey M. J., Oster G. 1994. Childhood vaccination against chickenpox—an analysis of benefits and costs. J. Pediatr. 124, 869–874 10.1016/S0022-3476(05)83173-7 (doi:10.1016/S0022-3476(05)83173-7) [DOI] [PubMed] [Google Scholar]
- 19.Lieu T. A., Cochi S. L., Black S. B., Halloran M. E., Shinefield H. R., Holmes S. J., Wharton M., Washington A. E. 1994. Cost-effectiveness of a routine varicella vaccination program for US children. JAMA 271, 375–381 10.1001/jama.271.5.375 (doi:10.1001/jama.271.5.375) [DOI] [PubMed] [Google Scholar]
- 20.Scuffham P. A., Lowin A. V., Burgess M. A. 1999. The cost-effectiveness of varicella vaccine programs for Australia. Vaccine 18, 407–415 10.1016/S0264-410X(99)00261-3 (doi:10.1016/S0264-410X(99)00261-3) [DOI] [PubMed] [Google Scholar]
- 21.Galvani A. P., Reluga T. C., Chapman G. B. 2007. Long-standing influenza vaccination policy is in accord with individual self-interest but not with the utilitarian optimum. Proc. Natl Acad. Sci. USA 104, 5692–5697 10.1073/pnas.0606774104 (doi:10.1073/pnas.0606774104) [DOI] [PMC free article] [PubMed] [Google Scholar]
- 22.Reluga T. C., Bauch C. T., Galvani A. P. 2006. Evolving public perceptions and stability in vaccine uptake. Math. Biosci. 204, 185–198 10.1016/j.mbs.2006.08.015 (doi:10.1016/j.mbs.2006.08.015) [DOI] [PubMed] [Google Scholar]
- 23.Brisson M., Edmunds W. J. 2002. The cost-effectiveness of varicella vaccination in Canada. Vaccine 20, 1113–1125 10.1016/S0264-410X(01)00437-6 (doi:10.1016/S0264-410X(01)00437-6) [DOI] [PubMed] [Google Scholar]
- 24.Ginsberg G. M., Somekh E. 2004. Cost containment analysis of childhood vaccination against varicella in Israel. J. Infect. 48, 119–133 10.1016/S0163-4453(03)00079-3 (doi:10.1016/S0163-4453(03)00079-3) [DOI] [PubMed] [Google Scholar]
- 25.Galil K., Brown C., Lin F., Seward J. 2002. Hospitalizations for varicella in the United States, 1988 to 1999. Pediatr. Infect. Dis. J. 21, 931–934 10.1097/00006454-200210000-00009 (doi:10.1097/00006454-200210000-00009) [DOI] [PubMed] [Google Scholar]
- 26.Chaves S. S., Gargiullo P., Zhang J. X., Civen R., Guris D., Mascola L., Seward J. F. 2007. Loss of vaccine-induced immunity to varicella over time. N. Engl. J. Med. 356, 1121–1129 10.1056/NEJMoa064040 (doi:10.1056/NEJMoa064040) [DOI] [PubMed] [Google Scholar]
- 27.Seward J. F., Zhang J. X., Maupin T. J., Mascola L., Jumaan A. O. 2004. Contagiousness of varicella in vaccinated cases: a household contact study. JAMA 292, 704–708 10.1001/jama.292.6.704 (doi:10.1001/jama.292.6.704) [DOI] [PubMed] [Google Scholar]
- 28.Schmid D. S., Jumaan A. O. 2010. Impact of varicella vaccine on varicella-zoster virus dynamics. Clin. Microbiol. Rev. 23, 202–217 10.1128/CMR.00031-09 (doi:10.1128/CMR.00031-09) [DOI] [PMC free article] [PubMed] [Google Scholar]
- 29.Anderson R. M., May R. M. 1982. Directly transmitted infections diseases: control by vaccination. Science 215, 1053–1060 10.1126/science.7063839 (doi:10.1126/science.7063839) [DOI] [PubMed] [Google Scholar]
- 30.Anderson R. M., May R. M. 1991. Infectious diseases of humans: dynamics and control. Oxford, UK: Oxford University Press [Google Scholar]
- 31.Halloran M. E. 1996. Epidemiologic effects of varicella vaccination. Infect. Dis. Clin. N. Am. 10, 631–655 10.1016/S0891-5520(05)70318-4 (doi:10.1016/S0891-5520(05)70318-4) [DOI] [PubMed] [Google Scholar]
- 32.Guess H. A., Broughton D. D., Melton L. J., Kurland L. T. 1986. Population-based studies of varicella complications. Pediatrics 78, 723–727 [PubMed] [Google Scholar]
- 33.Center for Disease Control and Prevention 2007. Vaccine price list. See http://www.cdc.gov/vaccines/programs/vfc/cdc-vac-price-list.htm [Google Scholar]
- 34.Bauch C. T., Earn D. J. D. 2004. Vaccination and the theory of games. Proc. Natl Acad. Sci. USA 101, 13 391–13 394 10.1073/pnas.0403823101 (doi:10.1073/pnas.0403823101) [DOI] [PMC free article] [PubMed] [Google Scholar]


