Abstract
Gonadotropin-releasing hormone (GnRH) mediates control of reproduction. It is secreted in pulses and acts via intracellular effectors to activate gonadotrophin secretion and gene expression. Sub-maximal GnRH pulse frequency can elicit maximal responses, yielding bell-shaped frequency–response curves characteristic of genuine frequency decoders. GnRH frequency decoding is therapeutically important (pulsatile GnRH can drive ovulation in assisted reproduction whereas sustained activation can treat breast and prostate cancers), but the mechanisms are unknown. Here, we consider the possibility that it is due to convergence of distinct pulsatile signals at the transcriptome. We develop a model that mirrors wet-laboratory data for activation and nuclear translocation of GnRH effectors (extracellular signal regulated kinase and nuclear factors of activated T-cells) and incorporates transcription. The model predicts genuine frequency decoding when two transcription factors (TFs) converge at a cooperative gate, and shows how optimal pulse frequency could reflect TF activation kinetics and affinities. Importantly, this behaviour is revealed as an emergent feature of the network, rather than an intrinsic feature of a given protein or pathway, and since such network topology is extremely common, may well be widespread in biological systems.
Keywords: ERK, NFAT, GnRH, frequency decoding, mathematical model
1. Introduction
Pulsatile signals are used extensively in biological systems for cell–cell and intracellular communication. This enables information to be encoded in pulse frequency, amplitude and shape and there is considerable interest in the cellular decoding mechanisms. We have explored this issue in the reproductive endocrine system where the peptide hormone gonadotropin-releasing hormone (GnRH) is secreted in pulses from neurons in the hypothalamus. It then acts at the pituitary where it binds to receptors on gonadotrope cells. Activation of these GnRH receptors (GnRHR) increases secretion of follicle-stimulating hormone (FSH) and luteinizing hormone (LH) from the gonadotropes. These gonadotropin hormones have a shared α-gonadotropin subunit (αGSU) as well as distinct LHβ and FSHβ subunits and GnRH stimulates transcription of all three subunits [1–4]. GnRH pulse frequency varies under different physiological conditions including the menstrual cycle, where frequency increases in the early follicular phase, causing a surge in gonadotrophin secretion that drives ovulation [5]. GnRH pulse frequency varies throughout reproductive life [5–7]. Children have relatively low pulse frequency but it increases during puberty. In adult men, GnRH pulse frequency is relatively constant (approx. 1 pulse per 2 h) whereas in women it varies through the menstrual cycle, with increased GnRH pulse frequency and amplitude driving the pre-ovulatory gonadotrophin surge [7]. GnRH pulse frequency can vary markedly between species with pulses every 1–6 h in women and with pulse intervals as low as 8 min in mice [6]. It can also vary under pathological conditions such as polycystic ovarian syndrome (PCOS) where LH pulse frequency (and by implication GnRH pulse frequency) is consistently elevated at approximately 1 h−1 [8]. Effects of GnRH on secretion and transcription are dependent upon pulse frequency and the essential role for pulsatile GnRH in normal physiology is illustrated by conditions in which its perturbation causes infertility [4]. Moreover, it has long been known that pulsatile stimulation of GnRHR is more effective than sustained stimulation at driving gonadotropin secretion in vivo [9]. Consequently, sustained stimulation can cause chemical contraception and this is exploited therapeutically in the treatment of hormone-dependent cancers [10].
As noted above, GnRH provides a frequency encoded signal to pituitary gonadotropes that is crucial for the physiology and therapeutic manipulation of the reproductive system, yet GnRH frequency decoding mechanisms are poorly understood. In many systems, increasing pulse frequency simply increases output until a maximal response is maintained with continuous stimulation. Alternatively, pulsatile stimuli may elicit maximal responses at sub-maximal frequency, generating bell-shaped frequency–response relationships. Such behaviour has been termed genuine frequency decoding (as distinct from simple frequency-dependence). It is thought to require negative feedback loops [11] and is exemplified by the bell-shaped frequency–response relationships seen for effects of GnRH on transcription reporters containing LHβ or FSHβ promoters. However, the nature of the feedback loops is unclear and three distinct possibilities are evident in the literature. The first is that negative feedback on upstream components of GnRHR signalling pathways reduces information transfer from the cytoplasm to the nucleus at high pulse frequency. Rapid homologous receptor desensitization can be excluded as a potential mechanism because type I mammalian GnRHR do not show this behaviour [12]. GnRH does, however, cause downregulation of cell surface GnRHR [13] and a recent mathematical model of GnRH signalling predicts pulse frequency-dependent desensitization of upstream signals as a consequence of GnRHR downregulation [14]. The second possibility is that frequency decoding reflects the interplay of transcription factors (TFs) as exemplified by work on regulation of LHβ expression by early growth response factor-1 (Egr-1) and the co-regulator NGFI-A binding protein (Nab-2) [15]. The third possibility is that transcription-dependent negative feedback on upstream pathways occurs at high GnRH pulse frequency. This could include GnRHR-mediated induction of regulator of G-protein signalling (RGS-2) which has the potential to inhibit all responses distal to Gq/11, or induction of mitogen-activated protein kinase (MAPK) phosphatases (MKPs) with the potential to modulate GnRHR-mediated extracellular signal regulated kinase (ERK) signalling [16]. Recently, we sought to identify sites of negative feedback using fluorescent fusion proteins as live-cell readouts for signalling during pulsatile GnRH stimulation. We focused on nuclear factors of activated T-cells (NFAT) and ERK because both decode pulse frequency in other models [17–22]. Using ERK2 fused to green fluorescent protein (GFP) and NFAT1c fused to emerald fluorescent protein (EFP), we found no evidence for frequency decoding [23,24]. GnRH pulses caused pulsatile translocation of ERK2-GFP and NFAT-EFP to the nucleus but neither showed the bell-shaped frequency–response relationship characteristic of genuine frequency decoders.
Most of the data outlined above were obtained in a HeLa cell line engineered to express GnRHR. Interestingly, frequency–response relationships for GnRH effects on LHβ and FSHβ transcription were bell-shaped (with luciferase reporters containing LHβ or FSHβ promoters) in this model demonstrating (i) that genuine GnRH frequency decoding is not restricted to gonadotrope cells and (ii) that such behaviour can occur in the absence of the negative feedback loops implicated in GnRH frequency decoding. Here, we present a mathematical model for GnRHR signalling based on ordinary differential equations describing GnRHR occupancy, activation and downstream signalling. This differs from earlier models [11,14,16,25–27] in that it extends signalling to ERK and NFAT, includes cellular compartmentalization (i.e. nuclear versus cytoplasm) and importantly, lacks upstream negative feedback. This model accurately predicts wet-laboratory data for activation and nuclear translocation of ERK and NFAT [23,24] enabling these to be used as inputs to the transcriptome. In many systems ERK and NFAT converge to regulate transcription and this may well be relevant for GnRH signalling as the LHβ, FSHβ and αGSU genes all contain sites for regulation by both NFATs and ERK-dependent TFs. We have therefore modelled effects of pulsatile GnRH on a target gene focusing on convergence of the NFAT and ERK signals. The model predicts that genuine frequency decoding will not occur with a system in which the two TFs need to be present to initiate transcription (AND GATE), or where either TF alone can initiate transcription (OR GATE). By contrast, the model predicts genuine frequency decoding behaviour when transcription is driven by the two TFs interacting with one another (CO-OPERATIVE GATE). Furthermore, we perform parameter sensitivity analysis as well as numerical continuation to identify the mechanisms and key regulators of these differential responses. Our main finding is that the NFAT and ERK pathways are not stand-alone frequency decoders in this model but may mediate genuine frequency decoding when converging in a cooperative manner at the transcriptome. The implication is that this complex frequency decoding is an emergent feature of the signalling network rather than an inherent feature of individual modules and that genuine GnRH pulse frequency decoding could occur without the feedback loops assumed to underlie it.
2. Results
2.1. Mathematical modelling of ERK and Ca2+/NFAT signalling pathways
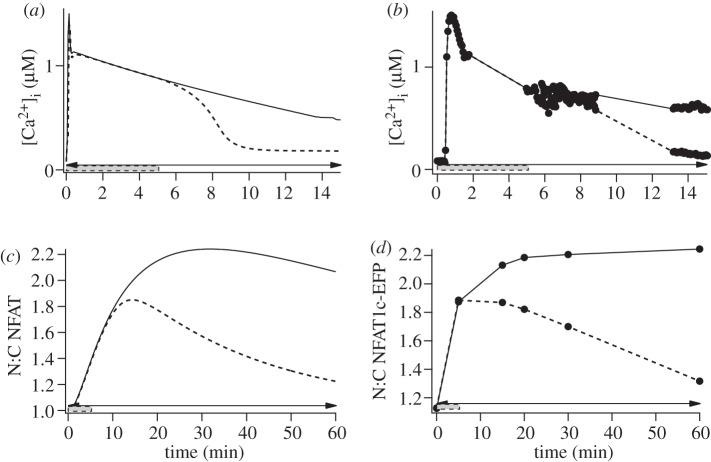
We have recently used live cell imaging readouts to monitor GnRH signalling and found no evidence for negative feedback upstream of ERK or NFAT with pulsatile stimulation [23,24]. Interestingly, bell-shaped frequency–response relationships were observed (for effects of pulsatile GnRH on LHβ and FSHβ reporters) suggesting the occurrence of genuine frequency decoding without negative feedback. Accordingly, we sought to develop a mathematical model that could be used to explore transcription regulation in the absence of upstream negative feedback. We developed a kinetic model that incorporates a limited degree of cellular compartmentalization (i.e. the nuclear and cytoplasmic distribution of NFAT and ERK) but lacks upstream negative feedback, and calibrated the model by comparison with published data. A complete list of the model equations as well as specific model details and parameters are given in the electronic supplementary material. We first simulated effects of brief or sustained (5 or 60 min) stimulation with 10−7 M GnRH on intracellular calcium concentration([Ca2+]i) and the nuclear to cytoplasmic (N:C) NFAT ratio and compared this to published experimental measures obtained with HeLa cells expressing an NFAT1c-EFP reporter and GnRHR. Figure 1 shows the model prediction of [Ca2+]i increasing rapidly to a peak and then declining to a plateau value during sustained stimulation, or reducing rapidly to the basal after 5 min stimulation, simulated data that accurately mirror responses seen in this [23] and other [22,25,28] experimental models. The model predicts a slower increase in NFAT N:C reaching a maximum at approximately 40 min on sustained stimulation, or returning slowly to pre-stimulation values when GnRH is removed at 5 min, and this again accurately reflects the experimental observations (figure 1).
Figure 1.
Modelling the effects of transient and sustained GnRH on cytoplasmic Ca2+ concentration and NFAT translocation. (a) Model predictions for effects of GnRH (10−7 M) on [Ca2+]i in cells stimulated either continuously (horizontal arrow) or for 5 min (grey rectangle) from t = 0 (solid line, GnRH pulse; dashed line, GnRH constant). (b) Experimental data obtained under these conditions using HeLa cells transduced with GnRHR and loaded with fura 2 for Ca2+ measurement. (c) Model predictions for translocation of NFAT from the cytoplasm to the nucleus (N:C NFAT ratio) in cells stimulated for 5 min or continuously with 10−7 M GnRH and (d) experimental data under these conditions using HeLa cells transduced to express GnRHR and NFAT1c-EFP. See [23] for detailed methods.
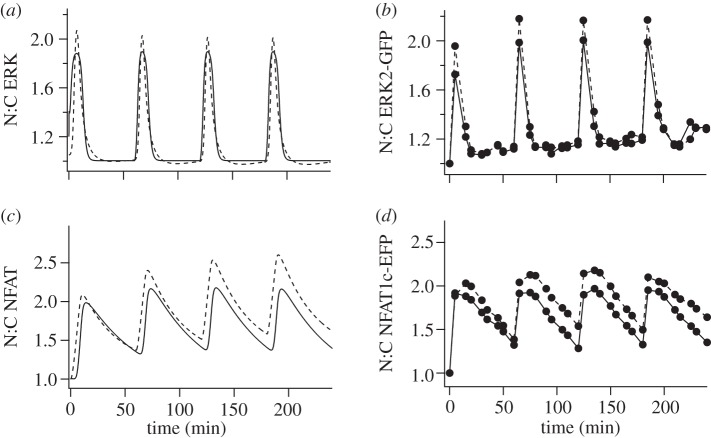
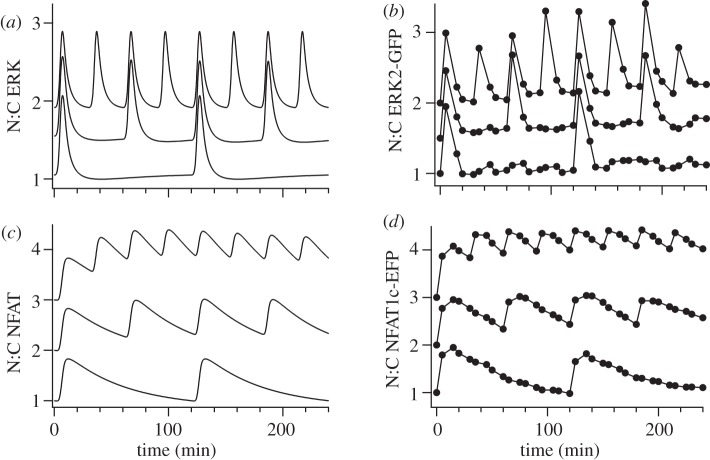
We extended the calibration by simulating ERK and NFAT N:C in cells stimulated with 5 min pulses of 10−9 M or 10−7 M GnRH at 60 min intervals and again obtained excellent fits between the simulated data and corresponding experimental data (figure 2). The equations and parameters for these simulations are detailed in the electronic supplementary material. Most of the model parameters were derived from published estimates in other model systems but some (for example, the parameters for movement of ERK and NFAT to and from the nucleus and for dephosphorylation of ERK within the nucleus) were selected for optimal fit during this calibration process. Comparison of the two responses reveals that ERK translocates rapidly to and from the nucleus and the N:C ERK measure returns to basal values between stimuli (figure 2) showing a behaviour termed ‘digital tracking’ [29]. By contrast, the N:C NFAT response is slower in onset and offset and this can mean that the response has not returned to the pre-stimulation value before a subsequent stimulus is added. This can lead to ‘saw-tooth’ or cumulative response in a behaviour termed ‘integrative tracking’ that is thought to increase signal efficiency with pulsatile stimuli [29]. An important feature of the model is that it accurately mirrors wet-laboratory data for these distinct characteristics of the ERK and NFAT translocation responses. Having calibrated the model to experimental data, we sought to validate it by simulating ERK and NFAT N:C responses in cells stimulated with 5 min pulses of 10−7 M GnRH at 30, 60 or 120 min intervals and by comparison with data obtained in GnRHR expressing HeLa cells under these conditions. Again, an excellent fit to the experimental data was obtained (figure 3) and notably, the 30 min pulse interval revealed integrative tracking that was pronounced for NFAT and absent for ERK in both simulated and experimental data.
Figure 2.
Modelling the effects of GnRH pulses on nuclear translocation of ERK and NFAT. (a,c) Data from simulations in which cells are stimulated with 5 min pulses of 10−9 M (solid line) or 10−7 M (dashed line) GnRH at 1 h intervals. The predicted effects on N:C ERK or N:C NFAT are shown as fold change over the normalized values at t = 0. (b,d) Corresponding experimental data obtained by live cell imaging in HeLa cells transduced to express GnRHR and either NFAT1c-EFP or ERK2-GFP. See [23,24] for detailed methods.
Figure 3.
Modelling the frequency dependence of ERK and NFAT nuclear translocation during pulsatile GnRH stimulation. Five minute pulses of 10−7 M GnRH were at intervals of 30 min, 60 min or 120 min. Model simulated (a,c) and experimental (b,d) responses (N:C ratios) were normalized as the fold change over control (at 0 min). Responses obtained at increasing pulse frequency were offset on the vertical axis (0.5 and 1 for ERK, 1 and 2 for NFAT) for clarity.
2.2. Extending the mathematical model to NFAT and ERK-dependent transcription
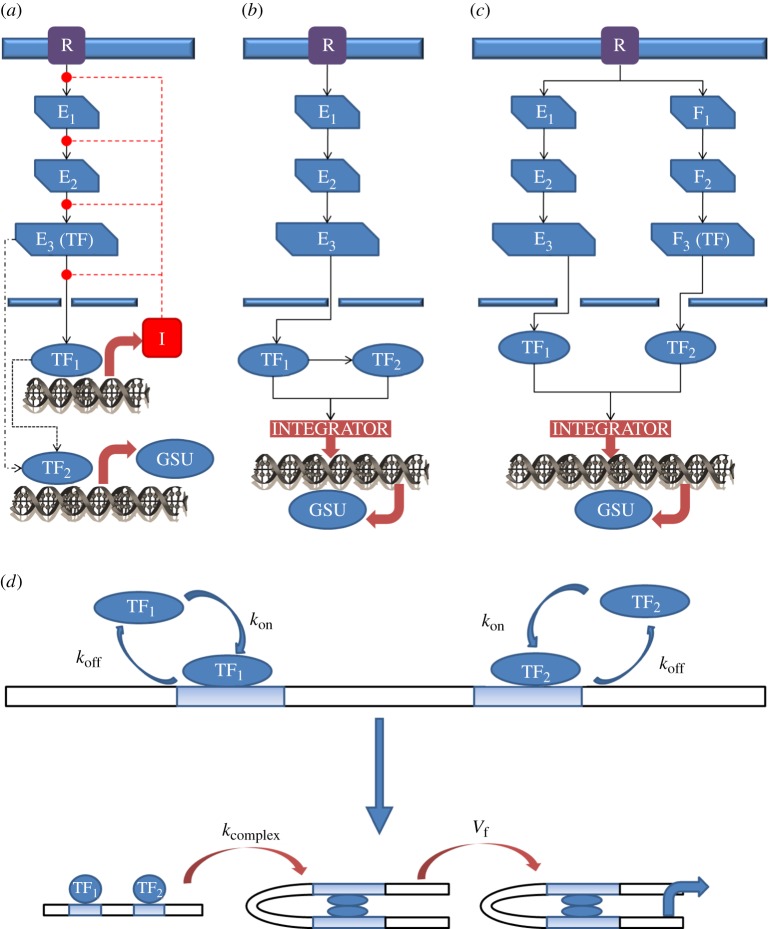
Having calibrated and validated our model against a wide range of experimental data, we could mathematically derive realistic input signals to the transcriptome (figures 1–3) in order to test whether the convergent interaction of TFs could generate the bell-shaped frequency–response relationships observed for some transcriptional effects of GnRH. We incorporated the action of NFAT- and a generic ERK-activated TF (e.g. Egr-1) as inputs for transcription activation and assumed convergent action on a shared promoter. This scenario is biologically relevant as the NFAT and ERK pathways converge to regulate transcription in other systems [21] and because the αGSU, LHβ and FSHβ promoters are all potential sites for convergent NFAT and ERK signalling. It is important to recognize, however, that we are considering a generic mechanism for regulation of a generic GSU that, for the purposes of this model, receives input only from NFAT and an ERK activated TF. We exclude negative feedback (figure 4a) from the model and instead consider the possibility that both TF1 and TF2 are activated sequentially downstream of ERK (figure 4b) or that TF1 is activated by ERK and that TF2 is NFAT (figure 4c). We also consider three possible logic gates (OR GATE, AND GATE and CO-OPERATIVE GATE (figure 4d)) for the nature of the TF interaction.
Figure 4.
Schematic of the GnRH signalling cascade. R denotes GnRHR, Ei and Fi, i = 1, 2, 3, stand for effector proteins, I represents an inhibitor, and TF1 and TF2 are the transcription factors we model. (a) An example of a GSU regulatory network comprising multiple signalling pathways including feed-forward and/or negative feedback loops. (b) Schematic of the sequential activation network topology. (c) Schematic of parallel activation network topology. (d) In the CO-OPERATIVE GATE scenario, the transcription factors bind at independent promoter sites. After initial binding of the transcription factors to DNA the transcription factors interact to bring promoter sites in close proximity. (Online version in colour.)
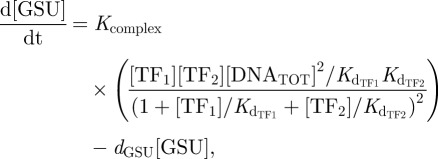
The first logic gate we consider is the case of cooperativity (figure 4d). This interaction is modelled as
 |
2.1 |
where Kcomplex is the rate of formation of the transcript complex that incorporates the rate of RNA polymerase, dGSU is a decay rate, and Kd indicates the dissociation constant of the molecule in subscript. Square brackets indicate the µM concentration of the bracketed substances, except for GSU-mRNA (table 1 in the electronic supplementary material).
If both TFs need to be present to activate transcription then in logic arguments this is an AND GATE scenario. This scenario excludes the possibility of only a single TF to initiate transcription, as the absence of one will lead to the entire input term being zero. This gives rise to the following ordinary differential equation:
 |
2.2 |
where γ is the rate of transcription by RNA polymerase.
When either of the two TFs is sufficient then the input function under consideration is a summation of the binding of the two TFs at independent locations on the DNA target region. Note that the binding of one is non-exclusive of the binding of the remaining factor. Hence, as could be seen in equation (2.3), we do not subtract the product of the two input functions as probability theory requires for non-exclusive binding. Subtraction of this term would lead to the consideration of an exclusive OR GATE (XOR GATE) where both TFs cannot be present on the promoter at the same time. Thus, the OR GATE scenario is given by the following the equation:
 |
2.3 |
Detailed derivations of equations (2.1)–(2.3) as well as corresponding parameter values are given in the electronic supplementary material.
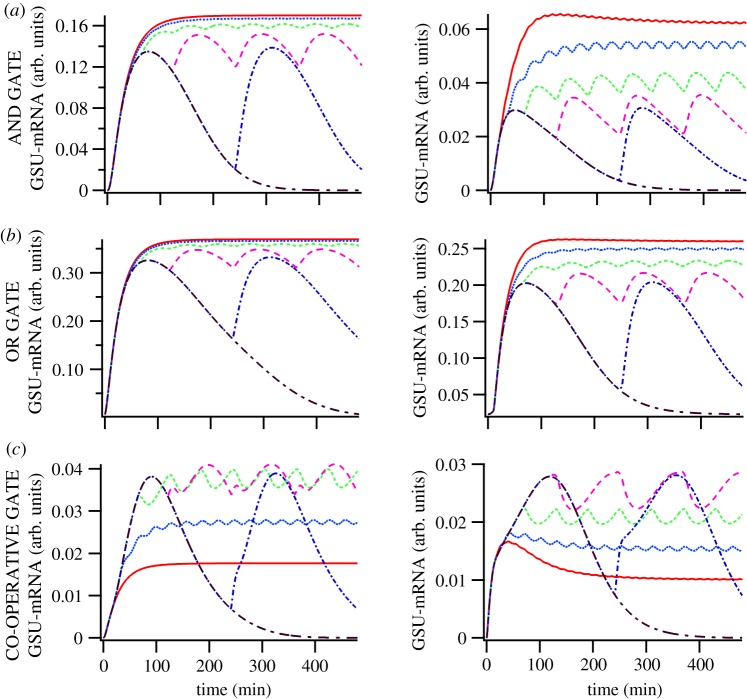
For each scenario we performed model simulations with 10−7 M GnRH pulse frequencies of 0.125, 0.25, 0.5, 1, 2 and 4 pulses per hour for 8 h of simulation in accordance with our experimental work on transcription regulation in a GnRHR-expressing HeLa cell model [23,24]. We plotted the predicted GSU-mRNA transcriptional responses over time for each combination of pulse frequency, logic gate and pathway architecture and, in agreement with recent theoretical results [30], our model exhibited entrainment to the GnRH pulse frequency in all the cases considered (figure 5). It is also important to note that these simulated transcriptional responses occur with a characteristic delay of 20–30 min as has been experimentally observed during ultradian hormone stimulation that induces cyclic receptor-mediated transcriptional regulation, or gene pulsing, both in cultured cells and in animal models [31]. This delay reflects the fact that stimulation requires accumulation of intermediate signalling components that in turn activate downstream pathways eventually leading to 20–30 min delay in GSU-mRNA response.
Figure 5.
Modelling the time-course of GSU-mRNA expression at varied GnRH pulse frequency. Typical GSU-mRNA time-series solutions in the model for [GnRH] = 10−7 M pulses of duration 5 min with frequencies of 0.125 (black dash-dotted line), 0.25 (blue dash-dotted line), 0.5 (pink dashed line), 1 (green dashed line), 2 (blue dotted line) and 4 (red solid line) pulses per hour, where KdTF1 = 0.02 M and KdTF2 = 0.2 M. (a) AND GATE scenario; (b) OR GATE scenario; (c) CO-OPERATIVE GATE scenario; left panels show the response of the sequential activation model (figure 4b); right panels show the response of the parallel activation model (figure 4c). (Online version in colour.)
With the AND GATE scenario (figure 5a), increasing pulse frequency increased the GSU transcriptional response. This was seen for both pathway topologies (TF1 and TF2 activated sequentially (left panel) or in parallel (right panel)) with maximal responses obtained at lower pulse frequencies in the sequential TF activation model. Qualitatively similar data were obtained with the OR GATE scenario (figure 5b); again increasing pulse frequency increases the transcriptional response with near maximal responses obtained at lower frequencies with sequential activation of TF1 and TF2 (as compared to their parallel activation). Importantly, maximum responses were obtained at maximal pulse frequency with both of these gates. By contrast, with the CO-OPERATIVE GATE scenario (figure 5c) increasing GnRH pulse frequency increases the magnitude of the GSU transcription output until a maximal response was obtained at a sub-maximal frequency for both pathway topologies. Further increasing pulse frequency reduced the transcriptional response which was optimally stimulated by GnRH at 0.5 or 1 pulse per hour (for both models). The output of the AND GATE and OR GATE model scenarios is reminiscent of the integrative tracking nature of the NFAT nuclear-translocation response at high pulse frequency. This is in sharp contrast to the CO-OPERATIVE GATE scenario model output that is characterized by decrease in GSU-mRNA with increase in frequency (bell-shaped frequency–response relationship).
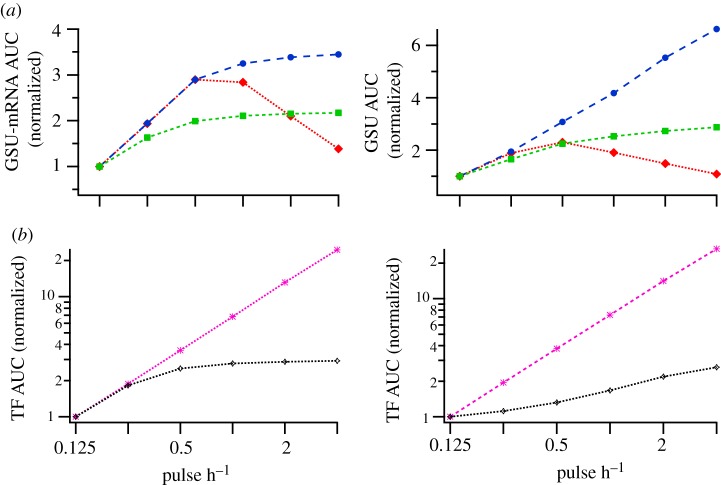
To better quantify the transcriptional responses we integrate the model's time-series output, taking the area under the curve (AUC) for the 8 h GSU-mRNA profile (data from figure 5) as a measure of the transcriptional response predicted with each scenario and pulse frequency (figure 6a). Here, the key observation is that bell-shaped frequency–response relationships are predicted to occur with the CO-OPERATIVE GATE and either of the pathway topologies but not with the AND GATE or the OR GATE (with either topology). This figure also enables direct comparison with published frequency–response relationships obtained using luciferase reporters to monitor transcriptional responses in GnRHR expressing HeLa cells [23,24]. In this model, GnRH bell-shaped frequency–response curves were obtained for GnRH effects on LHβ-luciferase and FSHβ-luciferase reporters (consistent with the cooperative simulations) whereas GnRH effects on αGSU-luciferase activity increased as pulse frequency increased (consistent with an AND GATE or an OR GATE scenario).
Figure 6.
Modelling the cumulative effects of GnRH on GSU-mRNA expression at varied pulse frequency. (a) GSU-mRNA area under the curve (AUC) for the time series shown in figure 5 (filled red diamond, CO-OP; filled blue circle, AND; filled green square, OR); (b) TF1 and TF2 AUC (pink cross marks, TF1; open diamond, TF2); left panels show the response of the sequential activation model (figure 4b); right panels show the response of the parallel activation model (figure 4c). [GnRH] = 10−7 M, KdTF1 = 0.02 M and KdTF2 = 0.2 M. (Online version in colour.)
In order to verify that differential regulation does not occur at the level of TF activation, we computed the AUC of the two TF (TF1 and TF2) time-series outputs given by both model variants. As shown (figure 6b), the AUC for both TFs is predicted to increase with increasing frequency, and this is in agreement with the experimental measurements of GnRH effects on an NFAT-responsive luciferase reporter and an Egr-1-luciferase reporter in this model [23,24]. Thus, in our mathematical model genuine frequency decoding occurs due to an interaction between the two TFs prior to transcription initiation, and only when the two TFs converge at a CO-OPERATIVE GATE. Moreover, we demonstrate that this result holds for both network topologies.
2.3. Parameter sensitivity analysis based on the AUC measure
Gene transcription is controlled in many ways. Alterations to the amount of each TF, the rate of transcript processing, the stability of the TFs and transcripts all have the potential to affect the overall transcription rate. To explore how such factors might affect transcription we performed a parameter sensitivity analysis on our mathematical model, systematically varying TF dissociation constants and half-lives. We restricted this to the CO-OPERATIVE GATE, as the only scenario generating genuine frequency decoding behaviour using the GSU-mRNA AUC measure of transcriptional activity as the model output. In the simulations shown in figure 7 we focus on stimulation for 8 h with 5 min pulses of 10−7 M GnRH at varied frequency 0.125, 0.25, 0.5, 1, 2 and 4 pulses per hour and also determined the pulse frequency at which the maximal transcriptional response occurred (optimal pulse frequency). All model parameters were fixed at the reference values given in the electronic supplementary material with the exception of the dissociation constants, Kd for TF1 and Kd for TF2 as well as the half-life of TF1. System output was computed for 400 pairs of dissociation constants, each varying over 100 fold and uniformly spaced over a range of 2–200 nM. The TF1 half-life was varied in the range of 10–50 min, in accordance with published estimates for Egr-1 stability [32].
Figure 7.
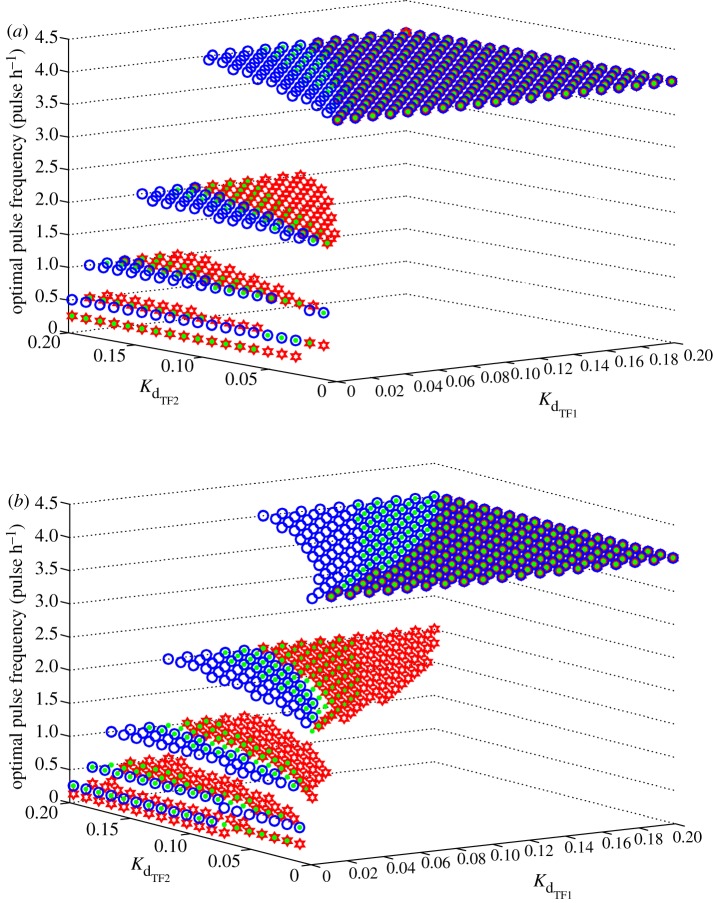
Parameter sensitivity analysis. Parameter sensitivity plots illustrating the dependence of the characteristic frequency (pulse per h) that produces maximum AUC on the dissociation constants KdTF1 and KdTF2 as well as the TF1 degradation rate (half life) in the case of CO-OPERATIVE GATE and [GnRH] = 10−7 M. (a) Sequential activation model—TF1 and TF2 downstream of ERK pathway (figure 4b); (b) parallel activation model—TF1 downstream of ERK pathway, TF2 downstream of NFAT pathway (figure 4c) (open red star, τ1/2 = 40 min; filled green circle, τ1/2 = 30 min; open blue circle, τ1/2 = 20 min). (Online version in colour.)
Figure 7a shows results from simulations assuming sequential activation of TF1 and TF2 downstream of ERK with Kd for TF1, Kd for TF2 and optimal pulse frequency on the x, y and z axes, respectively, for TF1 half-times of 20, 30 and 40 min. This analysis predicts that optimal pulse frequency is dependent upon the dissociation constants of the TFs and on the half-time of TF1. Notably, the occurrence of maximal output at sub-maximal pulse frequency (genuine frequency decoding) occurs with the CO-OPERATIVE GATE scenario where Kd for TF1 is relatively small compared to Kd for TF2. Above a certain value of Kd for TF1, the system exhibits only integrative tracking; irrespective of Kd for TF2 the maximal response is seen with the maximal pulse frequency (i.e. optimal pulse frequency is 4 per hour as illustrated by the upper plane of symbols in figure 7a). In addition, variations in the TF1 half-life influenced not only the range of dissociation constants where the system exhibits genuine frequency decoding, but also the pulse frequency at which maximal predicted GSU response occurs. Specifically, the analysis predicts that increasing TF1 half-life shifts the frequency–response relationship leftward (yielding lower values for optimal pulse frequency). Conversely reducing TF1 half-life has the opposite effect increasing the range of parameters where the system does not discriminate input frequencies (see also the electronic supplementary material, figure S4). Similar data were obtained with parameter analysis of the parallel TF activation model (where TF1 is activated by ERK and TF2 is NFAT). As shown (figure 7b), the optimal pulse frequency is again dependent upon Kd for TF1 and Kd for TF2 values with genuine frequency decoding occurring at relatively low Kd for TF1 values, and with increased TF1 half-life values reducing the optimal pulse frequency for transcription activation. The most notable difference between the two pathway topologies is that, when compared to the parallel TFs activation model (figure 7b), the sequential TFs activation model (figure 7a) predicts genuine frequency decoding with a much smaller range of Kd for TF1 and Kd for TF2 values (i.e. there are far fewer symbols on the 0.25–2 pulses per hour planes in figure 7b than there are in figure 7a).
2.4. Parameter sensitivity analysis based on continuation of periodic GSU responses
The results described above were obtained with a time-consuming brute-force computational approach. An alternative approach for determining parameter sensitivity is to compute a model solution (i.e. the GSU output) as a function of this parameter. This ‘continuation of solutions’ approach is an important tool for understanding model dynamics as it could reveal qualitative changes in solution structures (such as bifurcations). Our model of GSU transcriptional regulation exhibits entrainment to GnRH periodic inputs (figure 5) and converges to a fixed limit cycle (periodic orbit) of the same period as the input signal [30]. Figure 5c also demonstrates that frequency decoding is associated with a decrease in the amplitude of this limit cycle. These properties of the model allow for parameter sensitivity analysis that is based on numerical continuation of this limit cycle (or periodic solution) in a model parameter of interest. This can be achieved using continuation software such as AUTO [33]. To do so, it is first necessary to represent the model as an autonomous dynamic system. This was achieved by substituting the square wave GnRH input used previously with a standard two-dimensional dynamical system that admits an asymptotically stable periodic orbit as a solution expressed in terms of sine and cosine functions with the same period and magnitude as the square wave pulse [34]. As maximal GnRH effects have been reported at 0.5–2 pulses per hour in various systems we performed numerical continuation analyses for the parameters of interest (Kd for TF1 and Kd for TF2 as well as the half-lives of TFs and GSU) continuing model solutions of period 30, 60 and 120 min.
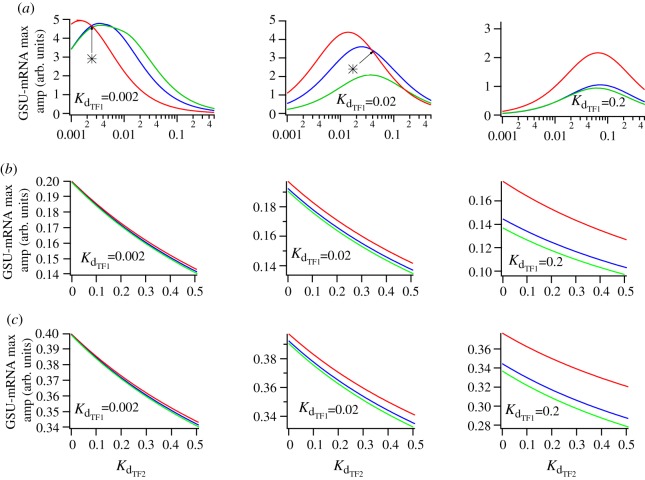
We initially used the CO-OPERATIVE GATE scenario assuming sequential activation of TF1 and TF2 downstream of ERK, continuing 30, 60, and 120 min period solutions in Kd for TF2 for different values of Kd for TF1 (2, 20 and 200 nM) with TF1 half-life fixed at 40 min. Figure 8a shows the maximum amplitude of these periodic solutions as a function of Kd for TF2. Consistent with the simulation data above, this analysis predicts frequency decoding when Kd for TF1 is relatively small compared to Kd for TF2. In this case, genuine frequency decoding (with maximal output at sub-maximal pulse frequency) occurs at Kd for TF2 values where the values in the red curves (2 pulses per hour) exceed those in the corresponding blue or green curves (1 and 0.5 pulses per hour, respectively). Thus with Kd for TF1 at 0.002 µM a bell-shaped frequency–response relationship is predicted for all Kd for TF2 values ≥ 0.003 µM (intersect point indicated by an asterisk in the left panel of figure 8a). Similarly, with Kd for TF1 at 0.02 µM, genuine frequency decoding occurs for Kd for TF2 values ≥ 0.04 µM (middle panel of figure 8a), whereas with Kd for TF1 at 0.2 µM genuine frequency decoding does not occur at any Kd for TF2 value (right panel of figure 8a). Using the same continuation method and parameters for the AND GATE and OR GATE models we found no evidence for genuine frequency decoding (i.e. maximal responses were always obtained at maximal pulse frequency as shown in figure 8b,c). Furthermore, varying the half-lives of TF2 or GSU while keeping TF1 half-life fixed did not affect the behaviour of our system (see the electronic supplementary material, figures S5 and S6). Thus, our model of GnRH-induced transcriptional regulation based on experimental observations of NFAT and ERK signalling to the nucleus can only mimic the characteristic bell-shaped frequency–response relationships seen for pulsatile GnRH effects when two TFs act in a CO-OPERATIVE manner to drive transcription.
Figure 8.
Numerical continuation analysis. Numerical continuation of the maximum of period 30 min, 60 min and 120 min GSU solutions as a function of parameter KdTF2 for three different values of KdTF1 = 0.002; 0.02; 0.2, TF1 half life of 40 min, TF2 half life of 30 min, and GSU half life of 15 min in the case of (a) CO-OPERATIVE GATE; (b) AND GATE; (c) OR GATE. [GnRH] = 10−7 M. The star marks the value of the continuation parameter (Kd for TF2) at which genuine frequency decoding occurs (red solid line, 2 pulse h−1; blue solid line, 1 pulse h−1; green solid line, 0.5 pulse h−1). (Online version in colour.)
3. Discussion
Many aspects of cell–cell communication and intracellular signalling rely on frequency-coded chemical signals. The reproductive system is a classic example, in which GnRH pulse frequency varies under different physiological conditions and gonadotrope responses to GnRH are frequency-dependent. Extensive work on transcriptional regulation has revealed how GnRHR-regulated signalling pathways feed into activation of multiple TFs to regulate gonadotropin expression but the mechanisms decoding pulse frequency remain poorly understood. A characteristic feature of this (and other) frequency-dependent signalling systems is that for some, but not all, transcriptional effects of GnRH, maximal responses occur at a sub-maximal pulse frequency. This behaviour has been termed genuine frequency decoding (as opposed to simple frequency-dependence) and is thought to reflect the action of feedback regulatory loops [11,16,35,36]. In accordance with this, the agonist-induced downregulation of cell surface GnRHR provides a negative feedback loop that underlies frequency-dependent signalling responses in the mathematical model of Washington et al. [14]. This model predicts that all responses to pulsatile GnRH will desensitize in a manner that is dependent upon GnRH concentration, pulse frequency and receptor number [23]. A more recent study [16] reveals how GnRH-mediated upregulation of MKP could provide a negative feedback loop underlying frequency decoding although in this case the feedback would be specific for effectors downstream of MAPKs. However, we have recently used imaging readouts that enable activation of GnRHR effectors to be monitored in live cells during pulsatile stimulation and found no evidence for such negative feedback. Using the N:C ratio of an ERK2-GFP reporter as a readout for ERK activation, and an NFAT-EFP reporter as a readout for Ca2+/calmodulin activation we observed responses that were dependent upon GnRH concentration, GnRH pulse frequency and GnRHR number but desensitization was not seen under any of the experimental conditions. We also observed no measurable GnRHR downregulation with intermittent GnRH stimulation [23] and that MKPs had little influence on ERK activation response kinetics with pulsatile stimulation [24]. Nevertheless, the model used (HeLa cells engineered to express GnRHR and reporters) did exhibit genuine frequency decoding as maximal GnRH effects on LHβ-luciferase and FSHβ-luciferase reporters occurred at sub-maximal GnRH pulse frequency (1–2 pulses per hour). This clearly suggests that other ‘transcriptome-based’ decoding mechanisms might underlie GnRH frequency decoding in the absence of negative feedback mechanisms influencing the signals passing from the cytoplasm to the nucleus.
In light of the data outlined above, the initial aim of this study was to develop a reliable mathematical model for GnRHR signalling that lacks these putative negative feedback loops, incorporates ERK and NFAT as GnRH effectors and includes cellular compartmentalization for comparison with published data on N:C ERK2-GFP and NFAT-EFP ratios [23,24]. Here, it is important to recognize that pulsatility occurs at multiple loci and with multiple time scales in GnRH signalling. Thus, GnRH causes oscillatory increases in cytoplasmic Ca2+ concentration with inter-pulse intervals of seconds–minutes in some models [25], that gonadotrope responsiveness to GnRH varies through oestrous or menstrual cycles with intervals of days to weeks, and that reproduction is seasonal in many species with a yearly interval. Our model focuses solely on the decoding of GnRH pulse frequency on the ultradian scale (with pulse intervals of 15 min–4 h) and is developed from consideration of data from HeLa cells in which GnRH would not cause oscillatory Ca2+ responses within the 5 min stimulation periods considered (figure 1). However, the model accurately predicts the activation and nuclear translocation responses seen with ERK2-GFP and NFAT-EFP reporters under a wide range of conditions of GnRH concentration and pulse frequency (figures 1–3). This enabled us to use the dynamic nuclear ERK and NFAT measures as inputs to the transcriptome and this was modelled using a number of biologically pertinent scenarios.
Thus, we considered the situation where both TF1 and TF2 converge on a single gene promoter that we name gonadotrophin subunit (GSU), a generic term used because this is probably the case for the αGSU, LHβ and FSHβ gonadotrophin subunit genes, as it is for many other ERK and NFAT target genes [17–22]. We considered the possibility that TF1 is an ERK-activated TF and that TF2 is NFAT (parallel activation network topology) or that TF1 and TF2 are sequentially activated downstream of ERK (sequential activation network topology). We also tested three distinct logic gates for the nature of the action of TF1 and TF2 at the promoter. The first is a CO-OPERATIVE GATE that in biological terms could reflect the action of one TF to mediate the interaction between the other TF and the cell transcriptional machinery, or alternatively, the requirement of physical interaction between the two TFs to orient distant promoter sites and bring them to close proximity for transcription activation (see figure 4d). The second is the AND GATE in which both TFs are needed for transcription activation but there is no functional interaction between them, and the third is the OR GATE where either or both TFs can drive transcription but there is again no functional interaction between the two. The key prediction of our model simulations is that genuine frequency decoding can indeed occur when two TFs are activated either in series or in parallel and converge in a CO-OPERATIVE manner on a gene promoter. Genuine frequency decoding was never seen in simulations with an AND GATE or an OR GATE, but the CO-OPERATIVE GATE predicts this behaviour in the absence of the negative feedback often assumed to underlie it.
As the model has been developed using GnRHR-mediated responses, it provides a framework for understanding pulsatile GnRH signalling. It is important to recognize, however, that transcriptional regulation is an extremely complex process involving TF cascades (where immediate early genes drive expression of late response genes), and in which multiple TFs form gene-specific combinatorial codes and act in conjunction with epigenetic mechanisms (such as histone modification) at multiple stages of the cascade [37]. Here, we have focused on possible convergence of the ERK and NFAT pathways on GSU promoters for four reasons. First, these are the only pathways for which we have experimental measures of the signal passing from the cytoplasm to the nucleus; second, ERK and calmodulin effectors, including NFAT, have already been shown to decode pulse frequency in other systems [18–20,22]; third, the promoter regions of the αGSU, LHβ and FSHβ all contain response elements likely to mediate effects of ERK (i.e. Egr-1 sites) and NFAT [20]; and fourth, the Raf/MEK/ERK and Ca2+/calmodulin/calcineurin/NFAT cascades are known to act as co-dependent modules in other systems, notably in the control of cardiac myocyte proliferation where ERK and NFAT converge on composite AP-1/NFAT response elements in a number of genes controlling cell growth [19,21]. Clearly, our modelling illustrates the potential for such convergence as a frequency decoding mechanism that could well be relevant in regulation of many target genes by GnRH in gonadotropes or by other stimuli in other cells.
In exploring model parameters, we found that affinities (dissociation constants) and half-lives of TF1 and TF2 can have pronounced effects on frequency-dependence of the predicted transcriptional response. Again, this represents an over-simplification as transcription is controlled by the assembly of large protein complexes with multiple TFs and co-regulatory molecules interacting with components of the general transcription unit. Moreover, it is increasingly evident that TFs and other co-regulatory molecules cycle to and from DNA and often do so in synchrony. Thus, there is a dynamic assembly and disassembly of transcription-regulating protein complexes at many genes including the LHβ promoter in GnRH-stimulated cells [15,32]. In this context, one could view the model's Kd and half-life values for TF1 and TF2 as broad measures of the efficiency of assembly and stability of this multi-protein complex, rather than just the TF–promoter binding affinity and TF degradation rate. One intriguing implication of this is that the optimal pulse frequency for any given transcriptional response may itself be regulated by factors such as post-translational modification (i.e. phosphorylation, ubiquitination or sumoylation of TFs) with the potential to alter the efficiency of assembly and the stability of the multi-protein complex. It has been very well established experimentally that high GnRH pulse frequencies favour activation of the LHβ promoter whereas slower pulse frequencies favour activation of the FSHβ promoter both in vivo and in vitro [2,6,32,38] but the possibility that these optima themselves vary under different conditions has not been extensively explored. Thus, optimal pulse frequencies for GnRH effects differ between species [6] but to our knowledge, the possibility that they vary under different physiological conditions (i.e. through the menstrual cycle or through puberty) or in different pathological states (such as PCOS) remains untested. Extending this one might expect model parameters and optimal pulse frequencies to be dependent on cellular context, raising the question of whether a mathematical model developed using a heterologous expression system (HeLa cells) can accurately reflect behaviour of native GnRHR in gonadotropes. Here, it is important that these cells do show genuine GnRH frequency-decoding behaviour (bell-shaped frequency–response relationships for GnRH effect on LHβ and FSHβ reporters). Moreover, the effects of pulsatile GnRH on NFAT-EFP localization in HeLa cells closely parallel its effects on the gonadotrope lineage LβT2 cell line [23]. However, we have not explored ERK signal kinetics in LβT2 cells because they were derived by targeted transgenesis with SV40 T antigens which interact with a wide range of target proteins including protein phosphatase 2A [24]. Since this accounts for a large proportion of protein phosphatase activity in many cells and is markedly inhibited by the small T antigen, an obvious concern is that the immortalization strategy may influence the response kinetics. In considering the general applicability of the model predictions, it should be noted that the model parameters derived from published HeLa cell data are represented by a small subset of points on figure 7a,b. It is perfectly conceivable that other points in these figures (or on the curves shown in figure 8) more accurately reflect the situation in other cells types (such as gonadotropes or gonadotrope lineage cell lines) or from different species and under different physiological conditions.
Although a great deal is yet to be learned about the specific mechanisms of GnRH frequency decoding, the most important aspect of this study is the general observation that two convergent signalling pathways activated by pulsatile stimulation can show genuine frequency decoding behaviour without feedback loops. We illustrate this for the Ca2+/calmodulin/calcineurin/NFAT and Raf/MEK/ERK pathways that do not show frequency decoding as stand-alone modules but do so when they converge on a CO-OPERATIVE logic gate. It is therefore probable that similar behaviour will occur with two pathways in which the convergence is due to genetic and epigenetic regulation (i.e. activation of a TF and an enzyme causing histone modification to permit TF access to the promoter) or in which the pathways converge to influence activity of an effector that is not a TF (i.e. two kinases phosphorylating a target protein on different sites, or an ion channel gated by membrane potential and phosphorylation).
In summary, we show that when two convergent signalling pathways are activated by pulsatile stimulation within a signalling multi-level network topology, the network can show genuine frequency discrimination behaviour, even in the absence of the feedback loops previously thought to explain such behaviour. We illustrate this possibility by modelling transcriptional responses elicited by activation of Raf/MEK/ERK and Ca2+/calmodulin/calcineurin/NFAT pathways by pulsatile GnRH, a system in which neither pathway acts as a stand-alone frequency decoder but where genuine frequency decoding is predicted for their convergence at a logical CO-OPERATIVE GATE. The abundance of such convergence within intracellular signalling pathways leads us to speculate that genuine frequency decoding may be an almost inevitable emergent feature of cell signalling networks.
Acknowledgements
The authors are grateful to Jakub Nowacki (Department of Engineering Mathematics, University of Bristol) for providing help with the software [39] used to perform parameter sensitivity analysis. P.M. was supported by an EPSRC grant (EP/E501 214/1) supporting the Bristol Centre for Complexity Sciences. S.P.A. was supported by a BBSRC Doctoral Training Grant Award to the University of Bristol Laboratories for Integrative Neuroscience and Endocrinology. The laboratory-based work was supported by the Wellcome Trust (grants 084 588 and 078 407 to C.A.M.).
References
- 1.Burger L. L., Haisenleder D. J., Aylor K. W., Marshall J. C. 2008. Regulation of intracellular signaling cascades by GNRH pulse frequency in the rat pituitary: roles for CaMK II, ERK, and JNK activation. Biol. Reprod. 79, 947–953 10.1095/biolreprod.108.070987 (doi:10.1095/biolreprod.108.070987) [DOI] [PMC free article] [PubMed] [Google Scholar]
- 2.Burger L. L., Haisenleder D. J., Dalkin A. C., Marshall J. C. 2004. Regulation of gonadotropin subunit gene transcription. J. Mol. Endocrinol. 33, 559–584 10.1677/jme.1.01600 (doi:10.1677/jme.1.01600) [DOI] [PubMed] [Google Scholar]
- 3.Ciccone N. A., Kaiser U. B. 2009. The biology of gonadotroph regulation. Curr. Opin. Endocrinol. Diabetes Obes. 16, 321–327 10.1097/MED.0b013e32832d88fb (doi:10.1097/MED.0b013e32832d88fb) [DOI] [PMC free article] [PubMed] [Google Scholar]
- 4.Gharib S. D., Wierman M. E., Shupnik M. A., Chin W. W. 1990. Molecular biology of the pituitary gonadotropins. Endocrinol. Rev. 11, 177–199 10.1210/edrv-11-1-177 (doi:10.1210/edrv-11-1-177) [DOI] [PubMed] [Google Scholar]
- 5.Crowley W. F., Jr, Filicori M., Spratt D. I., Santoro N. F. 1985. The physiology of gonadotropin-releasing hormone (GnRH) secretion in men and women. Recent Progr. Horm. Res. 41, 473–531 [DOI] [PubMed] [Google Scholar]
- 6.Ferris H. A., Shupnik M. A. 2006. Mechanisms for pulsatile regulation of the gonadotropin subunit genes by GNRH1. Biol. Reprod. 74, 993–998 10.1095/biolreprod.105.049049 (doi:10.1095/biolreprod.105.049049) [DOI] [PubMed] [Google Scholar]
- 7.Marshall J. C., Dalkin A. C., Haisenleder D. J., Griffin M. L., Kelch R. P. 1993. GnRH pulses—the regulators of human reproduction. Trans. Am. Clin. Climatol. Assoc. 104, 31–46 [PMC free article] [PubMed] [Google Scholar]
- 8.McCartney C. R., Eagleson C. A., Marshall J. C. 2002. Regulation of gonadotropin secretion: implications for polycystic ovary syndrome. Semin. Reprod. Med. 20, 317–326 10.1055/s-2002-36706 (doi:10.1055/s-2002-36706) [DOI] [PubMed] [Google Scholar]
- 9.Belchetz P. E., Plant T. M., Nakai Y., Keogh E. J., Knobil E. 1978. Hypophysial responses to continuous and intermittent delivery of hypothalamic gonadotropin-releasing hormone. Science 202, 631–633 10.1126/science.100883 (doi:10.1126/science.100883) [DOI] [PubMed] [Google Scholar]
- 10.Conn P. M., Crowley W. F., Jr 1994. Gonadotropin-releasing hormone and its analogs. Annu. Rev. Med. 45, 391–405 10.1146/annurev.med.45.1.391 (doi:10.1146/annurev.med.45.1.391) [DOI] [PubMed] [Google Scholar]
- 11.Krakauer D. C., Page K. M., Sealfon S. 2002. Module dynamics of the GnRH signal transduction network. J. Theor. Biol. 218, 457–470 10.1006/jtbi.2002.3092 (doi:10.1006/jtbi.2002.3092) [DOI] [PubMed] [Google Scholar]
- 12.McArdle C. A., Davidson J. S., Willars G. B. 1999. The tail of the gonadotrophin-releasing hormone receptor: desensitization at, and distal to, G protein-coupled receptors. Mol. Cell. Endocrinol. 151, 129–136 10.1016/S0303-7207(99)00024-6 (doi:10.1016/S0303-7207(99)00024-6) [DOI] [PubMed] [Google Scholar]
- 13.Finch A. R., Caunt C. J., Armstrong S. P., McArdle C. A. 2010. Plasma membrane expression of gonadotropin-releasing hormone receptors: regulation by peptide and nonpeptide antagonists. Mol. Endocrinol. 24, 423–435 10.1210/me.2009-0343 (doi:10.1210/me.2009-0343) [DOI] [PMC free article] [PubMed] [Google Scholar]
- 14.Washington T. M., Blum J. J., Reed M. C., Conn P. M. 2004. A mathematical model for LH release in response to continuous and pulsatile exposure of gonadotrophs to GnRH. Theor. Biol. Med. Model. 1, 9. 10.1186/1742-4682-1-9 (doi:10.1186/1742-4682-1-9) [DOI] [PMC free article] [PubMed] [Google Scholar]
- 15.Lim S., Luo M., Koh M., Yang M., Bin Abdul Kadir M. N., Tan J. H., Ye Z., Wang W., Melamed P. 2007. Distinct mechanisms involving diverse histone deacetylases repress expression of the two gonadotropin β-subunit genes in immature gonadotropes, and their actions are overcome by gonadotropin-releasing hormone. Mol. Cell. Biol. 27, 4105–4120 10.1128/MCB.00248-07 (doi:10.1128/MCB.00248-07) [DOI] [PMC free article] [PubMed] [Google Scholar]
- 16.Lim S., Pnueli L., Tan J. H., Naor Z., Rajagopal G., Melamed P. 2009. Negative feedback governs gonadotrope frequency-decoding of gonadotropin releasing hormone pulse-frequency. PLoS One 4, e7244. 10.1371/journal.pone.0007244 (doi:10.1371/journal.pone.0007244) [DOI] [PMC free article] [PubMed] [Google Scholar]
- 17.Cooling M. T., Hunter P., Crampin E. J. 2009. Sensitivity of NFAT cycling to cytosolic calcium concentration: implications for hypertrophic signals in cardiac myocytes. Biophys. J. 96, 2095–2104 10.1016/j.bpj.2008.11.064 (doi:10.1016/j.bpj.2008.11.064) [DOI] [PMC free article] [PubMed] [Google Scholar]
- 18.Hanson P. I., Meyer T., Stryer L., Schulman H. 1994. Dual role of calmodulin in autophosphorylation of multifunctional CaM kinase may underlie decoding of calcium signals. Neuron 12, 943–956 10.1016/0896-6273(94)90306-9 (doi:10.1016/0896-6273(94)90306-9) [DOI] [PubMed] [Google Scholar]
- 19.Macián F., García-Rodríguez C., Rao A. 2000. Gene expression elicited by NFAT in the presence or absence of cooperative recruitment of Fos and Jun. EMBO J. 19, 4783–4795 10.1093/emboj/19.17.4783 (doi:10.1093/emboj/19.17.4783) [DOI] [PMC free article] [PubMed] [Google Scholar]
- 20.Macián F., López-Rodríguez C., Rao A. 2001. Partners in transcription: NFAT and AP-1. Oncogene 20, 2476–2489 10.1038/sj.onc.1204386 (doi:10.1038/sj.onc.1204386) [DOI] [PubMed] [Google Scholar]
- 21.Sanna B., Bueno O. F., Dai Y.-S., Wilkins B. J., Molkentin J. D. 2005. Direct and indirect interactions between calcineurin-NFAT and MEK1-extracellular signal-regulated kinase 1/2 signaling pathways regulate cardiac gene expression and cellular growth. Mol. Cell. Biol. 25, 865–878 10.1128/MCB.25.3.865-878.2005 (doi:10.1128/MCB.25.3.865-878.2005) [DOI] [PMC free article] [PubMed] [Google Scholar]
- 22.Tomida T., Hirose K., Takizawa A., Shibasaki F., Iino M. 2003. NFAT functions as a working memory of Ca2+ signals in decoding Ca2+ oscillation. EMBO J. 22, 3825–3832 10.1093/emboj/cdg381 (doi:10.1093/emboj/cdg381) [DOI] [PMC free article] [PubMed] [Google Scholar]
- 23.Armstrong S. P., Caunt C. J., Fowkes R. C., Tsaneva-Atanasova K., Mcardle C. A. 2009. Pulsatile and sustained gonadotropin-releasing hormone (GnRH) receptor signaling: does the [Ca2+]i/NFAT signaling pathway decode GnRH pulse frequency? J. Biol. Chem. 284, 35 746–35 757 10.1074/jbc.M109.063917 (doi:10.1074/jbc.M109.063917) [DOI] [PMC free article] [PubMed] [Google Scholar]
- 24.Armstrong S. P., Caunt C. J., Fowkes R. C., Tsaneva-Atanasova K., McArdle C. A. 2010. Pulsatile and sustained gonadotropin-releasing hormone (GnRH) receptor signaling: does the ERK signaling pathway decode GnRH pulse frequency? J. Biol. Chem. 285, 24 360–24 371 10.1074/jbc.M110.115964 (doi:10.1074/jbc.M110.115964) [DOI] [PMC free article] [PubMed] [Google Scholar]
- 25.Li Y., Rinzel J., Keizer J., Stojilkovic S. S. 1994. Calcium oscillations in pituitary gonadotrophs: comparison of experiment and theory. Proc. Natl Acad. Sci. USA 91, 58–62 10.1073/pnas.91.1.58 (doi:10.1073/pnas.91.1.58) [DOI] [PMC free article] [PubMed] [Google Scholar]
- 26.Ruf F., Hayot F., Park M. J., Ge Y., Lin G., Roysam B., Sealfon S. C. 2007. Noise propagation and scaling in regulation of gonadotrope biosynthesis. Biophys. J. 93, 4474–4480 10.1529/biophysj.107.115170 (doi:10.1529/biophysj.107.115170) [DOI] [PMC free article] [PubMed] [Google Scholar]
- 27.Ruf F., Park M. J., Hayot F., Lin G., Roysam B., Ge Y., Sealfon S. C. 2006. Mixed analog/digital gonadotrope biosynthetic response to gonadotropin-releasing hormone. J. Biol. Chem. 281, 30 967–30 978 10.1074/jbc.M606486200 (doi:10.1074/jbc.M606486200) [DOI] [PubMed] [Google Scholar]
- 28.McArdle C. A., Forrest-Owen W., Davidson J. S., Fowkes R., Bunting R., Mason W. T., Poch A., Kratzmeier M. 1996. Ca2+ entry in gonadotrophs and alpha T3-1 cells: does store-dependent Ca2+ influx mediate gonadotrophin-releasing hormone action? J. Endocrinol. 149, 155–169 10.1677/joe.0.1490155 (doi:10.1677/joe.0.1490155) [DOI] [PubMed] [Google Scholar]
- 29.Berridge M. J. 2006. Remodelling Ca2+ signalling systems and cardiac hypertrophy. Biochem. Soc. Trans. 34, 228–231 10.1042/BST20060228 (doi:10.1042/BST20060228) [DOI] [PubMed] [Google Scholar]
- 30.Russo G., Di Bernardo M., Sontag E. D. 2010. Global entrainment of transcriptional systems to periodic inputs. PLoS Comput. Biol. 6, e1000739. 10.1371/journal.pcbi.1000739 (doi:10.1371/journal.pcbi.1000739) [DOI] [PMC free article] [PubMed] [Google Scholar]
- 31.Stavreva D. A., et al. 2009. Ultradian hormone stimulation induces glucocorticoid receptor-mediated pulses of gene transcription. Nat. Cell Biol. 11, 1093–1102 10.1038/ncb1922 (doi:10.1038/ncb1922) [DOI] [PMC free article] [PubMed] [Google Scholar]
- 32.Burger L. L., Haisenleder D. J., Aylor K. W., Marshall J. C. 2009. Regulation of Lhβ and Egr1 gene expression by GNRH pulses in rat pituitaries is both c-Jun N-terminal kinase (JNK)- and extracellular signal-regulated kinase (ERK)-dependent. Biol. Reprod. 81, 1206–1215 10.1095/biolreprod.109.079426 (doi:10.1095/biolreprod.109.079426) [DOI] [PMC free article] [PubMed] [Google Scholar]
- 33.Doedel E. J. 1981. AUTO: a program for the automatic bifurcation analysis of autonomous systems. Congr. Numer. 30, 265–284 [Google Scholar]
- 34.Ermentrout B. 2002. Simulating, analyzing and animating dynamical systems: a guide to XPPAUT for researchers and students. Philadelphia, PA: Society for Industrial and Applied Mathematics [Google Scholar]
- 35.Cournac A., Sepulchre J. A. 2009. Simple molecular networks that respond optimally to time-periodic stimulation. BMC Syst. Biol. 3, 29. 10.1186/1752-0509-3-29 (doi:10.1186/1752-0509-3-29) [DOI] [PMC free article] [PubMed] [Google Scholar]
- 36.Sontag E. D. 2010. Remarks on feedforward circuits, adaptation, and pulse memory. IET Syst. Biol. 4, 39–51 10.1049/iet-syb.2008.0171 (doi:10.1049/iet-syb.2008.0171) [DOI] [PubMed] [Google Scholar]
- 37.Vicent G. P., Zaurin R., Nacht A. S., Li A., Font-Mateu J., Dily F. L., Vermeulen M., Mann M., Beato M. 2009. Two chromatin remodeling activities cooperate during activation of hormone responsive promoters. PLoS Genet. 5, e1000567. 10.1371/journal.pgen.1000567 (doi:10.1371/journal.pgen.1000567) [DOI] [PMC free article] [PubMed] [Google Scholar]
- 38.Ciccone N. A., Xu S., Lacza C. T., Carroll R. S., Kaiser U. B. 2010. Frequency-dependent regulation of follicle-stimulating hormone by pulsatile gonadotropin-releasing hormone is mediated by functional antagonism of bZIP transcription factors. Mol. Cell. Biol. 30, 1028–1040 10.1128/MCB.00848-09 (doi:10.1128/MCB.00848-09) [DOI] [PMC free article] [PubMed] [Google Scholar]
- 39.Nowacki J. 2010. XPPy: a Python package for simulations in XPPAUT (Ermentrout, 2002). See http://seis.bris.ac.uk/~enxjn/xppy [Google Scholar]


