

Abstract
Metabolic rates of mammals presumably increased during the evolution of endothermy, but molecular and cellular mechanisms underlying basal metabolic rate (BMR) are still not understood. It has been established that mitochondrial basal proton leak contributes significantly to BMR. Comparative studies among a diversity of eutherian mammals showed that BMR correlates with body mass and proton leak. Here, we studied BMR and mitochondrial basal proton leak in liver of various marsupial species. Surprisingly, we found that the mitochondrial proton leak was greater in marsupials than in eutherians, although marsupials have lower BMRs. To verify our finding, we kept similar-sized individuals of a marsupial opossum (Monodelphis domestica) and a eutherian rodent (Mesocricetus auratus) species under identical conditions, and directly compared BMR and basal proton leak. We confirmed an approximately 40 per cent lower mass specific BMR in the opossum although its proton leak was significantly higher (approx. 60%). We demonstrate that the increase in BMR during eutherian evolution is not based on a general increase in the mitochondrial proton leak, although there is a similar allometric relationship of proton leak and BMR within mammalian groups. The difference in proton leak between endothermic groups may assist in elucidating distinct metabolic and habitat requirements that have evolved during mammalian divergence.
Keywords: marsupials, eutherians, basal metabolic rate, mitochondria, basal proton leak, liver
1. Introduction
Within mammals, marsupials diverged from eutherians about 150 million years ago [1]. They represent excellent model organisms to study and compare physiological mechanisms that are unique to mammals, or have developed differently during evolution. Marsupials, like other mammals, have high thermoregulatory capabilities. However, body temperature and basal metabolic rate (BMR) are lower in marsupials than in most eutherians [2].
BMR is defined as the minimal metabolic cost of living and endothermy for resting animals in the inactive phase of their circadian cycle, in steady state (i.e. no anabolic build-up of tissues—e.g. growth, fat storage, reproduction), while post absorptive (i.e. no digestion and assimilation costs) and in the absence of regulatory thermogenesis [3]. BMR can be estimated either directly by measurement of heat production (kJ h−1) or indirectly by determination of rate of oxygen consumption (ml O2 h−1).
In mammals, BMR is correlated with body mass (M) and is described by the allometric equation BMR = aM (kg)b (kJ h−1), where a is the mass coefficient and b the mass scaling component. The often cited mass scaling exponent (b) in mammals is about 0.75 [4]. When the equation is phylogenetically resolved for different mammalian taxa, some studies claim a deviation of b with controversial results ranging from 0.67 to 1.00 [5–8]. Conversely, mass specific BMR correlates negatively with body mass. A direct comparison of eutherian and marsupial BMR, however, suggests an approximately 25 per cent lower BMR in marsupials when compared with eutherians of a similar M [2,6,9].
A major step to understanding the contribution of cellular processes underlying BMR were studies addressing the proportion of oxidative metabolism on different systemic levels from organs to cells. Liver and skeletal muscles contribute about 43–60% to BMR (10–20% by liver and 33–40% by skeletal muscle) [10–12]. At the cellular level, mitochondria of rat hepatocytes consume approximately 80 per cent of cellular oxygen, while the remaining oxygen is used by non-mitochondrial processes [12,13]. Tissue-specific mitochondrial content correlates positively with BMR as does summated mitochondrial membrane surface area [14].
In mitochondria, electrons from nutrient oxidation are donated to the electron transport chain finally reducing oxygen to water. During this process, the respiratory complexes harvest the high potential energy of the electrons to pump protons out of the matrix generating a proton motive force which drives the adenosine triphosphate (ATP) synthase. This process is not fully efficient as protons can leak back to the matrix without the generation of ATP. Leakage of protons back to the matrix is uncontrolled and defined by the collective term basal proton leak [15]. In different cell types of a variety of species, about 60 per cent of the proton motive force is used for ATP-production while approximately 20 per cent of respiratory activity may counteract the depletion of proton motive force by the mitochondrial proton leak [16]. Studies on perfused skeletal muscle and liver of rats estimate that the relative contribution of proton leak to tissue respiration is as high as 35–50%. Assuming a similar proportion of proton leak in other tissues, at least 20 per cent of BMR may be owing to mitochondrial proton leak [12,16,17]. Taken together, these studies put forward the hypothesis that basal proton leak significantly contributes to BMR. The correlation between mass-specific BMR and mitochondrial proton leak (per mg of protein), both of them scaling negatively with body mass, has been established over the past 20 years in eutherian mammals [18].
Based on established allometries of proton leak and metabolic rate in eutherian mammals, we aimed to further corroborate this allometry on the evolutionary scale by studying marsupial proton leak, to our knowledge for the first time, expecting a lower proton leak than in eutherians.
In the present paper, proton leak data of liver mitochondria were collected in four Australian marsupial species (Antechinus flavipes, Sminthopsis crassicaudata, Sminthopsis macroura, Trichosurus vulpecula) ranging in body mass from approximately 19–1400 g. Within these marsupial species, BMR correlated with proton leak. When the present data were compared with published mitochondrial data on eutherians it emphasized a higher proton leak in the liver of marsupials. To further test this finding, we directly compared BMR and mitochondrial proton leak of the similar-sized short-tailed opossums (Monodelphis domestica) and Syrian hamsters (Mesocricetus auratus) which were housed under identical experimental conditions.
2. Material and methods
(a). Animals
Adult A. flavipes (31 g ± 1.6, n = 7) and T. vulpecula (1377 g ± 97, n = 11) were captured in Southeast Queensland (Australia) between January and March 2005. Sminthopsis crassicaudata (18.6 ± 0.8, n = 10) were obtained from a breeding colony based at La Trobe University, Melbourne. Sminthopsis macroura (23.1 ± 0.9, n = 6) were obtained from a breeding colony at the University of New England. All animals were kept at 24°C and housed individually in the animal facility of the University of Southern Queensland (12 L : 12 D, lights on at 07.00) with free access to water and food (mealworms and cat food mix including calcium carbonate) for three weeks. Prior to tissue dissection, a few individuals of A. flavipes (n = 4), T. vulpecula (n = 4) and S. crassicaudata (n = 5) were acclimated to 10°C for 14–22 days and individuals of T. vulpecula (n = 4) and S. macroura (n = 3) were fasted for 48 h.
Adult M. domestica (95 ± 10 g) from the breeding colony at the Philipps-Universität Marburg were used and Me. auratus (108 ± 3 g) were obtained from Charles River Laboratories (Germany). All animals were non-breeding and housed individually at the animal facilities of the Philipps-Universität Marburg for at least 3 weeks at 24°C (12 L : 12 D, lights on at 07.00) with free access to water and food (mealworms and cat food mix including calcium carbonate for the opossums and standard pellets for hamsters).
(b). Measurement of basal metabolic rate
The BMR of post absorptive adult S. crassicaudata (n = 10), A. flavipes (n = 7), M. domestica (n = 3) and Me. auratus (n = 3) were measured during the known rest phase for each species and in a thermoneutral [9,19–21], stress-free environment using open flow respirometry for at least 3–4 h. Measurement of body temperature before and after each measurement was performed for Me. auratus and M. domestica only, while all species were visually monitored throughout the measurement. Animals were placed in a metabolic chamber of appropriate volume for each species inside a temperature controlled cabinet without food or water and left resting until animals had acclimated to the experimental conditions. Air entered the metabolic chamber via a condenser and a drying tube and the rate of airflow (mass flowmeter) was maintained at a level appropriate to the body size and metabolic rate of each species ensuring oxygen levels did not drop lower than 0.5 per cent of normoxic values. Rate of oxygen consumption was determined as the product of flow and the difference between room air and mean minimum O2 levels from the chamber obtained for at least 15 min. Oxygen concentration was measured using an oxygen analyser (Ametek S-3A/I), and a system of solenoid valves enabled the oxygen concentration of air from a calibration chamber to be measured between measurements of air from the animal chamber.
The rate of oxygen consumption for all animals under investigation was calculated using eqn (3a) of Withers et al. [22] assuming a respiratory quotient of 0.85. Animals were weighed before and after each experiment. Mean body mass was used to calculate mass-specific metabolic rate (ml O2 g−1 h−1).
(c). Isolation of skeletal muscle and liver mitochondria
Animals were killed and the bulk of liver and/or skeletal muscle were used to isolate mitochondria as described previously [23]. Protein concentration was determined using the biuret method with fatty acid-free bovine serum albumin (BSA) as standard (Sigma no. A3803).
(d). Measurement of mitochondrial oxygen consumption
The rate of mitochondrial oxygen consumption was measured using a Clark-type oxygen electrode (Rank Brothers Ltd., UK) and calibrated with air-saturated medium (120 mmol l−1 KCl, 5 mmol l−1 KH2PO4, 3 mmol l−1 4-(2-hydroxyethyl)-1-piperazineethanesulfonic acid, 1 mmol l−1 ethylene glycol tetraacetic acid, and 0.3% (w/v) BSA, pH 7.2) which was assumed to contain 416 nmol O ml−1 at 35°C and 432 nmol O ml−1 at 32°C [24]. Mitochondria were suspended at 0.35 mg ml−1 to 0.5 mg ml−1 (for skeletal muscle) and 1.0 mg ml −1 (for liver) in 2.5 ml medium and incubated with 6 mmol l−1 succinate, 8 µmol l−1 rotenone, 4 µg ml−1 oligomycin and 110 ng ml−1 nigericin. State 2 respiration was measured in the presence of succinate without exogenous adenosine diphosphate (ADP) addition and respiratory control ratio (RCRol: the RCR calculated using the respiratory rate of mitochondria inhibited by oligomycin) was measured in all experiments to determine the accuracy of the mitochondrial preparation and the integrity of the mitochondria (RCRol > 3) using 600 µM ADP for the establishment of state 3 respiration.
(e). Measurement of proton leak
The respiration rate of mitochondria, in the presence of oligomycin to inhibit ATP synthesis (state 4ol), is proportional to the rate at which protons leak across the mitochondrial inner membrane. The kinetic response of the proton conductance to its driving force (proton motive force) can therefore be measured as the relationship between respiration rate and membrane potential when the potential is varied by titration with electron transport chain inhibitors [25,26]. Respiration rate and membrane potential were determined simultaneously using electrodes sensitive to oxygen and to the potential-dependent probe triphenylmethylphosphonium (TPMP+) [27]. The TPMP+ electrode was calibrated with sequential additions of up to 1.25 µmol l−1 TPMP+. TPMP+ correction factor was assumed to be 0.4 for liver and 0.35 for skeletal muscle as described previously [28].
Measurement of proton leak was performed for liver mitochondria of S. crassicaudata and S. macroura, A. flavipes and T. vulpecula, at their average body temperature of 35°C. Skeletal muscle and liver mitochondria of M. domestica and Me. auratus were measured at 32°C, the body temperature of M. domestica.
(f). Allometric relationships
Allometric relationships of BMR against body mass, liver mitochondrial proton leak against body mass and BMR in endotherms were analysed. Marsupial BMRs were measured in this study except for those for S. macroura and T. vulpecula, where literature values were used [2,29]. For eutherians, except Me. auratus, published data were used [30–36]. To compare proton leak rates of liver mitochondria between different groups, the proton leak values of marsupial species are shown at their respective physiological body temperature but were also extrapolated to 37°C.
To extrapolate proton leak data to 37°C, we used a Q10 = 1.4. This Q10 was determined in mouse liver mitochondria measured at 25°C and 37°C (see the electronic supplementary data S1). For the discussion, we re-analysed Q10 values of proton leak data from other studies [37–39].
(g). Statistical analysis
Values presented are mean ± s.e. of the mean for body mass, BMR, mitochondrial oxygen consumption and basal proton leak. One-way analysis of variance (ANOVA) was performed where applicable, with level of significance set to p < 0.05. For allometric relationships, least squares regressions were used to determine the relationships between BMR and basal proton leak against body mass and basal proton leak against BMR for eutherians and marsupials. A test for homogeneity of slopes revealed no difference between slopes for regressions of each variable (p > 0.05). The common regression coefficient was computed (see the electronic supplementary data S2), and in the case where this was significantly different from 0, it was used to standardize all data for the covariate [40] following log10-transformation of the data. Corrections for the covariate are normally made to the grand mean, but given that the data have been log transformed, proportionality across the covariate is maintained and adjustment of BMR and leak rates were therefore made to a standard value. Differences between group regressions, where appropriate, were tested with ANOVA. Significance was considered at p < 0.05. Log10 was used throughout for logarithmic transformations.
(i). Phylogenetically informed analysis
A phylogenetically informed analysis was conducted using Felsenstein's [41] independent contrasts, which were calculated in Mesquite using the phenotypic diversity analysis package (PDAP) module (www.mesquiteproject.org). Phylogenetically independent contrasts were calculated for log10-transformed body mass, BMR and basal proton leak. The phylogeny was taken from a published supertree of mammals [1] pruned to include only the species of interest. Dated branch lengths did not adequately standardize contrasts for log(body mass) and log(BMR), so Nee's arbitrary branch lengths [42], which did adequately standardize contrasts, were used. To determine if there is a significant difference in BMR between eutherian and marsupial mammals, the contrast for the Eutheria–Metatheria node was compared with the contrasts of all other nodes by calculating the 95 per cent prediction interval (e.g. [43]) for the relationship between positivized contrasts in log(BMR) and log(body mass). This procedure was then repeated for the relationships between log(proton leak) and log(body mass), and between log(proton leak) and log(BMR).
3. Results
(a). BMR and proton leak in Australian marsupials
Measurements of BMR in four Australian marsupials demonstrated that mass-specific BMR decreases with an increase in body mass; the smallest species, S. crassicaudata, exhibited the highest, while the largest species T. vulpecula (figure 1a) had the lowest. Visual inspection of all animals together with the similarity between obtained and published values for BMR for S. crassicaudata [2,9,44] and A. flavipes [44] reveal that metabolic rate was measured in a resting and non-torpid state.
Figure 1.

BMR and proton leak of liver mitochondria in Australian marsupials. (a) Mass-specific BMR measured at 32°C. Literature values from Song et al. [29] (S. macroura) and from Dawson & Hulbert [2] (T. vulpecula). (b) Full kinetic response of the basal proton leak rate to changes in membrane potential (filled diamond, S. macroura; filled square, S. crassicaudata; filled circle, A. flavipes; filled triangle, T. vulpecula), and (c) mitochondrial respiration rates at 35°C (black bars) and extrapolated to 37°C (grey bars) at the common membrane potential of 176 mV. Determination of the HCP is indicated by dotted lines. Afl, Antechinus flavipes; Scr, Sminthopsis crassicaudata; Sma, Sminthopsis macroura; Tvu, Trichosurus vulpecula.
Prior to tissue dissection for proton leak measurements, individuals of these four species were either maintained at 24°C, cold-acclimated or fasted as described in §2. The individual liver proton leak kinetics of each species were pooled as we found neither an effect of cold acclimation nor nutritional status (M. Jastroch 2011, unpublished data, and [23] for A. flavipes), thereby demonstrating that liver mitochondrial leak was insensitive to these physiological challenges and was a species-related characteristic (figure 1b).
Comparing proton leak rates at the highest common membrane potential (HCP) of 176 mV, the lowest proton leak rates were found in T. vulpecula, followed by S. macroura, A. flavipes and S. crassicaudata (figure 1c). Hence, the relationship between mass-specific BMR and mitochondrial proton leak (figure 1c) is similar to that reported in eutherians. A higher mass-specific metabolic rate is correlated with a higher mitochondrial proton leak; therefore, both mass-specific BMR and mitochondrial proton leak increase as body mass decreases.
(b). Measurement of BMR in Monodelphis domestica and Mesocricetus auratus
There was no significant difference in body mass between the opossum and hamster. The comparison of mass-specific BMR between M. domestica and Me. auratus revealed a significantly (approx. 40%) lower metabolic rate in the marsupial (M. domestica 0.58 ± 0.2 ml O2 h −1 g−1 versus Me. auratus 1.06 ± 0.1 ml O2 h −1 g−1; figure 2).
Figure 2.
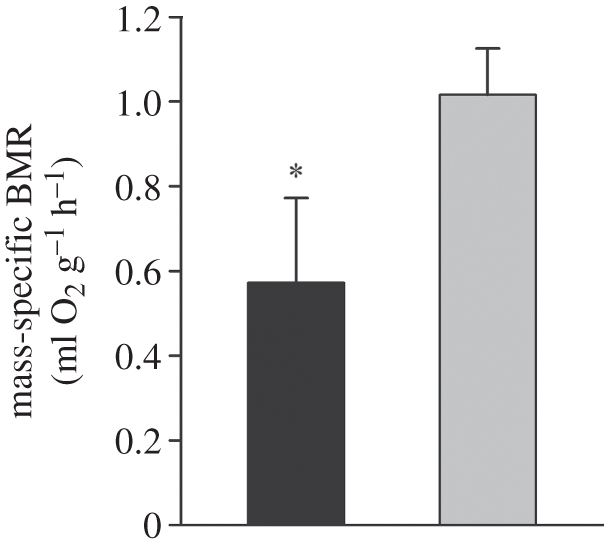
Mass-specific BMR (ml O2 g−1 h−1) of Monodelphis domestica (black bars) and Mesocricetus auratus (grey bars) measured at thermoneutrality, 28°C and 32°C, respectively. All animals were acclimated at 24°C. Values are means ± s.e., n = 3 for both species. One-way ANOVA, *p < 0.05.
(c). Mitochondrial respiration in liver and skeletal muscle mitochondria of Monodelphis domestica and Mesocricetus auratus
Respiration rates at different mitochondrial states as well as carbonyl cyanide-p-trifluoromethoxyphenylhydrazone (FCCP) respiration of liver mitochondria measured at 32°C and using succinate as a substrate were not significantly different between the two species (figure 3a). A trend towards higher state 4ol respiration in opossum liver mitochondria indicated a higher proton leak rate than the hamster (p = 0.12, n = 3), although phosphorylation and substrate oxidation capacity (state 3 and FCCP respiration) appeared to be lower in the marsupial. RCRols calculated as the ratio of phosphorylative respiration (state 3) divided by leak respiration (state 4ol) were variable among individuals, but an average value of approximately 9 in hamster liver when compared with approximately 6 in the opossum indicated less mitochondrial efficiency in the opossum. In skeletal muscle mitochondria, the different mitochondrial respiration states between opossum and hamster were not significantly different, with RCRols averaging approximately 4 in the opossum and approximately 3 in the hamster (figure 3b).
Figure 3.

Mitochondrial respiration rates at state 2, 3 and state 4ol; and upon artificial uncoupling with FCCP of (a) liver and (b) skeletal muscle mitochondria of Monodelphis domestica (black) and Mesocricetus auratus (grey) measured at 32°C. No significant differences of respiration states were found between species.
(d). Basal proton leak of liver and skeletal muscle mitochondria in Monodelphis domestica and Mesocricetus auratus
State 4ol respiration estimates proton leak rate, but to compare the proton permeability of the mitochondrial inner membrane between two groups this proton leak rate must be compared at the identical driving force. Therefore, the full kinetic response of the proton leak (monitored as oxygen consumption rate) at 32°C to stepwise changes in its driving force, i.e. its membrane potential, was measured in liver and skeletal muscle mitochondria from M. domestica and Me. auratus (figure 4a,c). Meaningful comparisons between proton leak curves were made at the HCP and for analysis the proton leak rates at this potential were taken from the leak kinetics assuming linearity between data points and plotted for each species (figure 4b,d). Comparing the leak titrations between both tissues, we found that basal proton leak in marsupial liver mitochondria is lower than in skeletal muscle (about 60% when compared at HCP).
Figure 4.

The full kinetic response of proton leak rate to changes in membrane potential of (a) liver and (c) skeletal muscle mitochondria from Monodelphis domestica (black circles) and Mesocricetus auratus (grey circles). Mitochondrial oxygen consumption at the HCP of 177 mV for (b) liver and of 170 mV for (d) skeletal muscle mitochondria are shown in the right panel. Mitochondrial respiration in M. domestica liver mitochondria (black bars) is significantly higher than in Me. auratus (grey bars). One-way ANOVA, *p < 0.05. HCP is illustrated by dotted lines. All values are means ± s.e., n = 4 individuals, each performed in duplicate.
In liver mitochondria, the proton leak curve of M. domestica is shifted upwards when compared with Me. auratus, indicating an increased proton conductance. The leak respiration rate at HCP for liver mitochondria (figure 4b) is significantly higher in M. domestica (25.9 ± 5.2 nmol O min−1 mg−1 protein) than in Me. auratus (12.0 ± 0.9 nmol O min−1 mg−1 protein).
In skeletal muscle mitochondria, the proton leak kinetics between the two species overlap, demonstrating that mitochondrial proton conductance between M. domestica and Me. auratus are very similar (figure 4c,d).
(e). Allometry of mitochondrial proton leak with BMR and body mass in mammals
Mass-specific BMR in marsupials from our study is proportional to the same fractional power but significantly lower than in eutherians (p < 0.05, figure 5a, see the electronic supplementary data S2), as reported previously by Dawson & Hulbert [2]. In the present study, the allometric regression equation for marsupials is similar to Sieg et al. [45] which considered a larger number of marsupial species.
Figure 5.

Allometric relationship between (a) BMR and body mass (M), (b) liver basal proton leak (PL) and M and (c) liver PL and BMR of marsupials (grey and white dots; white dots represent species from this study) and eutherians (black dots) measured at actual body temperatures. Dotted line shows linear regression for marsupials, when values were extrapolated to 37°C. Statistical analysis revealed that BMR as a function of M is lower in marsupials when compared with eutherians and PL in dependence of M and BMR is significantly higher in marsupials when compared with eutherians (see insets). Literature values for BMR in marsupials: Dasycercus cristicauda, Didelphis virginiana, Macropus robustus, Petaurus breviceps, Potorus tridactylus, Sarcophilus harisii [6] and eutherians: Equus caballus [30], Mus musculus [32], Mustela furo [32], Ovis aries [4], Oryctolagus cuniculus [33], Phodopus sungorus [34], Rattus norvegicus [35], Sus scrofa [36], Eut. = Eutheria, Mar. = Marsupialia. One-way ANOVA, *p < 0.05. Relationship between phylogenetically independent contrasts in (d) BMR and M, (e) PL and M and (f) PL and BMR of marsupials and eutherians, at their body temperatures. The contrast between eutherians and marsupials is indicated by X, and all relationships were calculated excluding this contrast. Solid line is the phylogenetically independent relationship constrained to pass through the origin. Dashed lines represent the 95 per cent prediction interval (PI). The difference between eutherians and marsupials is significant in (d) and (f), because the Eutheria–Metatheria contrast falls outside the 95 per cent PI for the remaining contrasts.
In marsupials and eutherians, the regression of basal proton leak against body mass (figure 5b, see the electronic supplementary data S2) has a similar negative mass scaling exponent. Marsupials in our study, however, showed a higher mass scaling coefficient (p < 0.05). This demonstrates that the proton leak of marsupials is generally higher than in eutherians when adjusted for variation in body mass (see inset in figure 5b). The regression line for basal proton leak against mass-specific BMR (figure 5c, see the electronic supplementary data S2) has a positive mass scaling exponent which is similar for both marsupials and eutherians. Here, the mass scaling coefficient in marsupials is significantly higher when compared with the eutherian group (p < 0.05). Thus, the proton leak of the marsupial is higher than in eutherian species when comparing species with similar BMR (see inset in figure 5c). Incorporating phylogenetic information into the statistical analysis using phylogenetic independent contrasts (PICs) (figure 5d–f) revealed that log(BMR) differed significantly between eutherians and marsupials when accounting for log(body mass) (p < 0.05, figure 5d). Log(proton leak) did not differ between eutherians and marsupials when accounting for log(body mass) (p > 0.05, figure 5e), but log(proton leak) did differ between eutherians and marsupials when accounting for log(BMR) (p < 0.05, figure 5f).
4. Discussion
In this study, we demonstrate that mitochondrial proton leak is higher in the liver of a marsupial than in a eutherian of the same body mass, despite a lower metabolic rate of the marsupial. Within marsupials, mass-specific BMR and mitochondrial proton leak correlate negatively with body mass, with a mass scaling exponent similar to eutherians.
The higher proton leak in marsupials when compared with eutherians was unexpected, as some studies suggested a correlation of liver basal proton leak and BMR [17,18]. To support our initial findings, we improved the control over the experiments by pairwise comparisons of BMR and proton leak in mass-matched short-tailed opossums and Syrian hamsters. We demonstrated that the BMR of the short-tailed opossum is about 40 per cent lower than in the Syrian hamster while proton permeability is about 60 per cent increased. Comparing our BMR values to data published previously, M. domestica in our experiments had a similar metabolic rate as determined by Dawson & Olson [20]. For Me. auratus, the BMR in this study (1.06 ± 0.1 ml O2 g−1-h−1) was comparable to the BMR measured in the active phase of this species (0.96 ml O2 g−1 h−1) by Stewart & McClure [21]. The difference in BMR between the marsupial M. domestica and the eutherian Me. auratus is about 10 per cent greater than expected based on previously reported marsupial-eutherian relationships [2,9]. The BMRs reported here on two representative species of each mammalian clade strongly support a distinct metabolic difference, independent of body mass. Besides phylogenetic distance, causes for the difference in BMR between these species in general could be explained by niche selection, including environmental parameters such as geographical distribution, isolation, climate, different habitat use, dietary requirements, and different reproductive strategies, which are all known factors impacting on the energy balance of a species [8,44,46].
A comparison of state 4ol respiration rates already indicated that the proton leak might be higher in M. domestica than in Me. auratus liver (figure 3a). By measuring the proton leak kinetics of liver mitochondria, this confirms a higher proton permeability in M. domestica (figure 4a,b). The comparison of the basal proton leak rates of both species was conducted at 32°C, which reflects the body temperature of the opossum. The measurement at a single assay temperature allowed meaningful comparisons of the biophysical proton permeability between these two species. While measurements of mammalian mitochondria are usually performed at 37°C, it needs to be considered that adult M. domestica never experience eutherian normothermic temperatures, and that high temperatures may disrupt the integrity or damage the mitochondrial inner membrane. In fact, a number of marsupial and eutherian species are heterothermic and the organ temperatures of the hamster may decrease occasionally (during daily torpor and hibernation) to values lower than 32°C [47]. Clearly, body temperature has a strong effect on the physical properties of membranes such as static order (‘fluidity’), phase changes and phospholipid composition [48] which may lead to temperature-compensatory modifications and may affect proton permeability [13]. It may, therefore, be considered that the proton permeability of the eutherian might be similar to that of the marsupial when measured at 37°C or reduced when measured below normothermic values.
A Q10 of approximately 2 for proton leak has been assumed by previous investigators [37], possibly adopted from one early study measuring mitochondrial proton conductance in rat liver at 4°C, 25°C and 37°C [38]. Re-analysing these data, we found an average Q10 of 1.85, with considerable deviation from 1.3 (between 4°C and 25°C) to 3.4 (between 25°C and 37°C). Although speculative, a higher Q10 might result from changes in membrane static order. While these Q10 values were determined outside the physiological relevant temperature in the rat, we emphasize that Q10 values should be obtained from species that at least periodically experiences temperatures in the experimental range. This suggestion is corroborated by a study of Brown et al., where a Q10 of about 1.4 can be determined in the heterothermic hamster [39]. Using the Q10 of mouse liver mitochondrial proton leak (Q10 of 1.4—see the electronic supplementary data S1), the proton leak data of different assay temperatures were extrapolated to a common temperature to compare within and between taxonomic groups.
The proton leak of all mammals, including marsupials, negatively correlates with body mass (figure 5b). When we compare the proton leak rate at the relevant body temperature (reflected in the assay temperature), marsupials show a significantly higher basal proton leak over body mass when compared with eutherians. Extrapolation of marsupial proton leak rates to 37°C increases the difference to eutherians. Although extrapolations of the proton leak to higher temperatures were performed in previous studies [49], the proton leak rate within the physiological range is more important for relationships with BMR. Measured and extrapolated values strongly support that marsupial proton leak is not lower than in eutherians of the same body mass. Interestingly, when incorporating phylogenetic information into the analysis the observed difference between the subclasses is no longer present (figure 5e). Despite this observation being contradictory to the previous analysis, it is most probably attributable to the power of the PIC analysis when using a very small number of species.
More importantly, marsupial proton leak is positively correlated with mass-specific BMR, as found within eutherians, and both traditional and PIC analyses support the finding that marsupials in comparison to eutherians possess a higher proton leak when comparing species with similar BMR (figure 5f). Therefore, the mitochondrial proton leak does not explain the differences in BMR between eutherians and marsupials. Indeed, it would seem that the basal proton leak is a distinct characteristic of a particular endothermic group rather than a general function of BMR across all vertebrates. Further, these results do not support a study that comprised extrapolated values from ectothermic fishes to eutherian species, claiming a universal relationship between proton leak in liver mitochondria and BMR [49]. In fact, the metabolic rate as well as proton leak rate in ectotherms fluctuates dramatically with adaptation, nutrition and ambient parameters [50]. What is the significance of a higher proton leak in marsupials? A higher leak at high substrate oxidation rates means higher heat dissipation. Whether more heat generated in the liver may contribute to thermogenesis in marsupials or even compensate for the lack of functional brown adipose tissue in adult marsupials, requires further experimentation. Our data on state 3 and FCCP respiration in marsupial liver mitochondria show no difference or even indicate a slightly lower maximal substrate oxidation rate when compared with eutherians. This suggests a lower efficiency of ATP synthesis, but in future studies, measuring the kinetic responses of substrate oxidation and phosphorylation will assist to resolve mitochondrial efficiency. As these experiments show that mitochondrial proton leak differs between mammalian subgroups in vitro, this study generates impact for further experimentation to identify molecular mechanisms of metabolic rates in vivo, e.g. comparison of hepatocyte metabolism. The systematic comparison of metabolic rates on different levels of organization will elucidate key mechanisms leading to differences in metabolism and assist to understand the evolutionary pattern of endothermy.
To our knowledge, this is the first study presenting data on mitochondrial basal proton leak in marsupials. Comparison between marsupials and eutherians for the allometries of BMR and proton leak contradict the tenet of a general correlation between proton permeability and BMR. Basal proton leak would appear to be a distinct characteristic of a particular mammalian subclass and not to universally correlate with BMR.
Acknowledgements
All experimental protocols were approved by the Animal Ethics Committee of the University of Southern Queensland, Queensland Environmental Protection Agency (permit WISP02633304) and Environment Australia (export no. WT2005-12 380). All experimental protocols were approved in accordance with the German Animal Welfare Laws.
E.P. is supported by a scholarship of the CSIRO ICT Centre; M.J. is supported by a DFG fellowship (JA1884/2). We thank Dr Carola Meyer for the courtesy advising BMR measurements in this study.
References
- 1.Bininda-Emonds O. R. P., et al. 2008. The delayed rise of present-day mammals. Nature 456, 274. 10.1038/nature07347 (doi:10.1038/nature07347) [DOI] [PubMed] [Google Scholar]
- 2.Dawson T. J., Hulbert A. J. 1970. Standard metabolism, body temperature, and surface areas of Australian marsupials. Am. J. Physiol. 218, 1233–1238 [DOI] [PubMed] [Google Scholar]
- 3.Frappell P. B., Butler P. J. 2004. Minimal metabolic rate, what it is, its usefulness, and its relationship to the evolution of endothermy: a brief synopsis. Physiol. Biochem. Zool. 77, 865–868 10.1086/425191 (doi:10.1086/425191) [DOI] [PubMed] [Google Scholar]
- 4.Kleiber M. 1961. Body size and metabolic rate. The fire of life (ed. Kleiber M.) pp. 177–216 New York, NY: Wiley [Google Scholar]
- 5.Hemmingsen A. M. 1960. Energy metabolism as related to body size and respiratory surfaces, and its evolution. Report Stemo. Meml. Ho. 9, 1–110 [Google Scholar]
- 6.Hayssen V., Lacy R. C. 1985. Basal metabolic rates in mammals: taxonomic differences in the allometry of BMR and body mass. Comp. Biochem. Physiol. A 81, 741–754 10.1016/0300-9629(85)90904-1 (doi:10.1016/0300-9629(85)90904-1) [DOI] [PubMed] [Google Scholar]
- 7.White C. R., Seymour R. S. 2003. Mammalian basal metabolic rate is proportional to body mass2/3. Proc. Natl Acad. Sci. USA 100, 4046–4049 10.1073/pnas.0436428100 (doi:10.1073/pnas.0436428100) [DOI] [PMC free article] [PubMed] [Google Scholar]
- 8.McNab B. K. 2008. An analysis of the factors that influence the level and scaling of mammalian BMR. Comp. Biochem. Physiol. A 151, 5–28 10.1016/j.cbpa.2008.05.008 (doi:10.1016/j.cbpa.2008.05.008) [DOI] [PubMed] [Google Scholar]
- 9.MacMillen R. E., Nelson J. E. 1969. Bioenergetics and body size in dasyurid marsupials. Am. J. Physiol. 217, 1246–1251 [DOI] [PubMed] [Google Scholar]
- 10.Field J., Belding H. S., Martin A. W. 1939. An analysis of the relation between basal metabolism and summated tissue respiration in the rat. J. Cell Comp. Physiol. 14, 143–155 10.1002/jcp.1030140202 (doi:10.1002/jcp.1030140202) [DOI] [Google Scholar]
- 11.Jansky L. 1965. Adaptability of heat production mechanisms in homeotherms. Acta Univ. Carol. Med. 1, 1–91 [Google Scholar]
- 12.Rolfe D. F. S., Brand M. D. 1996. Contribution of mitochondrial proton leak to skeletal muscle respiration and to standard metabolic rate. Am. J. Physiol. Cell Physiol. 271, C1380–C1389 [DOI] [PubMed] [Google Scholar]
- 13.Brand M. D., Chien L. F., Ainscow E. K., Rolfe D. F. S., Porter R. K. 1994. The causes and functions of mitochondrial proton leak. BBA Bioenergetics 1187, 132–139 10.1016/0005-2728(94)90099-X (doi:10.1016/0005-2728(94)90099-X) [DOI] [PubMed] [Google Scholar]
- 14.Else P. L., Hulbert A. J. 1985. An allometric comparison of the mitochondria of mammalian and reptilian tissues: the implications for the evolution of endothermy. J. Comp. Physiol. B 156, 3–11 10.1007/BF00692920 (doi:10.1007/BF00692920) [DOI] [PubMed] [Google Scholar]
- 15.Jastroch M., Divakaruni A. S., Mookerjee S., Treberg J. R., Brand M. D. 2010. Mitochondrial proton and electron leaks. Essays Biochem. 47, 53–67 10.1042/bse0470053 (doi:10.1042/bse0470053) [DOI] [PMC free article] [PubMed] [Google Scholar]
- 16.Brand M. 2005. The efficiency and plasticity of mitochondrial energy transduction. Biochem. Soc. Trans. 33, 897–904 10.1042/BST20050897 (doi:10.1042/BST20050897) [DOI] [PubMed] [Google Scholar]
- 17.Rolfe D. F. S., Newman J. M. B., Buckingham J. A., Clark M. G., Brand M. D. 1999. Contribution of mitochondrial proton leak to respiration rate in working skeletal muscle and liver and to SMR. Am. J. Physiol. Cell Physiol. 276, 692–699 [DOI] [PubMed] [Google Scholar]
- 18.Porter R. K., Brand M. D. 1993. Body mass dependence of H+ leak in mitochondria and its relevance to metabolic rate. Nature 362, 628–630 10.1038/362628a0 (doi:10.1038/362628a0) [DOI] [PubMed] [Google Scholar]
- 19.Inns R. W. 1976. Some seasonal-changes in Antechinus flavipes (Marsupialia-Dasyuridae). Austral. J. Zool. 24, 523–531 10.1071/ZO9760523 (doi:10.1071/ZO9760523) [DOI] [Google Scholar]
- 20.Dawson T. J., Olson J. M. 1988. Thermogenic capabilities of the opossum Monodelphis domestica when warm and cold acclimated: similarities between American and Australian marsupials. Comp. Biochem. Physiol. A 89, 85–91 10.1016/0300-9629(88)91143-7 (doi:10.1016/0300-9629(88)91143-7) [DOI] [PubMed] [Google Scholar]
- 21.Stewart C. A., McClure P. A. 1993. Diurnal variation in thermal and metabolic parameters of the golden hamster (Mesocricetus auratus). J. Comp. Physiol. B 163, 234–238 10.1007/BF00261670 (doi:10.1007/BF00261670) [DOI] [PubMed] [Google Scholar]
- 22.Withers P. C., Cooper C. E., Larcombe A. N. 2006. Environmental correlates of physiological variables in marsupials. Physiol. Biochem. Zool. 79, 437–453 10.1086/501063 (doi:10.1086/501063) [DOI] [PubMed] [Google Scholar]
- 23.Jastroch M., Withers K. W., Stoehr S., Klingenspor M. 2009. Mitochondrial proton conductance in skeletal muscle of a cold-exposed marsupial, Antechinus flavipes, is unlikely to be involved in adaptive nonshivering thermogenesis but displays increased sensitivity toward carbon-centered radicals. Physiol. Biochem. Zool. 82, 447–454 10.1086/603631 (doi:10.1086/603631) [DOI] [PubMed] [Google Scholar]
- 24.Reynafarje B., Costa L., Lehninger A. L. 1985. O2 solubility in aqueous media determined by kinetic method. Anal. Biochem. 145, 406–418 10.1016/0003-2697(85)90381-1 (doi:10.1016/0003-2697(85)90381-1) [DOI] [PubMed] [Google Scholar]
- 25.Nicholls D. G. 1974. The influence of respiration and ATP hydrolysis on the proton electrochemical gradient across the inner membrane of rat liver mitochondria as determined by ion distribution. Eur. J. Biochem. 50, 305–315 10.1111/j.1432-1033.1974.tb03899.x (doi:10.1111/j.1432-1033.1974.tb03899.x) [DOI] [PubMed] [Google Scholar]
- 26.Brand M. D. 1990. The proton leak across the mitochondrial inner membrane. BBA Bioenergetics 1018, 128–133 10.1016/0005-2728(90)90232-S (doi:10.1016/0005-2728(90)90232-S) [DOI] [PubMed] [Google Scholar]
- 27.Brand M. D. 1995. Measurement of mitochondrial protonmotive force. In Bioenergetics—a practical approach (ed. Brown G. C.), pp. 39–62 Oxford, UK: IRL Press [Google Scholar]
- 28.Rolfe D. F. S., Hulbert A. J., Brand M. D. 1994. Characteristics of mitochondrial proton leak and control of oxidative phosphorylation in the major oxygen-consuming tissues of the rat. BBA Bioenergetics 1188, 405–416 10.1016/0005-2728(94)90062-0 (doi:10.1016/0005-2728(94)90062-0) [DOI] [PubMed] [Google Scholar]
- 29.Song X., Geiser F., Körtner G. 1995. Reduction of metabolic rate and thermoregulation during daily torpor. J. Comp. Physiol. B 165, 291–297 10.1007/BF00367312 (doi:10.1007/BF00367312) [DOI] [PubMed] [Google Scholar]
- 30.Eisenberg J. F. 1981. The mammalian radiations: an analysis of trends in evolution, adaption and behavior. London, UK: Athlone Press [Google Scholar]
- 31.Taylor C. R., Schmidt-Nielsen K., Raab J. L. 1970. Scaling of energetic cost of running to body size in mammals. Am. J. Physiol. 219, 1104–1107 [DOI] [PubMed] [Google Scholar]
- 32.Korhonen H., Harri M., Asikainen J. 1983. Thermoregulation of polecat and raccoon dog: a comparative study with stoat, mink and blue fox. Comp. Biochem. Physiol. A 74, 225–230 10.1016/0300-9629(83)90592-3 (doi:10.1016/0300-9629(83)90592-3) [DOI] [PubMed] [Google Scholar]
- 33.Hinds D. S., Baudinette R. V., Macmillen R. E., Halpern E. A. 1993. Maximum metabolism and the aerobic factorial scope of endotherms. J. Exp. Biol. 182, 41–56 [DOI] [PubMed] [Google Scholar]
- 34.Heldmaier G., Steinlechner S. 1981. Seasonal control of energy requirements for thermoregulation in the djungarian hamster (Phodopus sungorus), living in natural photoperiod. J. Comp. Physiol. B 142, 429–437 10.1007/BF00688972 (doi:10.1007/BF00688972) [DOI] [Google Scholar]
- 35.Rosenmann M., Morrison P. 1974. Maximum oxygen consumption and heat loss facilitation in small homeotherms by He-O2. Am. J. Physiol. 226, 490–495 [DOI] [PubMed] [Google Scholar]
- 36.Iversen J. A. 1972. Basal energy metabolism of mustelids. J. Comp. Physiol. A 81, 341–344 10.1007/BF00697754 (doi:10.1007/BF00697754) [DOI] [Google Scholar]
- 37.Stuart J. A., Harper J. A., Brindle K. M., Jekabsons M. B., Brand M. D. 2001. A mitochondrial uncoupling artefact can be caused by expression of uncoupling protein 1 in yeast. Biochem. J. 356, 779–789 10.1042/0264-6021:3560779 (doi:10.1042/0264-6021:3560779) [DOI] [PMC free article] [PubMed] [Google Scholar]
- 38.Dufour S., Rousse N., Canioni P., Diolez P. 1996. Top-down control analysis of temperature effect on oxidative phosphorylation. Biochem. J. 314, 743–751 [DOI] [PMC free article] [PubMed] [Google Scholar]
- 39.Brown J. C. L., Gerson A. R., Staples J. F. 2007. Mitochondrial metabolism during daily torpor in the dwarf Siberian hamster: role of active regulated changes and passive thermal effects. Am. J. Physiol. Reg. I 293, R1833–R1845 [DOI] [PubMed] [Google Scholar]
- 40.Packard G. C., Boardman T. J. 1999. The use of percentages and size-specific indices to normalize physiological data for variation in body size: wasted time, wasted effort? Comp. Biochem. Physiol. A 122, 37–44 10.1016/S1095-6433(98)10170-8 (doi:10.1016/S1095-6433(98)10170-8) [DOI] [Google Scholar]
- 41.Felsenstein J. 1985. Phylogenies and the comparative method. Am. Nat. 125, 1–15 10.1086/284325 (doi:10.1086/284325) [DOI] [Google Scholar]
- 42.Purvis A. 1995. A composite estimate of primate phylogeny. Phil. Trans. R. Soc. Lond. B 348, 405–421 10.1098/rstb.1995.0078 (doi:10.1098/rstb.1995.0078) [DOI] [PubMed] [Google Scholar]
- 43.Cooper C. E., Withers P. C. 2006. Numbats and aardwolves—how low is low? A re-affirmation of the need for statistical rigour in evaluating regression predictions. J. Comp. Physiol. A 176, 623–629 [DOI] [PubMed] [Google Scholar]
- 44.Lovegrove B. G. 2003. The influence of climate on the basal metabolic rate of small mammals: a slow-fast metabolic continuum. J. Comp. Physiol. B 173, 87–112 [DOI] [PubMed] [Google Scholar]
- 45.Sieg A. E., O'Connor M. P., McNair J. N., Grant B. W., Agosta S. J., Dunham A. E. 2009. Mammalian metabolic allometry: do intraspecific variation, phylogeny, and regression models matter? Am. Nat. 174, 720–733 10.1086/606023 (doi:10.1086/606023) [DOI] [PubMed] [Google Scholar]
- 46.Lovegrove B. G. 2000. The zoogeography of mammalian basal metabolic rate. Am. Nat. 156, 201–219 10.1086/303383 (doi:10.1086/303383) [DOI] [PubMed] [Google Scholar]
- 47.Heldmaier G., Ruf T. 1992. Body temperature and metabolic rate during natural hypothermia in endotherms. J. Comp. Physiol. B 162, 696–706 10.1007/BF00301619 (doi:10.1007/BF00301619) [DOI] [PubMed] [Google Scholar]
- 48.Hulbert A. J., Else P. L. 1999. Membranes as possible pacemakers of metabolism. J. Theor. Biol. 199, 257–274 10.1006/jtbi.1999.0955 (doi:10.1006/jtbi.1999.0955) [DOI] [PubMed] [Google Scholar]
- 49.Brookes P. S., Buckingham J. A., Tenreiro A. M., Hulbert A. J., Brand M. D. 1998. The proton permeability of the inner membrane of liver mitochondria from ectothermic and endothermic vertebrates and from obese rats: correlations with standard metabolic rate and phospholipid fatty acid composition. Comp. Biochem. Physiol. B 119, 325–334 10.1016/S0305-0491(97)00357-X (doi:10.1016/S0305-0491(97)00357-X) [DOI] [PubMed] [Google Scholar]
- 50.Trzcionka M., Withers K. W., Klingenspor M., Jastroch M. 2008. The effects of fasting and cold exposure on metabolic rate and mitochondrial proton leak in liver and skeletal muscle of an amphibian, the cane toad Bufo marinus. J. Exp. Biol. 211, 1911–1918 10.1242/jeb.016519 (doi:10.1242/jeb.016519) [DOI] [PubMed] [Google Scholar]