Abstract
Explaining the origin and maintenance of biodiversity is critical for understanding the potential consequences of present-day environmental change on ecological communities, as well as the evolutionary history of ecosystems in the Earth's past. Much effort in theoretical ecology has focused on identifying mechanisms that promote stable coexistence of species at equilibrium. However, in a consumer–resource model of competition along an environmental gradient, high-diversity assemblages have the potential to persist in non-equilibrium states for millions of generations with very little species loss. Species' populations in such competitively accommodated communities show slow drift; if disrupted, they rapidly reorganize into alternative persistent states. Fossil examples of prolonged ecological stability lasting 1–5 Myr punctuated by rapid reorganization (e.g. brachiopods from the Permian Reef of west Texas) suggest that some palaeocommunities represent a record of periodically disrupted transient states rather than stable equilibria. The similarity between the theoretical results reported here and palaeontological data suggests that the maintenance of high-diversity communities, both in the past and present, may reflect long-duration, non-equilibrium transient dynamics. If so, this has implications for the response of such communities to present-day environmental change, as well as for the evolution of lineages in such systems.
Keywords: consumer–resource model, ecological community, Permian, brachiopods, punctuated turnover
1. Introduction
A central goal of ecology is to understand the mechanisms by which biodiversity has originated and is maintained. However, because ecological communities are complex, dynamic systems that change and evolve over timescales from seconds to geological eons, their state at any moment in time is contingent upon their state in the past. Information on past ecological states is typically only available from the fossil record, and although temporal resolution of fossil data is limited, numerous studies have demonstrated that fossils can preserve useful information on diversity and abundance [1–3], and often reveal unexpected patterns.
Fossil data have provided important insights into the nature of extant communities [4–7], but even long-extinct palaeoecosystems can provide valuable tests of process-based ecological theory at temporal and spatial scales that cannot be approached using living organisms. For example, an important, novel pattern observed in some high-diversity fossil communities displays apparent compositional stability lasting 1–5 Myr punctuated by brief episodes of reorganization [8–12]. Communities governed by processes promoting stable coexistence of species [13,14] are predicted to return to their original state after being perturbed, unlike some fossil examples. Communities operating under neutral model conditions are predicted to display stochastically drifting species abundances rather than a compositional steady state [15–19], unlike the stability observed in fossil examples [4,5,8]. Understanding the dynamics of high-diversity communities over longer durations than are possible from the human record of observation is critical for understanding the trajectory of present-day ecosystems as they respond to the ongoing environmental perturbations [7].
2. Model description
The model used here [20–24] describes population dynamics in a community of species competing for a common resource distributed along a linear environmental gradient (of length L). Each species is assigned a utilization curve, Ci(x), describing its resource consumption efficiency at every location on the gradient (figure 1). The rate of population size change of species i is
where Ni = total population size of species i, t = time, bi = conversion rate of consumed resource, di = per capita death rate and R(x) = amount of available resource as a function of position x along the environmental gradient. Change in R(x) is
 |
where I(x) = influx of the resource at location x, E(x) = proportion of resource lost at location x and S = number of species.
Figure 1.
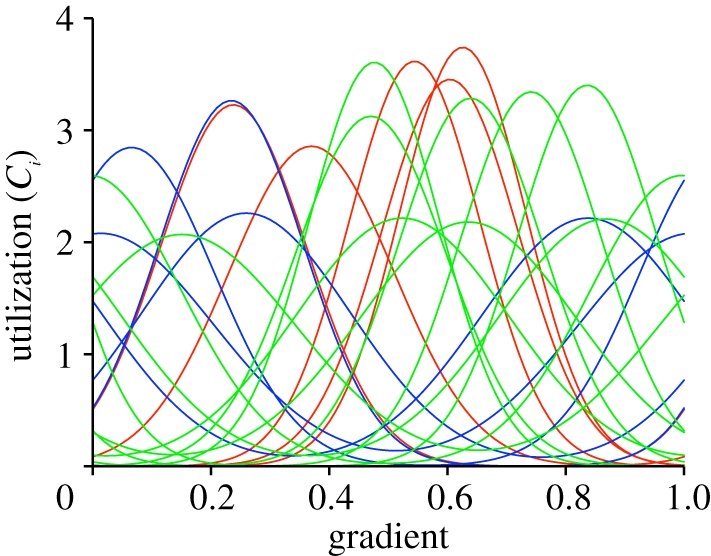
Utilization functions. The 20 curves presented here correspond to the first 20 species used in the simulations in figure 2. Red, species in figure 2a; blue, species in figure 2b; green, species in figures 2c.
In the simulations presented here, I(x) and E(x) were both set as constants along the gradient and through time, and bi and di were the same for all species. Ci(x) was modelled using a Gaussian function (figure 1) with the niche optimum of species i equal to the mean (yi) and the niche width equal to the standard deviation (ωi). A variety of other symmetrical, unimodal utilization functions—truncated Gaussian, parabolic [24], triangular and single-cycle sine curve—were found to produce results comparable with those presented here. In a given simulation, each species's niche optimum was placed randomly along the environmental gradient and its niche width was chosen randomly within a specified range of possible values. The utilization function of each species was defined so that the integral ∫Ci(x)dx equalled one (i.e. all species had equal total consumption efficiency and no species could consume more resource than was actually available). In order to avoid artifactual edge effects resulting from truncation of species' utilization curves, the gradient was made circular [25,26], effectively allowing species to draw upon resources and interact with competitors beyond the ends of the modelled gradient. All simulations were implemented using the LSODE solver [27] in Octave v. 3.2.3 (www.octave.org; code included in the electronic supplementary material); both relative and absolute tolerance parameters were set to the default value of 1.49012 × 10⁻⁸.
3. Results
(a). Competitive accommodation
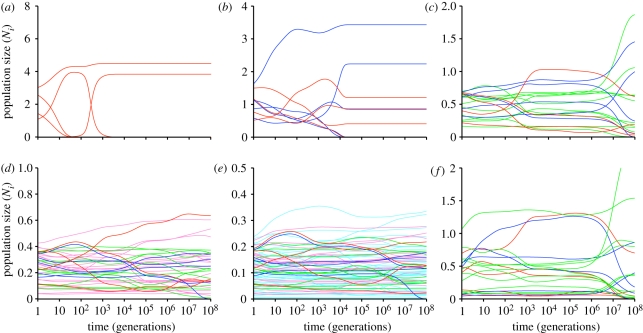
The number and intensity of interspecific interactions along a gradient is measured by packing density (ρ = Sωi/L), which scales the number of direct interactions per species (determined by niche width and total diversity) to the length of the gradient. With low initial packing density, the system rapidly reaches a state of stable coexistence resulting from niche differentiation along the gradient (figure 2; electronic supplementary material, figure S1)—that is, as previous authors have recognized when analysing consumer–resource models with a small number of species, surviving taxa at steady state are spaced out to minimize niche overlap along the gradient [23,28–31]. However, increased initial packing density results in long-duration transient states [32] that accommodate high diversity by delaying competitive exclusion for millions to tens of millions of generations (potentially geological timescales). In the transient state, population trajectories follow slowly shifting, deterministic paths that are sensitive to their initial sizes, but they converge on steady states that are independent of initial values (electronic supplementary material, figure S2). Through most of the transient phase, initially rare species tend to remain at low population levels (figure 3), whereas initially abundant species can remain abundant or decline precipitately.
Figure 2.
The effect of increased species packing (ρ) on species population trajectories through time. Generation time (1/di) equals the time interval between expected births in a population at steady state. Note that time is depicted on a logarithmic axis in order to emphasize population size shifts decreasing through time (electronic supplementary material, figure S1 presents the same results on a linear timescale). Colours correspond to the species added in each subsequent simulation. Niche widths for species in all simulations were distributed uniformly randomly between 0.10 and 0.20 (mean niche width = 0.15). Initial population sizes were assigned uniformly random values. (a) 5 species (ρ = 0.75), (b) 10 species (ρ = 1.5), (c) 20 species (ρ = 3), (d) 40 species (ρ = 6), (e) 80 species (ρ = 12). (f) Same 20 species as shown in (c), but with different initial population sizes. Steady state is reached in simulation (a) at approximately 1200 generations and (b) at approximately 10 500 generations.
Figure 3.
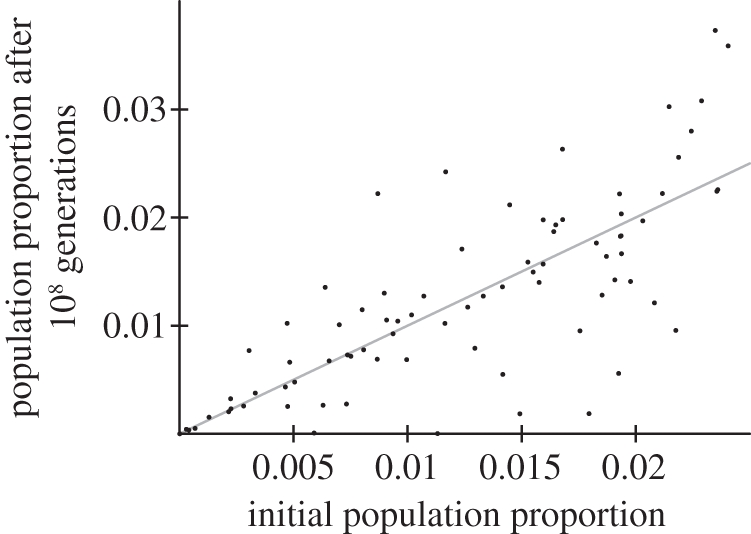
Effect of initial population size on accommodated community state after 108 generations. Grey line indicates population sizes if no change occurred. Note that initially abundant species show greater variation at a later point than initially rare species. Pearson product-moment r = 0.766; number of species = 80. This plot corresponds to the simulation shown in figure 2e.
A stable equilibrium assemblage of competing species minimizes the sum of squared differences from a threshold resource requirement [33] equal to the resource level expected in the presence of one species at its niche optimum, di/bi (equivalent to Tilman's R* [34]). Resource levels in accommodated transient states are consumed to a level very close to this expected threshold (figure 4), suggesting that the diverse initial species pool allows numerous alternative combinations of species that can consume resources at near-optimal levels of efficiency as they approach a steady state.
Figure 4.
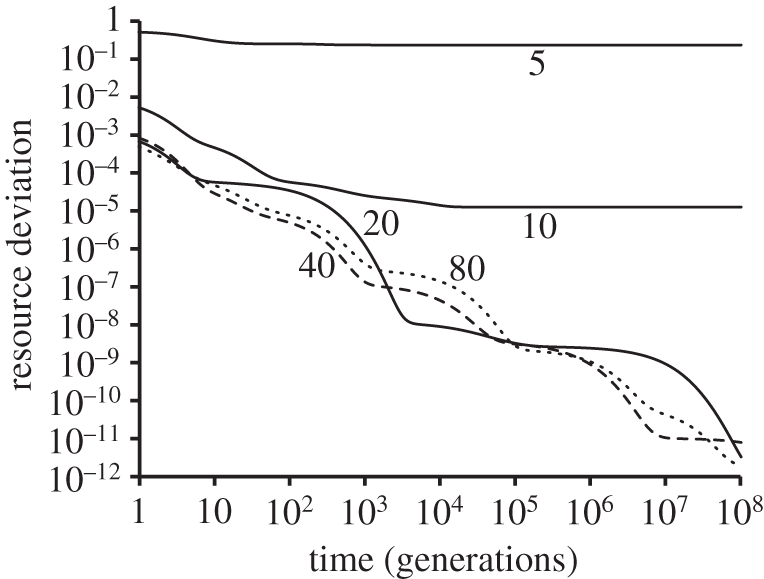
Increased resource utilization efficiency through time for the five simulations shown in figure 2. The y-axis measures the integral of the squared deviation between available resource and the threshold efficiency (di/bi) at every point on the gradient. Note that time is depicted on a logarithmic axis. Numbers correspond to the initial number of species present in each simulation.
(b). Role of competition in structuring model communities
In order to investigate the relative importance of initial population size values versus the strength of competitive interactions in determining the abundance structure of accommodated communities, a simulation using a single set of 80 species was run for 600 million generations, with disruptions every two million generations (figure 5a). This frequency of disruption is comparable with the duration of stable ecological intervals reported in the fossil record [9–12]. If species' interactions are dominant, then the system is expected to return to a similar transient state after each disruption; if initial population sizes are dominant, then the post-disruption state is expected to reflect its post-disruption starting point.
Figure 5.
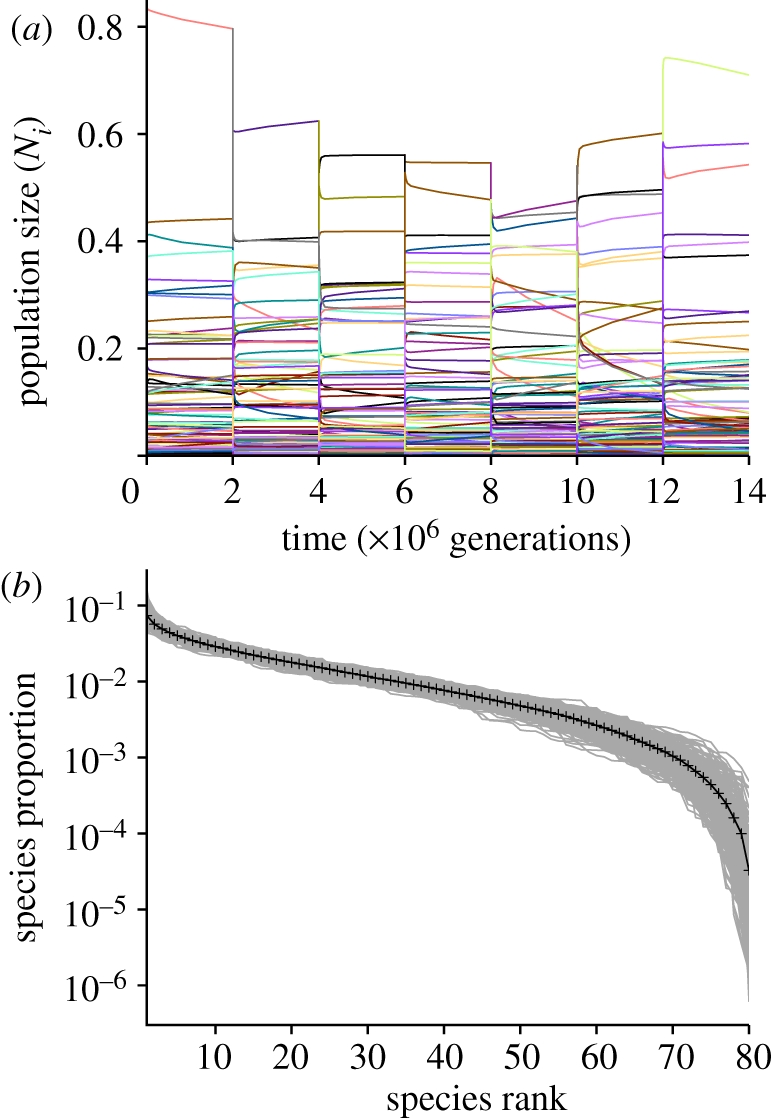
The effect of perturbations on accommodated community states. (a) Seven of 300 perturbations imposed every 2 × 10⁶ generations for 600 × 106 generations. Colours correspond to different species; note that species do not return to pre-perturbation population sizes after each disruption event. Time on the x-axis is linear, unlike figure 2. (b) Average rank abundance distribution after 2 × 10⁶ generations. Black line is mean value of overlapping grey lines corresponding to each accommodated interval. The simulation uses 80 species with niche widths distributed randomly and uniformly between 0.10 and 0.20 (mean niche width = 0.15). The first 10 intervals were discarded because their abundance distributions remained correlated to the initial population size values.
Because the nature and magnitude of disruption to ecological systems can vary from negligible shifts in the population sizes of a few species to mass extinction of a majority of lineages, two end-member types of disruption were explored. Minor disruptions were implemented by reducing all absolute population sizes, but keeping species' relative abundances constant. Under these circumstances, the system was found to rapidly return to and continue pre-disruption accommodated population size trajectories.
Major disruptions were implemented by randomly reassigning population sizes to different species in the pool. Disrupting species' population sizes by complete reorganization is expected to eliminate any degree of autocorrelation in abundances across disruption events. The goal of the simulation presented here is to determine how much change can occur without actually losing incumbent species or gaining new species. Events involving extinction and invasion are clearly important in the real world but essentially represent a community composed of an entirely or partly new suite of species at each disruption, making pre- and post-disruption comparison ambiguous. Random reassignment was used because abundance distributions under transient conditions evolve through time rather than settling into a characteristic equilibrium form; reassignment allowed species' dominance rankings to be shuffled, while preserving the form of the relative abundance distribution between disruption episodes (figure 5b). Little is known about the degree to which disruptions preserve abundance distributions in real examples, which probably varies from case to case.
Species rankings at the end of each two million generation interval following a major disruption show no significant correlation from one accommodated state to another (mean Spearman ρ = 3.50 × 10⁻⁴, s.e. = 5.49 × 10⁻⁴), although population size magnitudes do show a small but significant correlation (mean Pearson r = 7.47 × 10⁻², s.e. = 5.47 × 10⁻⁴; electronic supplementary material, figure S3). In contrast, comparison of initial post-disruption population sizes with their sizes after two million generations shows small but significant correlation of their rankings (mean Spearman ρ = 8.34 × 10⁻², s.e. = 6.83 × 10⁻³) and substantial correlation of their magnitudes (mean Pearson r = 0.92, s.e. = 2.16 × 10⁻³). These results indicate that although transiently accommodated communities are somewhat structured by species interactions, the influence of such processes is much weaker than that of initial population sizes in the simulations presented here.
(c). Invasibility and assembly of model communities
Community assembly is often conceived as a process in which new species successively invade an existing assemblage [35–40]. Successful invasion is contingent upon the invader having niche characteristics that allow it to consume sufficient resources for its population to increase (i.e. dNi/dt > 0) from very small size [13,31]. Invasibility is low in accommodated communities (electronic supplementary material, figure S4) because available resources are low, hindering growth of small populations (figure 3). Low invasibility suggests that the best opportunity for an invader to become numerically significant is to enter the community before resource availability is effectively minimized as the accommodated dynamic becomes established (i.e. during or immediately after disruption).
4. Discussion
(a). Comparison with a fossil example: Permian basin brachiopods
The simulations presented here suggest that high-diversity competitive communities can result in transient states that can last for millions of generations (i.e. geological timescales). Although species abundances are not fixed under such conditions, relative species proportions are quite persistent if undisturbed; if disrupted, they are relatively easy to reorganize into alternative states. Unlike systems in a state of stable coexistence, such communities do not have an inherent limit on diversity and carry an extinction debt [41].
These properties are strongly reminiscent of punctuated community reorganization observed in fossil brachiopod assemblages associated with the Permian Reef (approx. 275.6—260.4 Myr ago) exposed in the Guadalupe and Glass Mountains of west Texas [11,42]. Brachiopods are sessile marine filter-feeders that in this case lived at a depth of several hundred metres and consumed organic matter that was ultimately produced in shallow, photic waters. Multivariate analysis of 511 collections, including 967 species from 190 genera [11], indicates a series of distinct faunal associations in the study interval that coincide with seven independently recognized depositional sequences (i.e. bodies of relatively conformable rock bounded by geological unconformities reflecting significant drops in relative sea level; depositional sequences in this case do not overlap one another temporally [43–46]). Ordinations indicate that species were predominantly organized along linear gradients within each sequence [11], suggesting niche differentiation among taxa. As a crude estimate of niche widths, the mean proportion of the ordinated gradient in each sequence occupied by individual genera ranges from 0.138 to 0.267, producing packing densities comparable with the simulations presented above (electronic supplementary material).
Between 50 and 79 per cent of the genera present in any one sequence span at least five of the seven sequences (electronic supplementary material, figure S4), indicating that the distinctive faunal association characteristic of each sequence was drawn from a largely overlapping pool of lineages [42]. This continuity of lineages contrasts with the iconic case study of punctuated community turnover from the shallow marine Siluro-Devonian Appalachian Basin of New York state and adjacent areas [9]. In that example, species losses between stable intervals typically range from 70 to 90 per cent, with the fauna in each static interval including a high proportion of species seeded from outside the basin. However, extinction levels in the Devonian example are measured at the species level, elevating taxonomic discontinuity between static intervals relative to the genus-level analysis of the Permian Basin brachiopod case, which emphasizes continuity in a lineage of successive related species. In the Permian Basin case, there is evidence that lineages could survive in the basin at very low relative abundances rather than go extinct: based on a dataset from the Glass Mountains [47], 36 of 512 species were represented by a single individual out of a total of 855 047 specimens (i.e. seven per cent of all observed species had a proportion as rare as possible in this enormous sample). In addition, lineages that were very rare or absent in the basin through several sequences have been observed to become dominant in a subsequent sequence [48].
Overall, Permian Basin brachiopods appear to satisfy the main criteria for the emergence of competitive accommodation: a large pool of taxa that were niche-differentiated but had broad niche overlap, and whose primary resource was undifferentiated and provided as a flux independent of the size of brachiopod populations. The fact that fossil assemblages were organized along gradients in each depositional sequence indicates that they were not strictly neutral, and the fact that they did not return to their previous state when disrupted indicates that they do not represent stable equilibria. Accommodated dynamics can explain the remarkably high diversity of brachiopods in the Permian Basin as well as their repeated reorganizations, in this case in response to disruptions associated with basin-wide sea-level fluctuations.
(b). Niches and neutrality in accommodated communities
The consumer–resource model used here produces several results reminiscent of the neutral theory of biodiversity [15]. For example, the slow drift of population sizes through time is superficially similar in both models. However, because the consumer–resource model is continuous and deterministic, whereas the neutral model is discrete (i.e. individual-based) and stochastic, the origin of drift in the two models is fundamentally different. In the neutral model, population sizes drift as individual organisms are stochastically added to or removed from populations of functionally equivalent species [15]. In contrast, apparent drift in accommodated systems is the result of deterministic adjustment of species population sizes as overall resource consumption efficiency increases through time. Accommodation mimics neutrality not by imposing strict functional equivalence of species but rather by allowing ecologically differentiated species to be combined into alternative suites that come very close to being functionally equivalent at any location on the gradient.
In essence, the consumer–resource model with niche-differentiated species predicts the long-term expected trajectories of species' populations in the absence of stochastic processes. Simulating a community in which all species have identical niche optimum and width (i.e. a neutral community) using the consumer–resource model shows no change from species' initial proportions (figure 6), unlike the varying population sizes and extinctions seen in the discrete, stochastic version of the neutral model [15]. An important consequence of examining averages rather than individual-based population histories is that the consumer–resource model almost certainly underestimates the rate of species loss from accommodated communities: although populations in the model can be driven to extinction, they can also get infinitesimally small without actually going extinct. Since stochastic extinction is primarily an issue for species with very low abundance, this suggests that the population trajectories predicted by the consumer–resource model are most relevant for populations that are large in terms of absolute size (i.e. unlikely to go extinct stochastically). Nevertheless, in the simulations presented here, the proportional abundances of rare species neither become infinitesimally small very quickly (figure 5b) nor are they substantially rarer than the rarest species in the Permian brachiopod example (1/855047), suggesting that the lack of a limit on rarity in the model may not be a major concern if the scale of the system being examined is sufficiently large.
Figure 6.
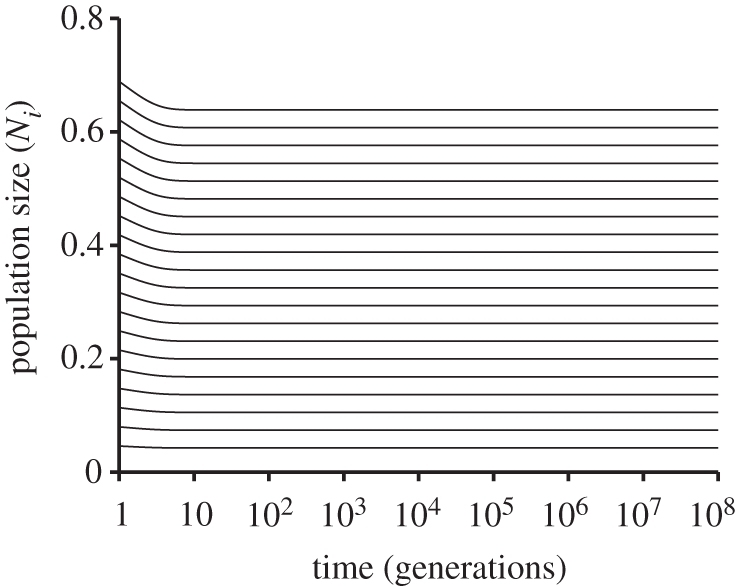
A simulation of twenty species with identical niche optimum and width. In this deterministic formulation of the neutral model, initial species proportions are maintained indefinitely, there is no drift in population sizes, and there are no extinctions due to either competitive exclusion or stochastic drift to zero.
The requirement of high diversity and large absolute population sizes for the emergence of accommodated dynamics suggests that the model is most appropriate for understanding regional species pools rather than small, local communities. In fact, the model presented here corresponds to the expected outcome of a special case of the metacommunity model of Loreau et al. [49], in which consumer–resource equations were used to describe competitive interactions in discrete local patches. If patches are numerous and connected by unconstrained dispersal, the dispersal advantage for species with high metacommunity abundance can counteract the advantage of superior competitors in local communities, potentially leading to a long approach to a final steady state. Determining whether long-term transients can emerge in spatially explicit metacommunity models [49–52] will require further modelling studies.
(c). Evolutionary implications
In addition to incorporating population stochasticity, the neutral model also incorporates the origination of new species. In fact, without replacement of extinct species, the neutral model will collapse to a final state in which all species but one have been lost. (Analogously, the consumer–resource model also loses species in its final state, but more than one can stably coexist by partitioning the gradient [23,30,31].)
The results presented here suggest that large, high-diversity ecological systems can persist in a competitively accommodated state for durations approaching or exceeding the evolutionary lifetime of many species. Without explicitly incorporating evolution in species' niche properties [25,53,54], it is not clear whether lineages would show strong directional or stabilizing selection owing to intense competition in an accommodated system, nor whether they would undergo random walks in an effectively uniform competitive environment. In addition to anagenetic change within lineages, the opportunity for the cladogenetic origin and establishment of new species in accommodated communities is not clear: such regimes are not welcoming to invaders, whether these originate within the community or elsewhere, but accommodated systems do have the potential to allow initially rare new species to persist at very low population levels (figure 3). Although the model presented here does not incorporate evolution, extending existing individual-based models of evolution both within populations and among a network of interacting species to include resource-based competition suggests a fruitful direction for future research [55–58].
In addition to the evolution of individual lineages, long-duration accommodation has potential macroevolutionary implications. The rock record indicates that environmental perturbations at a wide variety of scales (regional, continental and global) were common in the geological past. Although these are stereotypically associated with mass extinctions [59], many show biological response through changes in ecology, behaviour or biogeographic distribution rather than wholesale loss of lineages [60]. Recurrent perturbations of systems in an accommodated state below the threshold for mass extinction could act to enhance long-term diversity by resetting the system and giving ultimately unviable species a reprieve from being driven to extinction by competition (i.e. putting off payment of the accommodated community's extinction debt [41]).
5. Conclusions
The model presented here suggests that high-diversity competitive communities can persist for millions of generations outside a state of stable coexistence. Under these conditions, high levels of diversity appear to inherently promote their own persistence. Population sizes in such accommodated systems are highly sensitive to their initial proportions and can be substantially reorganized when perturbed. Although this dynamic is certainly not universally applicable, a pattern of long-term ecological persistence punctuated by episodic reorganization in the fossil record is consistent with accommodation dynamics. Modern high-diversity communities may also be examples of systems in an accommodated state. If so, they may react to present-day stresses in a manner analogous to examples from the Earth's past, implying that such systems may have very good potential to recover from present-day damage as long as lineages are not driven to terminal extinction, but that recovered states could be quite different in species composition, despite being functionally comparable, to their pre-disturbance state.
Acknowledgements
Thanks to George Jackson for comments on an earlier version of this paper. This research was in part supported by grant no. 46096-G8 from the American Chemical Society Petroleum Research Fund (ACS-PRF) to T.D.O.
References
- 1.Kidwell S. M., Flessa K. W. 1996. The quality of the fossil record: populations, species, and communities. Annu. Rev. Earth Planetary Sci. 24, 433–464 10.1146/annurev.earth.24.1.433 (doi:10.1146/annurev.earth.24.1.433) [DOI] [Google Scholar]
- 2.Kidwell S. M. 2001. Preservation of species abundance in marine death assemblages. Science 294, 1091–1094 10.1126/science.1064539 (doi:10.1126/science.1064539) [DOI] [PubMed] [Google Scholar]
- 3.Kidwell S. M., Holland S. M. 2002. The quality of the fossil record: implications for evolutionary analyses. Annu. Rev. Ecol. Syst. 33, 561–588 10.1146/annurev.ecolsys.33.030602.152151 (doi:10.1146/annurev.ecolsys.33.030602.152151) [DOI] [Google Scholar]
- 4.Clark J. S., MacLachlan J. S. 2003. Stability of forest biodiversity. Nature 423, 635–638 10.1038/nature01632 (doi:10.1038/nature01632) [DOI] [PubMed] [Google Scholar]
- 5.McGill B. J., Hadly E. A., Maurer B. A. 2005. Community inertia of quaternary small mammal assemblages in North America. Proc. Natl Acad. Sci. USA 102, 16 701–16 706 10.1073/pnas.0504225102 (doi:10.1073/pnas.0504225102) [DOI] [PMC free article] [PubMed] [Google Scholar]
- 6.Williams J. W., Jackson S. T. 2007. Novel climates, no-analog communities, and ecological surprises. Front. Ecol. Environ. 5, 475–482 10.1890/070037 (doi:10.1890/070037) [DOI] [Google Scholar]
- 7.Pandolfi J. M., Jackson J. B. C. 2006. Ecological persistence interrupted in Caribbean coral reefs. Ecol. Lett. 9, 818–826 10.1111/j.1461-0248.2006.00933.x (doi:10.1111/j.1461-0248.2006.00933.x) [DOI] [PubMed] [Google Scholar]
- 8.Ivany L. C., Brett C. E., Wall H. L. B., Wall P. D., Handley J. C. 2009. Relative taxonomic and ecologic stability in Devonian marine faunas of New York State: a test of coordinated stasis. Paleobiology 35, 499–524 10.1666/0094-8373-35.4.499 (doi:10.1666/0094-8373-35.4.499) [DOI] [Google Scholar]
- 9.Brett C. E., Baird G. C. 1995. Coordinated stasis and evolutionary ecology of Silurian to Middle Devonian faunas in the Appalachian Basin. In New approaches to speciation in the fossil record (eds Erwin D. H., Anstey R. L.), pp. 285–315 New York, NY: Columbia University Press [Google Scholar]
- 10.DiMichele W. A., Behrensmeyer A. K., Olszewski T. D., Labandiera C. C., Pandolfi J. M., Wing S. L., Bobe R. 2004. Long-term stasis in ecological assemblages: evidence from the fossil record. Annu. Rev. Ecol. Evol. Syst. 35, 285–322 10.1146/annurev.ecolsys.35.120202.110110 (doi:10.1146/annurev.ecolsys.35.120202.110110) [DOI] [Google Scholar]
- 11.Olszewski T. D., Erwin D. H. 2009. Change and stability in Permian brachiopod communities from western Texas. Palaios 24, 27–40 10.2110/palo.2008.p08-061r (doi:10.2110/palo.2008.p08-061r) [DOI] [Google Scholar]
- 12.Brett C. E., Ivany L. C., Schopf K. M. 1996. Coordinated stasis: an overview. Palaeogeogr. Palaeocl. 127, 1–20 10.1016/S0031-0182(96)00085-5 (doi:10.1016/S0031-0182(96)00085-5) [DOI] [Google Scholar]
- 13.Chesson P. 2000. Mechanisms of maintenance of species diversity. Annu. Rev. Ecol. Syst. 31, 343–366 10.1146/annurev.ecolsys.31.1.343 (doi:10.1146/annurev.ecolsys.31.1.343) [DOI] [Google Scholar]
- 14.Siepelski A. M., McPeek M. A. 2010. On the evidence for species coexistence: a critique of the coexistence program. Ecology 91, 3153–3164 10.1890/10-0154.1 (doi:10.1890/10-0154.1) [DOI] [PubMed] [Google Scholar]
- 15.Hubbell S. P. 2001. The unified neutral theory of biodiversity and biogeography. Princeton, NJ: Princeton University Press [Google Scholar]
- 16.McGill B. J. 2003. A test of the unified neutral theory of biodiversity. Nature 422, 881–885 10.1038/nature01583 (doi:10.1038/nature01583) [DOI] [PubMed] [Google Scholar]
- 17.Chave J. 2004. Neutral theory and community ecology. Ecol. Lett. 7, 241–253 10.1111/j.1461-0248.2003.00566.x (doi:10.1111/j.1461-0248.2003.00566.x) [DOI] [Google Scholar]
- 18.Bell G., Lechowicz M. J., Waterway M. J. 2006. The comparative evidence relating to functional and neutral interpretations of biological communities. Ecology 87, 1378–1386 10.1890/0012-9658(2006)87[1378:TCERTF]2.0.CO;2 (doi:10.1890/0012-9658(2006)87[1378:TCERTF]2.0.CO;2) [DOI] [PubMed] [Google Scholar]
- 19.McGill B. J., Maurer B. A., Weiser M. D. 2006. Empirical evaluation of neutral theory. Ecology 87, 1411–1423 10.1890/0012-9658(2006)87[1411:EEONT]2.0.CO;2 (doi:10.1890/0012-9658(2006)87[1411:EEONT]2.0.CO;2) [DOI] [PubMed] [Google Scholar]
- 20.MacArthur R. H. 1972. Geographical ecology: patterns in the distribution of species. Princeton, NJ: Princeton University Press [Google Scholar]
- 21.Chesson P. 1990. MacArthur's consumer–resource model. Theoret. Popul. Biol. 37, 26–38 10.1016/0040-5809(90)90025-Q (doi:10.1016/0040-5809(90)90025-Q) [DOI] [Google Scholar]
- 22.Haygood R. 2002. Coexistence in MacArthur-style consumer–resource models. Theoret. Popul. Biol. 61, 215–223 10.1006/tpbi.2001.1566 (doi:10.1006/tpbi.2001.1566) [DOI] [PubMed] [Google Scholar]
- 23.Abrams P. A., Rueffler C. 2009. Coexistence and limiting similarity of consumer species competing for a linear array of resources. Ecology 90, 812–822 10.1890/08-0446.1 (doi:10.1890/08-0446.1) [DOI] [PubMed] [Google Scholar]
- 24.Abrams P. A., Rueffler C., Dinnage R. 2008. Competition–similarity relationships and the nonlinearity of competitive effects in consumer–resource systems. Am. Nat. 172, 463–474 10.1086/590963 (doi:10.1086/590963) [DOI] [PubMed] [Google Scholar]
- 25.Scheffer M., van Nes E. H. 2006. Self-organized similarity, the evolutionary emergence of groups of similar species. Proc. Natl Acad. Sci. USA 103, 6230–6235 10.1073/pnas.0508024103 (doi:10.1073/pnas.0508024103) [DOI] [PMC free article] [PubMed] [Google Scholar]
- 26.Pigolotti S., Lopez C., Hernandez-Garcia E. 2007. Species clustering in competitive Lotka–Volterra models. Phys. Rev. Lett. 98, 258101-1–258101-4 10.1103/PhysRevLett.98.258101 (doi:10.1103/PhysRevLett.98.258101) [DOI] [PubMed] [Google Scholar]
- 27.Radhakrishnan K., Hindmarsh A. C. 1993. Description and use of LSODE, the Livermore solver for ordinary differential equations. Livermore, CA: Lawrence Livermore National Laboratory. Report UCRL-ID-113855
- 28.May R. M., MacArthur R. H. 1972. Niche overlap as a function of environmental variability. Proc. Natl Acad. Sci. USA 69, 1109–1113 10.1073/pnas.69.5.1109 (doi:10.1073/pnas.69.5.1109) [DOI] [PMC free article] [PubMed] [Google Scholar]
- 29.May R. M. 1974. On the theory of niche overlap. Theoret. Popul. Biol. 5, 297–332 10.1016/0040-5809(74)90055-0 (doi:10.1016/0040-5809(74)90055-0) [DOI] [PubMed] [Google Scholar]
- 30.MacArthur R. M. 1970. Species packing and competitive equilibrium for many species. Theoret. Popul. Biol. 1, 1–11 10.1016/0040-5809(70)90039-0 (doi:10.1016/0040-5809(70)90039-0) [DOI] [PubMed] [Google Scholar]
- 31.MacArthur R., Levins R. 1967. The limiting similarity, convergence, and divergence of coexisting species. Am. Nat. 101, 377–385 10.1086/282505 (doi:10.1086/282505) [DOI] [Google Scholar]
- 32.Hastings A. 2004. Transients: the key to long-term ecological understanding? Trends Ecol. Evol. 19, 39–45 10.1016/j.tree.2003.09.007 (doi:10.1016/j.tree.2003.09.007) [DOI] [PubMed] [Google Scholar]
- 33.MacArthur R. 1969. Species packing, and what interspecies competition minimizes. Proc. Natl Acad. Sci. USA 64, 1369–1371 10.1073/pnas.64.4.1369 (doi:10.1073/pnas.64.4.1369) [DOI] [PMC free article] [PubMed] [Google Scholar]
- 34.Tilman D. 1982. Resource competition and community structure. Princeton, NJ: Princeton University Press; [PubMed] [Google Scholar]
- 35.Post W. M., Pimm S. L. 1983. Community assembly and food web stability. Math. Biosci. 64, 169–192 10.1016/0025-5564(83)90002-0 (doi:10.1016/0025-5564(83)90002-0) [DOI] [Google Scholar]
- 36.Drake J. A. 1988. Models of community assembly and the structure of ecological landscapes. In Mathematical ecology (eds Hallam T., Gross L., Levin S.), pp. 584–604 Singapore: World Press [Google Scholar]
- 37.Drake J. A. 1990. The mechanics of community assembly and succession. J. Theoret. Biol. 147, 213–233 10.1016/S0022-5193(05)80053-0 (doi:10.1016/S0022-5193(05)80053-0) [DOI] [Google Scholar]
- 38.Law R., Morton R. D. 1996. Permanence and the assembly of ecological communities. Ecology 77, 762–775 10.2307/2265500 (doi:10.2307/2265500) [DOI] [Google Scholar]
- 39.Morton R. D., Law R., Pimm S. L., Drake J. A. 1996. On models for assembling ecological communities. Oikos 75, 493–499 10.2307/3545891 (doi:10.2307/3545891) [DOI] [Google Scholar]
- 40.Tilman D. 2004. Niche tradeoffs, neutrality, and community structure: a stochastic theory of resource competition, invasion, and community assembly. Proc. Natl Acad. Sci. USA 101, 10 854–10 861 10.1073/pnas.0403458101 (doi:10.1073/pnas.0403458101) [DOI] [PMC free article] [PubMed] [Google Scholar]
- 41.Tilman D., May R. M., Lehman C. L., Nowak M. A. 1994. Habitat destruction and the extinction debt. Nature 371, 65–66 10.1038/371065a0 (doi:10.1038/371065a0) [DOI] [Google Scholar]
- 42.Cooper G. A., Grant R. E. 1977. Permian brachiopods of west Texas, pt. VI. Washington, DC: Smithsonian Institution Press [Google Scholar]
- 43.Tinker S. W. 1998. Shelf-to-basin facies distributions and sequence stratigraphy of a steep-rimmed carbonate margin: Capitan depositional system, McKittrick Canyon, New Mexico and Texas. J. Sediment. Res. 68, 1146–1174 [Google Scholar]
- 44.Kerans C., Tinker S. 1999. Extrinsic stratigraphic controls on development of the Capitan reef complex. In Geologic framework of the Capitan reef (eds Saller A. H., Harris P. M., Kirkland B. L., Mazullo S. H.), pp. 15–36 Tulsa, OK: SEPM Special Publication [Google Scholar]
- 45.Kerans C., Kempter K. 2002. Hierarchical stratigraphic analysis of a carbonate platform: Permian of the Guadalupe Mountains. Tulsa, OK: AAPG Datapages. Discovery Series 5, CD-ROM and color plate
- 46.Rush J., Kerans C. 2010. Stratigraphic response across a structurally dynamic shelf: the latest Guadalupian composite sequence at Walnut Canyon, New Mexico, USA. J. Sediment. Res. 80, 808–828 10.2110/jsr.2010.073 (doi:10.2110/jsr.2010.073) [DOI] [Google Scholar]
- 47.Olszewski T. D., Erwin D. H. 2004. Dynamic response of Permian brachiopod communities to long-term environmental change. Nature 428, 738–741 10.1038/nature02464 (doi:10.1038/nature02464) [DOI] [PubMed] [Google Scholar]
- 48.Fall L. M., Olszewski T. D., Moore J. R. Submitted Reorganization of Middle Permian brachiopod paleocommunities in response to environmental perturbation. [Google Scholar]
- 49.Loreau M., Mouquet N., Gonzalez A. 2003. Biodiversity as spatial insurance in heterogeneous landscapes. Proc. Natl Acad. Sci. USA 100, 12 765–12 770 10.1073/pnas.2235465100 (doi:10.1073/pnas.2235465100) [DOI] [PMC free article] [PubMed] [Google Scholar]
- 50.Chesson P. L., Warner R. R. 1981. Environmental variability promotes coexistence in lottery competitive systems. Am. Nat. 117, 923–943 10.1086/283778 (doi:10.1086/283778) [DOI] [Google Scholar]
- 51.Hurtt G. C., Pacala S. W. 1995. The consequences of recruitment limitation: reconciling chance, history and competitive differences between plants. J. Theoret. Biol. 176, 1–12 10.1006/jtbi.1995.0170 (doi:10.1006/jtbi.1995.0170) [DOI] [Google Scholar]
- 52.Gravel D., Mouquet N., Loreau M., Guichard F. 2010. Patch dynamics, persistence, and species coexistence in metaecosystems. Am. Nat. 176, 289–302 10.1086/655426 (doi:10.1086/655426) [DOI] [PubMed] [Google Scholar]
- 53.Hubbell S. P. 2006. Neutral theory and the evolution of ecological equivalence. Ecology 87, 1387–1398 10.1890/0012-9658(2006)87[1387:NTATEO]2.0.CO;2 (doi:10.1890/0012-9658(2006)87[1387:NTATEO]2.0.CO;2) [DOI] [PubMed] [Google Scholar]
- 54.McPeek M. A. 2007. The macroevolutionary consequences of ecological differences among species. Palaeontology 50, 111–129 10.1111/j.1475-4983.2006.00616.x (doi:10.1111/j.1475-4983.2006.00616.x) [DOI] [Google Scholar]
- 55.Doebeli M., Dieckmann U. 2003. Speciation along environmental gradients. Nature 421, 259–264 10.1038/nature01274 (doi:10.1038/nature01274) [DOI] [PubMed] [Google Scholar]
- 56.Dieckmann U., Doebeli M. 1999. On the origin of species by sympatric speciation. Nature 400, 354–357 10.1038/22521 (doi:10.1038/22521) [DOI] [PubMed] [Google Scholar]
- 57.Laird S., Jensen H. J. 2006. The tangled nature model with inheritance and constraint: evolutionary ecology restricted by a conserved resource. Ecol. Complex 3, 253–262 10.1016/j.ecocom.2006.06.001 (doi:10.1016/j.ecocom.2006.06.001) [DOI] [Google Scholar]
- 58.Christiansen K., di Collobiano S. A., Hall M., Jensen H. J. 2002. Tangled nature: a model of evolutionary ecology. J. Theoret. Biol. 216, 73–84 10.1006/jtbi.2002.2530 (doi:10.1006/jtbi.2002.2530) [DOI] [PubMed] [Google Scholar]
- 59.Erwin D. H. 2006. Extinction: how life on earth nearly ended 250 million years ago. Princeton, NJ: Princeton University Press [Google Scholar]
- 60.Prothero D. R. 1999. Does climatic change drive mammalian evolution? GSA Today 9, 2–7 [Google Scholar]


