

Abstract
The schooling behaviour of fish is of great biological importance, playing a crucial role in the foraging and predator avoidance of numerous species. The extent to which physiological performance traits affect the spatial positioning of individual fish within schools is completely unknown. Schools of juvenile mullet Liza aurata were filmed at three swim speeds in a swim tunnel, with one focal fish from each school then also measured for standard metabolic rate (SMR), maximal metabolic rate (MMR), aerobic scope (AS) and maximum aerobic swim speed. At faster speeds, fish with lower MMR and AS swam near the rear of schools. These trailing fish required fewer tail beats to swim at the same speed as individuals at the front of schools, indicating that posterior positions provide hydrodynamic benefits that reduce swimming costs. Conversely, fish with high aerobic capacity can withstand increased drag at the leading edge of schools, where they could maximize food intake while possibly retaining sufficient AS for other physiological functions. SMR was never related to position, suggesting that high maintenance costs do not necessarily motivate individuals to occupy frontal positions. In the wild, shifting of individuals to optimal spatial positions during changing conditions could influence structure or movement of entire schools.
Keywords: ecophysiology, group behaviour, trade-offs, metabolic rate
1. Introduction
A school is a social aggregation of fish, swimming in the same direction and maintaining near-constant spacing relative to neighbouring conspecifics [1]. While schooling can provide significant advantages to individual fish in terms of both predator avoidance [2] and foraging success [3], the exact benefits gained by school members depend on spatial location within the school [4–7].
The extent to which inter-individual variation in physiological traits might influence positioning of fish in schools has not been investigated. Metabolic rate has been shown to display consistent inter-individual variation in numerous animal taxa, including fishes [8,9], and could influence school position. In fish, standard metabolic rate (SMR)—measured in post-absorptive, undisturbed animals—reflects baseline energy demand at a given temperature [10]. It is known that hungry fish occupy the front portion of schools [7,11], where they have increased access to food. Similarly, individuals with high SMR may require increased food intake, thus motivating them to spend more time near the front of schools. They may also be more willing to accept the increased risk of predation at the front of schools [6], because there appears to be a link between SMR and boldness [12,13]. By contrast, individuals with lower SMR may be more tolerant of reduced food intake, allowing them to spend more time near the middle or rear of the school for increased protection and reduced swimming costs.
Inter-individual differences in aerobic capacity could also be important for determining the position of individuals within schools. Both maximal metabolic rate (MMR) and aerobic scope (AS) are related to aerobic capacity: MMR is the maximal rate of aerobic metabolism attainable by an individual, while AS is the difference between MMR and SMR, and represents the overall capacity for oxygen supply to tissues, and ATP production, for use in all oxygen-consuming physiological functions within an organism at a given time [10]. In particular, AS is believed to influence a number of ecological phenomena, including environmental effects on behaviour [14,15] and the geographical distributions of species [16]. Animals moving in coordinated groups, such as birds flying in formation [17] or humans riding bicycles in a peloton [18], are often found to have reduced energetic costs of locomotion owing to various mechanisms allowing individuals to exploit areas of reduced drag created by more forward individuals. Fish in schools have also been shown to experience a hydrodynamic advantage [19], as trailing fish require fewer tail beats to propel themselves at the same speed as anterior fish [5,20], probably by using vortices produced by individuals ahead of them, to either reduce drag or generate lift [19,21]. Fish with increased MMR, AS or swimming ability could be more able to exploit frontal school positions for increased access to food, while those with a decreased capacity may occupy posterior school positions to take advantage of hydrodynamic benefits. In addition, individuals with increased AS may be more able to swim near the front of schools while simultaneously performing other physiological processes such as digestion. Therefore, despite the potential influence of SMR on feeding motivation and boldness, aerobic capacity could be a greater determinant of position for individuals within fish schools.
This study examined the effects of baseline metabolic demand and aerobic capacity on the position of individual fish within schools swimming at different speeds. The swimming speed of schools varies in response to food availability, threat of predation or variable currents [11,22,23], and could alter the costs and benefits of specific positions within a school on a moment-to-moment basis. The shuffling of individuals as they attempt to find their new optimal position could affect the behaviour of the school as a whole [24], thus linking individual physiology to the complex behaviour of animal groups, especially in response to changing environmental conditions. It was predicted that SMR would be influential in determining the position of individuals at slow swim speeds, but that MMR, AS and aerobic swimming ability would have a greater effect on individual position at faster swim speeds.
2. Material and methods
(a). Animals
Juvenile golden grey mullet Liza aurata inhabit coastal regions and saltwater lagoons throughout the western Mediterranean Sea. They exhibit strong schooling behaviour, which may provide protection from the piscine, avian and cephalopod predators that are common in these habitats.
Approximately 200 juvenile mullet were captured by seine nets from coastal waters of the Mediterranean Sea near Sète, France (43°24′19″ N 3°41′51″ E). Fish were transported to the laboratory and stocked under a natural photoperiod (12 L : 12 D cycle) in large tanks (100 cm L × 100 cm W × 60 H) supplied with recirculating, filtered natural sea water at 20 ± 0.5°C for at least four weeks prior to use in experiments. Fish were fed every second day with a commercial feed (Aphytec, Mèze, France), but were fasted for 36 h before use in experiments.
(b). Schooling behaviour
The schooling behaviour of fish was tested in a 30 l Steffensen-type swim tunnel (Loligo systems, Tjele, Denmark), designed to exercise fish at controlled speeds in non-turbulent water with a uniform velocity profile, thermoregulated at 20 ± 0.5°C [25]. The rectangular working section of the tunnel was 55 cm in length, 14 cm in width and 14 cm in height.
The preferred position of a focal fish within a school was tested by placing the individual into a school within the swim tunnel with seven other juvenile mullet of similar size randomly selected from the holding tanks (wet mass of focal fish = 13.45 ± 0.89 g, total length = 12.03 ± 0.24 cm; wet mass of ‘companion’ fish = 13.40 ± 0.36 g, total length = 12.02 ± 0.11 cm). This was repeated for 20 focal fish for a total of 20 schools, with eight different fish in each. In the wild, golden grey mullet can be found in schools of hundreds or thousands of individuals, but can also be observed in small groups similar to that used in the current study. All fish were weighed, measured for length, width and height, and marked for identification with different patterns of non-soluble, non-toxic white powder (titanium (IV) oxide) bonded to their dorsal surface (anterior to the dorsal fin) with a thin film of adhesive (VetBond 3M Tissue Adhesive). After 5 h acclimation to the tunnel, swimming at 10 cm s−1, the school was filmed from above (Sony Mini DV camera at 25 frames s−1) for 20 min at each of three speeds: 10, 20 and 30 cm s−1. Current speeds were gradually increased at each increment over 5 min, and the school was allowed 1 h to adjust in between speed increments. These current speeds are within the range experienced by juvenile mullet in the wild and were slow enough that all fish performed steady-state aerobic swimming during the schooling trials [26,27].
Videos were analysed to estimate the time each focal fish spent at each rank position in the school. Videos were paused every 5 s and the position of the focal fish was recorded relative to the front of the school, based on the position of the tip of its snout (position 1 = front of school, position 8 = rear of school; figure 1). This provided 240 observations for each focal fish at each speed (12 observations min−1 × 20 min). The mean position of the focal fish was calculated as the average of these 240 observations.
Figure 1.

Top view of swim tunnel during tests of schooling behaviour in juvenile golden grey mullet. Fish were ranked according to the position of the tip of the snout in relation to the front of the school. Rankings in this theoretical example are indicated by numbers to the right of each fish.
Tail beat frequency (fT) for focal fish was measured by frame-by-frame analysis of videos. This was done for the most anterior and posterior positions that each occupied at each speed, with five measures at each position. These ‘extreme’ positions were analysed to encompass the range of fT exhibited by each fish. The mean values of the five measures were taken as the fT at that specific position and speed. When possible, fT in the most posterior position was measured when the focal fish was trailing behind other school members, as described by Svendsen et al. [5].
(c). Standard and maximal metabolic rates
Individual SMR was estimated by respirometry as rate of oxygen uptake [28,29]. Fish were left undisturbed in respirometers for 3 days, during which oxygen uptake was measured as described previously [30]. The absolute SMR (in mg O2 kg−1 h−1) was estimated as the lowest 10th percentile of all measurements within the last 48 h of respirometer confinement [31].
Following measurement of SMR, MMR was determined after exhaustive exercise from the individual swim speed test described in §2d. After this test, fish were rapidly returned to the respirometer and the first rate of oxygen consumption measured was taken as MMR [9,32]. The AS was calculated as MMR minus SMR.
(d). Aerobic swimming ability
Following measurement of SMR, the maximum aerobic swim speed of each focal fish was measured individually in the swim tunnel by gradually increasing the speed at a constant rate of 10 cm s−1 min−1 [33]. A Sony Mini DV camera (25 frames s−1) recorded fish swimming patterns from above, to identify the gait transition speed (Ugt) between steady aerobic swimming with slow-twitch oxidative muscle fibres, characterized by a constant tail beat frequency at a given swimming speed, and non-steady ‘burst-and-coast swimming’, a gait that involves recruitment of anaerobic fast-twitch glycolytic fibres [9,26]. The Ugt was considered the maximum aerobic swim speed [9]. The current speed was increased past Ugt until the fish fell back to the retaining grid at the posterior end of the tunnel and did not resume swimming for 5 s.
(e). Data and statistical analyses
Statistics were performed with SPSS v. 17.0 (SPSS Inc. and IBM), and significance attributed at α = 0.05. For parametric tests, normality, linearity and homogeneity of residuals were verified by inspection of residual-fit plots.
Consistency of positioning among speeds was assessed by linear least-squares regression. The effects of SMR, MMR, AS, Ugt and swim speed on mean position were first analysed using linear mixed models, with subject animal as a random factor, SMR, MMR, AS or Ugt as continuous variables, and speed (10, 20 or 30 cm−1) as a categorical variable. These models produced significant interactions between some independent variables (MMR and AS) and speed (p < 0.05), and so separate linear least-squares regression models were performed for measurements at each speed, with mean position as the dependent variable, and SMR, MMR, AS and Ugt as independent variables. Effects of SMR, MMR, AS and Ugt on the magnitude of change in mean position for individual fish, among speeds, were examined using linear least-squares regression. Effects of SMR, MMR, AS and Ugt on the standard deviation of position occupied were examined using linear least-squares regression.
Effects on fT of current speed, total length, position and whether a fish was trailing directly behind another fish were first analysed using linear mixed models with subject animal as a random factor, total length and position as continuous variables, and speed and whether the fish was trailing as categorical variables. These models produced significant interactions between total length and swim speed (p < 0.05), so separate linear mixed models were performed for each speed, with tail beats as the dependent variable, subject animal as a random factor, total length and position as continuous variables, and whether the fish was trailing as a categorical variable.
Effects of fish size and shape on mean position in schools were assessed with linear mixed models, with subject animal as a random factor, body mass, total length or cross-sectional area as a continuous variable, and speed (10, 20 or 30 cm s−1) as a categorical variable.
3. Results
Although the mean position of most fish remained relatively consistent as speeds increased from 10 to 20 and then 30 cm s−1 (expressed with linear regression slopes of 0.45 and 0.47, respectively; figures 2a,b and 3), some individuals showed marked changes in mean position as speed increased. Mean position was more consistent between 20 and 30 cm s−1 (slope increased to 0.99; figure 2c).
Figure 2.
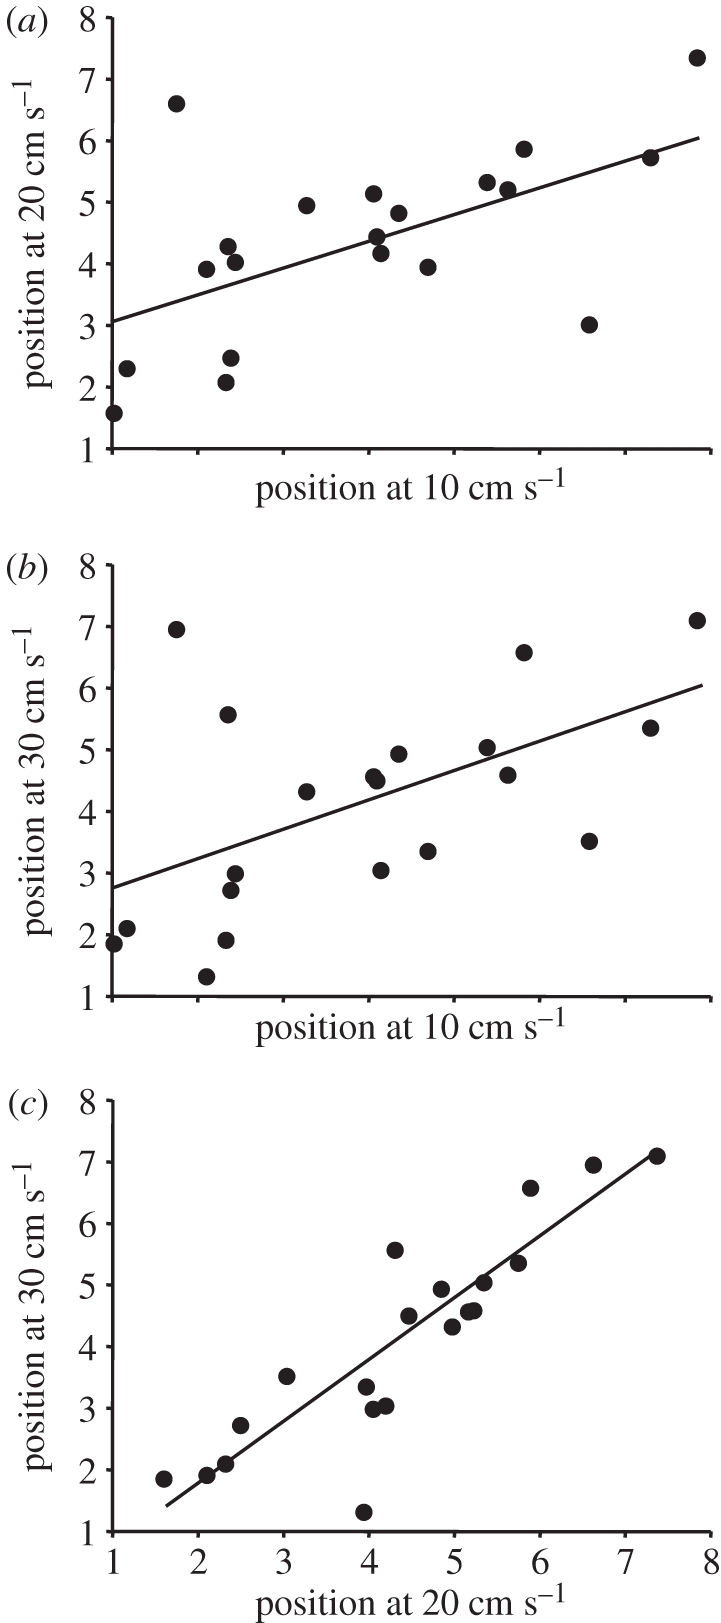
Relationships among mean positions of focal fish in schools of juvenile golden grey mullet swimming at 10, 20 and 30 cm s−1. Each point represents the mean position of a focal fish within a given school (n = 20; position 1 = front of school, 8 = rear of school). Regressions are as follows: (a) y = 2.61 + 0.45x, r2 = 0.356, p = 0.005, 95% CI for slope: 0.151–0.750; (b) y = 2.27 + 0.47x, r2 = 0.311, p = 0.011, 95% CI for slope: 0.125–0.824; (c) y = −0.22 + 0.99x, r2 = 0.78, p < 0.0001, 95% CI for slope: 0.732–1.258.
Figure 3.

Example frequency distributions of observations at each position within schools of juvenile golden grey mullet swimming at 10 cm s−1(white bars), 20 cm s−1(grey bars) or 30 cm s−1 (black bars). Position 1 = front of school, 8 = rear of school. (a) A fish with preference for anterior positioning (fish 1); (b) a fish with preference for posterior positioning (fish 14); (c) a fish that moved to more posterior positions as speed increased (fish 15); (d) a fish that moved to more anterior positions as speed increased (fish 9); (e) a fish displaying a moderate amount of variation around a central mean at each speed (fish 17); (f) a fish displaying a large amount of variation around central means at each speed (fish 20).
Body mass, total length and cross-sectional area of focal fish had no effect on mean position at any speed (linear mixed models, p > 0.05 in all cases).
Effects of MMR and AS on mean position varied among speeds (linear mixed models, significant interaction term, p < 0.05). At both 20 and 30 cm s−1, fish with higher MMR and AS tended to have lower mean positions: they spent more time near the front of the school (figure 4a,b). At 10 cm s−1, there was no correlation between mean position and MMR or AS. At 30 cm s−1, fish with higher Ugt tended to have lower mean positions (figure 4c). Mean position was not correlated with SMR at any speed (figure 4d). At a given speed, there were large differences among fish with regard to variation in position occupied around the mean value (figure 3). The standard deviation of positions occupied was not correlated with SMR, MMR, AS or Ugt (linear least-squares regression, p > 0.05).
Figure 4.

Relationships between mean school position and (a) maximal metabolic rate (MMR), (b) aerobic scope (AS), (c) maximum aerobic swimming ability (Ugt) and (d) standard metabolic rate (SMR). Each point represents the mean position of a focal fish within a given school (n = 20). Crosses = 10 cm s−1 current speed; open circles = 20 cm s−1; filled circles = 30 cm s−1. Dashed lines = 20 cm s−1, solid lines = 30 cm s−1. Linear least-squares regression equations are as follows: (a) 20 cm s−1: mean position = 7.36–0.004(MMR), r2 = 0.22, p = 0.037; 30 cm s−1: mean position = 8.67–0.007(MMR), r2 = 0.40, p = 0.003; (b) 20 cm s−1: mean position = 7.01–0.006(AS), r2 = 0.32, p = 0.01; 30 cm s−1: mean position = 7.62–0.007(AS), r2 = 0.44, p = 0.002; (c) 20 cm s−1: no significant relationship; 30 cm s−1: mean position = 6.61–0.035(Ugt), r2 = 0.20, p = 0.048; and (d) no significant relationships.
Change in mean position between 10 and 20 cm s−1 was not correlated with any measured variable. In contrast, the magnitude of the change in mean position between 10 and 30 cm s−1 was correlated with MMR and AS: fish with higher values for these variables moved closer to the front of the school as speed increased while those with lower values moved towards the back (figure 5). Changes in mean position between 10 and 30 cm s−1 were not correlated with SMR or Ugt (data not shown).
Figure 5.
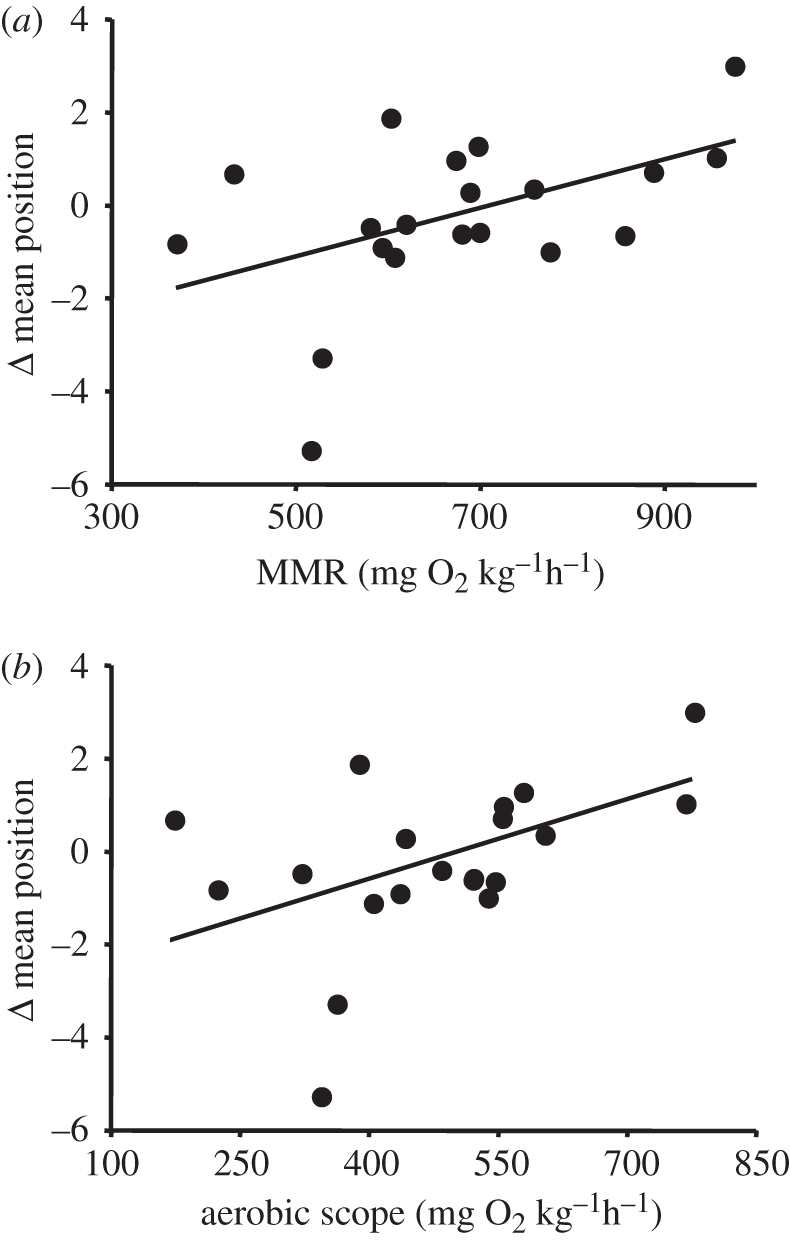
Relationship between the change in mean position within schools between 10 and 30 cm−1 and (a) maximal metabolic rate (MMR) and (b) aerobic scope (AS). Each point represents data for a focal fish within a given school (n = 20). Positive y-axis values indicate anterior movement as speed increased. Regression equations are as follows: (a) Δ mean position = –3.82 + 0.005(MMR), r2 = 0.24, p = 0.029; Δ mean position = –2.76 + 0.005(AS), r2 = 0.22, p = 0.037.
At 10 cm s−1, fT was not affected by any factor, but at 20 and 30 cm s−1, fish that trailed other individuals had fewer tail beats (at 20 cm s−1: 1.75 ± 0.05 Hz, n = 18; at 30 cm s−1: 2.08 ± 0.07 Hz, n = 19) than fish that faced the current head-on (at 20 cm s−1: 2.00 ± 0.05 Hz, n = 21; at 30 cm s−1: 2.35 ± 0.09 Hz, n = 19), regardless of position relative to the front of the school (electronic supplementary material, figure S1; linear mixed models, 20 cm s−1: F = 22.26, p = < 0.0001; 30 cm s−1: F = 13.23, p = 0.001). At 30 cm s−1, there was also a significant effect of position itself, with fish further back in the school tending to have a lower fT (linear mixed model, F = 5.785, p = 0.022).
4. Discussion
The results reveal that individual fish adjust spatial position within schools in response to changes in environmental conditions such as current speed, and that the magnitude of these changes is directly related to their aerobic capacity.
While some fish showed little or no change in position as speed increased [5], others showed large shifts in position. It is likely that individuals with lower aerobic capacity preferentially moved to posterior positions at higher speeds, to take advantage of hydrodynamic benefits of swimming behind other fish and decrease costs of swimming [21]. Indeed, at higher speeds, fish near the back of schools required fewer tail beats to propel themselves than fish at the front, especially when trailing other fish [5,20]. To receive this hydrodynamic benefit, fish in posterior positions may have been exploiting areas of reduced flow created by anterior individuals or capturing their vortices to generate lift [19,21,34]. The optimal position for such effects is believed to be 1–2 body lengths diagonally behind two anterior individuals (see the two-dimensional diamond formation described by Weihs [19] and Liao [21]). This arrangement was observed in the present study, but was generally transient, suggesting that energy savings of posterior fish in the wild could be even greater if this formation is maintained. Data on the relationship between tail beat frequency and oxygen consumption during swimming are not available for golden grey mullet, but estimates using relationships for other benthopelagic marine species (saithe Pollachius virens and whiting Merlangius merlangus [35]), using the mean model parameters for these two species but using mean SMR for golden grey mullet from the current study for the intercept, indicate that trailing fish experience an approximately 12 per cent mean decrease in swimming costs per unit time compared with those facing the current head-on when swimming at 30 cm s−1, and possess 9 per cent more AS after accounting for swimming costs. Such hydrodynamic benefits of trailing are likely to increase with current speed. For example, extrapolating trends over the speeds examined in the current study to 70 cm s−1 (the approximate mean Ugt among individuals in the current study), trailing individuals could spend 23 per cent less energy per unit time and have 25 per cent more residual AS compared with those facing the current head-on (electronic supplementary material, figure S2). This could allow an individual to devote AS to other oxygen-consuming physiological functions, such as digestion [14,29], or allow steady-state swimming instead of burst-type swimming at moderately high flow velocities. Swimming under non-optimal conditions that reduce AS, such as hypoxia, acute temperature change or after feeding, could further increase the importance of conservation of space within a limited AS.
It is also possible that fish with low aerobic capacity were forced to posterior positions at higher speeds because they could not keep pace with the other school members. In the current study, however, all fish had Ugt in excess of 30 cm s−1 and never exhibited an anaerobic burst-and-coast gait in the schools [27]. Thus, all fish could have reached the front of the school if motivated. In nature, however, faster flows could result in fish with decreased aerobic swimming abilities drifting towards the rear of a school, being forced to perform burst-type swimming to keep pace, or being left behind. If group cohesion is to be maintained, slower fish could limit the speed of the entire school if faster individuals are forced to lower their speed to retain contact.
While fish with lower aerobic capacities move to posterior school positions at higher speeds, individuals with higher capacities may move towards frontal positions under such conditions. Fish that are willing or able to position themselves near the front of the school can attain greater food intake rates [11,22], and a major benefit of high MMR could be an ability to move to the front at high speeds while retaining sufficient AS to feed and digest food. An increase in current velocity could even motivate such individuals to occupy forward positions because high flow rates increase encounters with planktonic prey [36].
SMR was not correlated with position at any speed. This indicates that fish with elevated baseline energetic requirements were not motivated to occupy frontal positions, despite the advantages in terms of increased feeding rates [11,22]. However, occupying the front of a school also increases swimming costs owing to increased drag. Individuals with high SMR may be just as likely to reduce costs by occupying posterior school positions as they are to increase feeding rates by occupying the front position, with the numerous trade-offs associated with different spatial positions evening out any effects of SMR. It is possible that factors not examined in this study, such as food availability or time constraints on foraging, may shift this balance and motivate fish with higher SMR to move forward within the school under certain conditions.
Fish sometimes prefer to join schools of fish that are familiar [37] or morphologically similar [38]. This probably reduces oddity effects [39], but similarities in appearance may also be a proxy for similar physiology and performance capacity. It would be disadvantageous to join a school of fish that are much slower or faster—faster fish could leave the individual behind at high speeds, whereas slower fish may limit overall performance. This leads to the intriguing possibility that there may be differences in overall performance capacity between schools in the wild, or that the combined MMR and AS of school members varies among schools. In the current study, fish were not allowed to select schoolmates, but further work could examine the relationship between physiological traits and school selection.
Additional work is also required to examine whether the results of this study carry over to larger schools. For some pelagic marine species, schools contain thousands or even millions of fishes. In such large schools, it may be difficult for individuals to locate and occupy their optimal position. Shuffling of individuals could be disruptive to the behaviour of the entire school, especially if their behaviour influences movements of their neighbours [24,40]. There is evidence, however, that massive schools in the wild comprise smaller subgroups [22,41,42], so it is possible that fish occupy preferred positions within these units. Larger schools could also have varying ratios of fish with high and low aerobic capacities, potentially affecting the relative roles of hydrodynamic efficiency and food intake in determining the overall behaviour and structure of the school. A school with a large proportion of high-performance individuals could have many fish attempting to be near the front of the school, while a school with numerous low-performance individuals could have many fish attempting to trail conspecifics.
In conclusion, this study provides evidence that inter-individual differences in physiology influence the behaviour of fish within schools. In particular, the proximity of fish to the front of the school is directly related to their aerobic capacity when the school swims at faster speeds. More work is needed to determine whether other factors, such as food intake, temperature, salinity, hypoxia and predator presence, can alter the relationships between individual physiology and positional preference within schools.
Acknowledgements
The authors thank Pat McLaughlin and Maria Karagouni for assistance with video analysis. We also thank Michel Cantou and Mary Ryan for their help in collecting fish. We are also grateful to the two anonymous reviewers who provided comments on an earlier version of this paper. This research was funded in part by the Centre National de la Recherché Scientifique (CNRS) and the Université Montpellier 2. S.S.K. was supported by post-doctoral research fellowships from the Natural Sciences and Engineering Research Council of Canada and the Davies Charitable Foundation. S.M. was supported by a doctoral fellowship from the Regione Autonoma della Sardegna (Italy) and the European Commission. J.F.S. was supported by a grant from the Danish Agency for Science Technology and Innovation. All procedures with animals conformed to the laws and regulations of the country in which the experiments were performed (France).
References
- 1.Pitcher T. J., Parrish J. K. 1993. Functions of shoaling behaviour in teleosts. In Behaviour of teleost fishes (ed. Pitcher T. J.), pp. 363–439 London, UK: Chapman & Hall [Google Scholar]
- 2.Godin J.-G. J., Morgan M. J. 1985. Predator avoidance and school size in a cyprinodontid fish, the banded killifish (Fundulus diaphanus Lesueur). Behav. Ecol. Sociobiol. 16, 105–110 10.1007/BF00295142 (doi:10.1007/BF00295142) [DOI] [Google Scholar]
- 3.Pitcher T. J., Magurran A. E., Winfield I. J. 1982. Fish in larger shoals find food faster. Behav. Ecol. Sociobiol. 10, 149–151 10.1007/BF00300175 (doi:10.1007/BF00300175) [DOI] [Google Scholar]
- 4.Morrell L. J., Romey W. L. 2008. Optimal individual positions within animal groups. Behav. Ecol. 19, 909–919 10.1093/beheco/arn050 (doi:10.1093/beheco/arn050) [DOI] [Google Scholar]
- 5.Svendsen J. C., Skov J., Bildsoe M., Steffensen J. F. 2003. Intra-school positional preference and reduced tail beat frequency in trailing positions in schooling roach under experimental conditions. J. Fish Biol. 62, 834–846 10.1046/j.1095-8649.2003.00068.x (doi:10.1046/j.1095-8649.2003.00068.x) [DOI] [Google Scholar]
- 6.Bumann D., Krause J., Rubenstein D. 1997. Mortality risk of spatial positions in animal groups: the danger of being in the front. Behaviour 134, 1063–1076 10.1163/156853997X00403 (doi:10.1163/156853997X00403) [DOI] [Google Scholar]
- 7.Krause J., Bumann D., Todt D. 1992. Relationship between the position preference and nutritional state of individuals in schools of juvenile roach (Rutilus rutilus). Behav. Ecol. Sociobiol. 30, 177–180 10.1007/BF00166700 (doi:10.1007/BF00166700) [DOI] [Google Scholar]
- 8.Nespolo R. F., Franco M. 2007. Whole-animal metabolic rate is a repeatable trait: a meta-analysis. J. Exp. Biol. 210, 2000–2005 10.1242/jeb.02780 (doi:10.1242/jeb.02780) [DOI] [PubMed] [Google Scholar]
- 9.Marras S., Claireaux G., McKenzie D. J., Nelson J. A. 2010. Individual variation and repeatability in aerobic and anaerobic swimming performance of European sea bass, Dicentrarchus labrax. J. Exp. Biol. 213, 26–32 10.1242/jeb.032136 (doi:10.1242/jeb.032136) [DOI] [PubMed] [Google Scholar]
- 10.Fry F. E. J. 1971. The effect of environmental factors on the physiology of fish. Fish physiology, vol. 6 (eds Hoar W. S., Randall D. J.), pp. 1–98 New York, NY: Academic Press [Google Scholar]
- 11.Krause J. 1993. The relationship between foraging and shoal position in a mixed shoal of roach (Rutilus rutilus) and chub (Leuciscus cephalus): a field study. Oecologia 93, 356–359 10.1007/BF00317878 (doi:10.1007/BF00317878) [DOI] [PubMed] [Google Scholar]
- 12.Finstad A. G., Forseth T., Ugedal O., Naesje T. F. 2007. Metabolic rate, behaviour and winter performance in juvenile Atlantic salmon. Funct. Ecol. 21, 905–912 10.1111/j.1365-2435.2007.01291.x (doi:10.1111/j.1365-2435.2007.01291.x) [DOI] [Google Scholar]
- 13.Huntingford F. A., Andrew G., Mackenzie S., Morera D., Coyle S. M., Pilarczyk M., Kadri S. 2010. Coping strategies in a strongly schooling fish, the common carp Cyprinus carpio. J. Fish Biol. 76, 1576–1591 10.1111/j.1095-8649.2010.02582.x (doi:10.1111/j.1095-8649.2010.02582.x) [DOI] [PubMed] [Google Scholar]
- 14.Killen S. S., Brown J. A., Gamperl A. K. 2007. The effect of prey density on foraging mode selection in juvenile lumpfish: balancing food intake with the metabolic cost of foraging. J. Anim. Ecol. 76, 814–825 10.1111/j.1365-2656.2007.01237.x (doi:10.1111/j.1365-2656.2007.01237.x) [DOI] [PubMed] [Google Scholar]
- 15.Claireaux G., Lefrancois C. 2007. Linking environmental variability and fish performance: integration through the concept of scope for activity. Phil. Trans. R. Soc. B 362, 2031–2041 10.1098/rstb.2007.2099 (doi:10.1098/rstb.2007.2099) [DOI] [PMC free article] [PubMed] [Google Scholar]
- 16.Portner H. O., Knust R. 2007. Climate change affects marine fishes through the oxygen limitation of thermal tolerance. Science 315, 95–97 10.1126/science.1135471 (doi:10.1126/science.1135471) [DOI] [PubMed] [Google Scholar]
- 17.Cutts C., Speakman J. 1994. Energy savings in formation flight of pink-footed geese. J. Exp. Biol. 189, 251–261 [DOI] [PubMed] [Google Scholar]
- 18.Jeukendrup A. E., Craig N. P., Hawley J. A. 2000. The bioenergetics of world class cycling. J. Sci. Med. Sport 3, 414–433 10.1016/S1440-2440(00)80008-0 (doi:10.1016/S1440-2440(00)80008-0) [DOI] [PubMed] [Google Scholar]
- 19.Weihs D. 1973. Hydromechanics of fish schooling. Nature 241, 290–291 10.1038/241290a0 (doi:10.1038/241290a0) [DOI] [Google Scholar]
- 20.Herskin J., Steffensen J. F. 1998. Energy savings in sea bass swimming in a school: measurements of tail beat frequency and oxygen consumption at different swimming speeds. J. Fish Biol. 53, 366–376 10.1111/j.1095-8649.1998.tb00986.x (doi:10.1111/j.1095-8649.1998.tb00986.x) [DOI] [Google Scholar]
- 21.Liao J. C. 2007. A review of fish swimming mechanics and behaviour in altered flows. Phil. Trans. R. Soc. B 362, 1973–1993 10.1098/rstb.2007.2082 (doi:10.1098/rstb.2007.2082) [DOI] [PMC free article] [PubMed] [Google Scholar]
- 22.DeBlois E. M., Rose G. A. 1996. Cross-shoal variability in the feeding habits of migrating Atlantic cod (Gadus morhua). Oecologia 108, 192–196 10.1007/BF00333231 (doi:10.1007/BF00333231) [DOI] [PubMed] [Google Scholar]
- 23.Wroblewski J. S., Nolan B. G., Rose G. A., deYoung B. 2000. Response of individual shoaling Atlantic cod to ocean currents on the northeast Newfoundland Shelf. Fish. Res. 45, 51–59 10.1016/S0165-7836(99)00096-X (doi:10.1016/S0165-7836(99)00096-X) [DOI] [Google Scholar]
- 24.Romey W. L. 1996. Individual differences make a difference in the trajectories of simulated schools of fish. Ecol. Model. 92, 65–77 10.1016/0304-3800(95)00202-2 (doi:10.1016/0304-3800(95)00202-2) [DOI] [Google Scholar]
- 25.Iversen N. K., Dupont-Prinet A., Findorf I., McKenzie D. J., Wang T. 2010. Autonomic regulation of the heart during digestion and aerobic swimming in the European sea bass (Dicentrarchus labrax). Comp. Biochem. Physiol. A Mol. Integr. Physiol. 156, 463–468 10.1016/j.cbpa.2010.03.026 (doi:10.1016/j.cbpa.2010.03.026) [DOI] [PubMed] [Google Scholar]
- 26.Lauder G. V. 2006. Locomotion. In The physiology of fishes (eds Evans D. H., Claiborne J. B.), pp. 3–47 Boca Raton, FL: CRC Press [Google Scholar]
- 27.Peake S. J., Farrell A. P. 2004. Locomotory behaviour and post-exercise physiology in relation to swimming speed, gait transition and metabolism in free-swimming smallmouth bass (Micropterus dolomieu). J. Exp. Biol. 207, 1563–1575 10.1242/jeb.00927 (doi:10.1242/jeb.00927) [DOI] [PubMed] [Google Scholar]
- 28.Steffensen J. 1989. Some errors in respirometry of aquatic breathers: how to avoid and correct for them. Fish Physiol. Biochem. 6, 49–59 10.1007/BF02995809 (doi:10.1007/BF02995809) [DOI] [PubMed] [Google Scholar]
- 29.Dupont-Prinet A., Claireaux G., McKenzie D. J. 2009. Effects of feeding and hypoxia on cardiac performance and gastrointestinal blood flow during critical speed swimming in the sea bass Dicentrarchus labrax. Comp. Biochem. Physiol. A Mol. Integr. Physiol. 154, 233–240 10.1016/j.cbpa.2009.06.015 (doi:10.1016/j.cbpa.2009.06.015) [DOI] [PubMed] [Google Scholar]
- 30.Killen S. S., Marras S., McKenzie D. J. In press Fuel, fasting, fear: routine metabolic rate and food deprivation exert synergistic effects on risk-taking in individual juvenile European sea bass. J. Anim. Ecol. 10.1111/j.1365-2656.2011.01844.x (doi:10.1111/j.1365-2656.2011.01844.x) [DOI] [PubMed] [Google Scholar]
- 31.Dupont-Prinet A., Chatain B., Grima L., Vandeputte M., Claireaux G., McKenzie D. J. 2010. Physiological mechanisms underlying a trade-off between growth rate and tolerance of feed deprivation in the European sea bass (Dicentrarchus labrax). J. Exp. Biol. 213, 1143–1152 10.1242/jeb.037812 (doi:10.1242/jeb.037812) [DOI] [PubMed] [Google Scholar]
- 32.Killen S. S., Costa I., Brown J. A., Gamperl A. K. 2007. Little left in the tank: metabolic scaling in marine teleosts and its implications for aerobic scope. Proc. R. Soc. B 274, 431–438 10.1098/rspb.2006.3741 (doi:10.1098/rspb.2006.3741) [DOI] [PMC free article] [PubMed] [Google Scholar]
- 33.Farrell A. P. 2008. Comparisons of swimming performance in rainbow trout using constant acceleration and critical swimming speed tests. J. Fish Biol. 72, 693–710 10.1111/j.1095-8649.2007.01759.x (doi:10.1111/j.1095-8649.2007.01759.x) [DOI] [Google Scholar]
- 34.Liao J. C., Beal D. N., Lauder G. V., Triantafyllou M. S. 2003. Fish exploiting vortices decrease muscle activity. Science 302, 1566–1569 10.1126/science.1088295 (doi:10.1126/science.1088295) [DOI] [PubMed] [Google Scholar]
- 35.Steinhausen M., Steffensen J., Andersen N. 2005. Tail beat frequency as a predictor of swimming speed and oxygen consumption of saithe (Pollachius virens) and whiting (Merlangius merlangus) during forced swimming. Mar. Biol. 148, 197–204 10.1007/s00227-005-0055-9 (doi:10.1007/s00227-005-0055-9) [DOI] [Google Scholar]
- 36.Fausch K. D., Nakano S., Kitano S. 1997. Experimentally induced foraging mode shift by sympatric charrs in a Japanese mountain stream. Behav. Ecol. 8, 414–420 10.1093/beheco/8.4.414 (doi:10.1093/beheco/8.4.414) [DOI] [Google Scholar]
- 37.Griffiths S. W., Magurran A. E. 1999. Schooling decisions in guppies (Poecilia reticulata) are based on familiarity rather than kin recognition by phenotype matching. Behav. Ecol. Sociobiol. 45, 437–443 10.1007/s002650050582 (doi:10.1007/s002650050582) [DOI] [Google Scholar]
- 38.Croft D. P., Arrowsmith B. J., Bielby J., Skinner K., White E., Couzin I. D., Magurran A. E., Ramnarine I., Krause J. 2003. Mechanisms underlying shoal composition in the Trinidadian guppy, Poecilia reticulata. Oikos 100, 429–438 10.1034/j.1600-0706.2003.12023.x (doi:10.1034/j.1600-0706.2003.12023.x) [DOI] [Google Scholar]
- 39.Peuhkuri N. 1997. Size-assortative shoaling in fish: the effect of oddity on foraging behaviour. Anim. Behav. 54, 271–278 10.1006/anbe.1996.0453 (doi:10.1006/anbe.1996.0453) [DOI] [PubMed] [Google Scholar]
- 40.Zheng M., Kashimori Y., Hoshino O., Fujita K., Kambara T. 2005. Behavior pattern (innate action) of individuals in fish schools generating efficient collective evasion from predation. J. Theoret. Biol. 235, 153–167 10.1016/j.jtbi.2004.12.025 (doi:10.1016/j.jtbi.2004.12.025) [DOI] [PubMed] [Google Scholar]
- 41.Swartzman G. 1997. Analysis of the summer distribution of fish schools in the Pacific Eastern boundary current. ICES J. Mar. Sci. 54, 105–116 10.1006/jmsc.1996.0160 (doi:10.1006/jmsc.1996.0160) [DOI] [Google Scholar]
- 42.Gerlotto F. o., Paramo J. 2003. The three-dimensional morphology and internal structure of clupeid schools as observed using vertical scanning multibeam sonar. Aquat. Living Resour. 16, 113–122 10.1016/S0990-7440(03)00027-5 (doi:10.1016/S0990-7440(03)00027-5) [DOI] [Google Scholar]