

Abstract
Scientists seek to use fossil and archaeological evidence to constrain models of the coevolution of human language and tool use. We focus on Neanderthals, for whom indirect evidence from tool use and ancient DNA appears consistent with an adaptation to complex vocal-auditory communication. We summarize existing arguments that the articulatory apparatus for speech had not yet come under intense positive selection pressure in Neanderthals, and we outline some recent evidence and analyses that challenge such arguments. We then provide new anatomical results from our own attempt to reconstruct vocal tract (VT) morphology in Neanderthals, and document our simulations of the acoustic and articulatory potential of this reconstructed Neanderthal VT. Our purpose in this paper is not to polarize debate about whether or not Neanderthals were human-like in all relevant respects, but to contribute to the development of methods that can be used to make further incremental advances in our understanding of the evolution of speech based on fossil and archaeological evidence.
Keywords: Neanderthal, vocal tract, hyoid, quantal vowels, evolution of speech
1. The speech, handedness and tool-use nexus in our closest extinct relatives: the Neanderthals
The evolution of the human cognitive systems that underlie praxis, tool use, language and speech, is the thematic focus of this Special Issue. Numerous attempts have been made to reconstruct the evolutionary trajectory leading to human language. In one recent example, Arbib [1,2] has proposed a ‘mirror system’ model in which the language system evolves from complex imitation of manual praxis (involving the capacity for social learning of longer sequences of novel and hierarchically organized actions), via a manual protosign stage (involving pantomime gestures by the signaller, with conventionalized gestures to disambiguate the meaning of these pantomimes), to a protolanguage stage in which vocal gestures accompany and ‘invade’ the communicative domain of these manual gestures. The last stage (fully grammatical linguistic structure) may then have been reached by cumulative cultural evolution (and not by genetic adaptation: [3,4]). Another version of this model by Corballis [5,6] proposes that left-hemisphere lateralization of language processing (and human-handedness) may have been associated with the shift to the vocal channel in the sixth ‘protolanguage’ phase. Left-hemisphere lateralization of cortical vocal perception circuitry is held to be phylogenetically old and widespread in extant primates, so that as Corballis ([5], p. 197) puts it, ‘language may have gone from hand to mouth, while lateralization went from mouth to hand’. In Corballis' [5,6] version of the model, the emergence of a bias towards right-handedness in the archaeological record is, therefore, a diagnostic marker of a vocal protolanguage.
At the time of writing we have archaeological and fossil anatomical evidence of population-level right-handedness in tool use in Homo heidelbergensis, Neanderthals and anatomically modern Homo sapiens [7–9]; these hominins are all relatively large-brained. We also have suggestive evidence of speech-relevant adaptations in the same three species from hyoid bone morphology [10,11], from analysis of the thoracic spinal canal [12], and from ancient DNA (the presence of the human form of FOXP2 in Neanderthals: [13]). Thus, we have no a priori reason to doubt that Neanderthals had at least reached the vocal protolanguage stage.
However, the level of grammatical structure of Neanderthal vocal utterances remains speculative: we do not know whether or not the required biological and/or cultural preconditions were in place for the stable cultural evolution of linguistic structure and usage as seen in human societies today. Some scientists have suggested that clues can be gleaned from the hierarchical and compositional organization of Neanderthal tool-using behaviour (cf. [14,15]); for instance, Ambrose [16] notes that by about 300 kyr BP, there was an acceleration of cultural evolution both in the populations ancestral to Neanderthals and in the African populations ancestral to early anatomically modern humans (MHs), including the appearance of composite tools (evidence of hafting of stone projectile points and other tools) requiring the assembly of at least three elements (the stone tool, the haft and the binding material). He suggests that such compositional assembly rules may be analogous to those of linguistic grammars. Others [17] have suggested that evidence of knot tying would provide a more exact analogy with (and marker for) the cognitive operations required for grammar. The evidence is, however, as yet too sparse to characterize the binding methods used by Neanderthals in tool hafting, and moreover, if fully grammatical languages emerged through cumulative cultural evolution, then such evidence could only indicate the presence of cognitive pre-adaptations. Further experimental analysis is required of the cognitive and behavioural organization of Neanderthal stone technologies (cf. the methodologies of Pastra & Aloimonos [18] and Stout & Chaminade [19]). In this paper, we shall focus instead on methods for assessing fossil evidence for the evolution of the Neanderthal vocal tract (VT), and thus of one aspect of Neanderthals' potential capacity for articulate speech.
(a). Hominin vocal tract morphology as evidence of selection for articulatory potential
Current work on fossil evidence for the evolution of fully grammatical speech must inevitably recognize the towering influence of the work of Philip Lieberman. Writing at a time when Chomsky's ideas were in the ascendant, and when cognitive science was flowering, Lieberman demanded that attention be given not just to syntax and semantics, but also to acoustic and articulatory phonology. In a tour de force of synthesis, he set out a new hypothesis about the Darwinian evolution of language under natural selection, proposing that he could identify adaptive and unique features of human VT anatomy, which were necessary for and diagnostic of spoken language. The evolution of these features could also be traced, Lieberman argued, in the hominin fossil record. The basic Lieberman hypothesis (e.g. papers reprinted in Lieberman [20]) states that speech perception characteristically requires listeners to decode a stream of varying, serially ordered acoustic output issuing at an exceptionally fast rate from the speaker's VT. In terms of syntactic and semantic content, this very rapid stream of articulatory gestures (which is speech-specific) enables enormous amounts of information to be compressed by a speaker into a single breath group, and to be then held in the listener's working memory, while its syllabic structure and meaning are decoded.
The Acoustic Theory of Speech Production [21] proposes that sound production in speech arises from the excitation of an acoustic filter composed of the VT (pharynx, oral and nasal cavities) by a sound source (for example, the vibrations of the larynx for vowels). The source and filter are considered as linearly independent and the filter shape may be varied by motion of the articulators (tongue, teeth, lips and velum) to vary its acoustic properties. For vowels, different articulator configurations give rise to a VT filter with different resonances, known as formants, and hence to different phonemes. The formants, in particular the two with the lowest frequencies, F1 and F2, are critical to the identification of the perceived vowel with one or another target vowel category (/a/, /i/, /u/, etc.). The space delimited by the range of F1 and F2 values an individual or species can achieve is known as their vowel space. In MHs, this space is approximately triangular and the corners are associated with the quantal vowels: /a/, /i/ and /u/ [22]. To a first approximation, the acoustic properties of the VT for a given target vowel may be represented by two concatenated tubes of different lengths and cross sections and the frequency of each of F1 and F2 may be estimated, at least for the quantal vowels, from the geometric properties of one of these pairs of tubes [23].
The quantal vowels /a/, /i/ and /u/ are distinctive in that their acoustic pattern is perceptually stable across a reasonably large range of variability in the precise points of articulation, and perhaps for this reason, these tend to be the most common of the targeted vowel sounds used in human languages. Lieberman argues (from the acoustic analysis of simulated VT resonances) that production of the quantal vowels requires a VT anatomy that enables independent constriction of two cavities, front and back, and which can produce abrupt transitions between open and constricted sections at or near the midpoint of its length (with a ratio of cross-sectional area of the order of 10 : 1). He points out that the human adult VT is uniquely well-adapted for this, because the lowered larynx and hyoid bring the posterior tongue down into the pharynx, so that this part of the tongue dorsum can act as a movable anterior pharyngeal wall (independently constricting or enlarging the back cavity, the latter by contracting genioglossus and related muscles). The right-angled bend in the tongue dorsum at the back of the oral cavity separately enables constriction at that point (by contracting styloglossus to approximate the tongue surface towards the nasopharynx). The front cavity can meanwhile be independently constricted or enlarged by movement of the tongue blade and by opening or closing the jaw. Lieberman argues that non-human primates (monkeys and apes) cannot produce these quantal vowel sounds because their tongues are horizontally oriented and located entirely in the oral cavity. This anatomical pattern limits phonetic potential to a single-tube model: the tongue's intrinsic muscles and elastic properties then mean that other primates cannot achieve sufficiently sharp discontinuities in cross-sectional area near the midpoints of their VTs to produce human-like ‘two-tube’ vowel formants.
Lieberman proposes that the distinctive descended larynx position in the MH VT must be an adaptation to speech, because no other selective advantage for a lowered larynx could have outweighed the disadvantage of a permanent separation of epiglottis from velum (which increases the risk of accidentally choking when a swallowed object gets lodged in the pharynx—Lieberman was composing his theory at a time when the Heimlich manoeuvre was very much in the news). Lieberman & Crelin [24] undertook an analysis of the reconstructed VT anatomy of Neanderthals. The Neanderthal larynx was placed high in the neck by analogy with the configuration found in non-human adult primates and newborn humans, on the basis that numerous aspects of the Neanderthal cranial base and mandible were more like the human newborn than adult forms.
Modelling of the potential acoustic capability of Neanderthal VTs was carried out by Lieberman et al. [24,25] based on their three-dimensional reconstruction of the La Chapelle-aux-Saints fossil. Silicon rubber casts of the VT of specimens of an adult male and a newborn MH and of a chimpanzee were made together with a cast of the predicted VT of the Neanderthal specimen as reconstructed by Lieberman & Crelin [24]. They noted that, owing to the assumption that the Neanderthal larynx is placed relatively higher in the VT than that of an adult MH, the Neanderthal tract is more similar to that of the newborn MH and chimpanzee than to that of the adult MH specimen. Acoustic modelling was confined to predicting the first three formants of the quantal vowels, /a/, /i/ and /u/. Area functions (the cross-sectional area at each point along the length of the VT) for the configurations of the chimpanzee VT said to be the ‘best’ approximations to /a/, /i/, /u/ were derived, and the corresponding formant frequencies were estimated using the algorithm developed by Henke [26]. Similarly, the formants for the newborn MH and the Neanderthal specimen were estimated. In each case, a comparison was made between the estimated formants and those measured by Peterson & Barney [27] for the American English vowel set in 76 children and adults. It was observed that the chimpanzee and newborn MH VTs both predicted substantially reduced vowel spaces compared with the Peterson and Barney data. The prediction for the Neanderthal vowel space was also smaller than for the MH dataset, being closer to that for the chimpanzee and newborn human specimens.
Lieberman & Crelin [28] concluded that Neanderthals could not produce the quantal vowel forms (/a/, /i/ and /u/) because they lacked independent variability of the pharyngeal cavity (which humans achieve by antero-posterior movements of the dorsal tongue). Lieberman [29] listed other fossil skulls that were morphologically similar to either the La Chapelle-aux-Saints Neanderthal or to the MH configuration, indicating that in each case the phonetic potential was expected to match that of the relevant comparator.1 As more direct supporting evidence for his reconstruction, and having previously proposed that the Neanderthal styloid process (as also in human newborns) is characteristically less vertically aligned than in adult humans reflecting the more superior position of the point of insertion of the Neanderthal stylohyoid muscle, in a subsequent paper, Lieberman [29] also proposed that if the mandibular facets at the origin of the anterior digastric, insertion of the posterior digastric, and origin of the geniohyoid muscles are angled to minimize sheer stress, then the human adult chin could be seen as an adaptation to the lowered position of the hyoid (since it enables these facets to be more inferiorly oriented); in Neanderthals as in human newborns, however, these facet orientations are consistent with a horizontal alignment of these muscles—again implying a more superiorly positioned hyoid. Lieberman, therefore, argued that selection on VT anatomy for stable and complex speech output had occurred among early MHs, but not among Neanderthals.
A number of studies have been carried out to test particular aspects of Lieberman's hypothesis, of which we summarize here only those most relevant to the focus of the remainder of this paper.
The argument that it is the resting profile of the tongue and the position of its muscle attachment points, rather than its fundamental muscle architecture, that differentiates the articulatory potential of the human and chimpanzee tongues has been supported by Takemoto [30,31], who has shown by dissection that the basic organization and orientation of muscle fibres is the same in both species. The major difference between the human and the chimpanzee tongue is the greater antero-posterior curvature of the surface of the human tongue, which gives it more degrees of freedom in feeding and in articulatory manoeuvres: the chimpanzee tongue, being essentially flat along most of its length, is largely restricted to protrusive and retrusive movements. However, the argument that the resting profile of the MH tongue must be explained by an evolutionary descent of the larynx under selection for speech capability has been separately addressed in a series of studies of the developing monkey, chimpanzee and human VT by Nishimura et al. [32–36], and these new studies have tended not to support that hypothesis. Nishimura et al.'s studies suggest that the two-tube configuration identified by Lieberman as central to the human VT's phonetic potential may have evolved as a secondary consequence of changes in mandible shape and of facial flattening, and not as a primary object of natural selection for phonetic potential.
With regard to Neanderthal/MH contrasts, initially it had been suggested that basicranial flexion (which is greater in MHs than in Neanderthals) might also be a marker of laryngeal descent [24,37,38], but subsequent anatomical studies have disproved this [39,40]. A different approach to Neanderthal VT reconstruction was taken by Boë et al. [41] who maintained that the Neanderthal larynx and hyoid bone sat lower in the VT than in Lieberman's reconstruction (using a prediction model for larynx height based on its correlations with various skull and mandible dimensions in an MH reference sample). Implications for speech were examined using a statistical approach to generating the maximal Neanderthal vowel space, based on the articulatory model of Maeda [42]. This method defines the principal components that underlie a defined proportion of the variance in a set of observed articulatory gestures in a corpus. By systematically covarying these components within a defined range, it is possible to predict all possible articulatory gestures, within that range. Boë et al. [41,43] have modified Maeda's model to allow for adjustment of the laryngeal height for any particular VT by means of a laryngeal height index: broadly a coefficient relating (horizontal) palatal distance to (vertical) pharyngeal height. They used an acoustical model [44] based on the set of possible VT geometries to explore the maximal F1–F2 vowel space for MHs ranging in age from newborn to adult (male and female) as well as for an adult Neanderthal VT geometry estimated from the La Chapelle-aux-Saints fossil as reconstructed by Heim [45]. They estimated the larynx height index of the Neanderthal to be of the same order as that of a 10 year old child (in other words, with a long oral cavity relative to laryngeal height, the Neanderthal oral cavity being some 2 cm longer than in the reference adult human). This value for the index does not prevent 10 year old children from producing quantal vowels, and Boë et al. (having no reason to assume that it would have prevented Neanderthals from articulating quantal vowels) concluded that the modelled Neanderthal maximal vowel space did not significantly differ from that of an adult MH.
De Boer & Fitch [46] have critiqued Boë et al.'s approach on the grounds that their focus on estimating Neanderthal laryngeal height does not properly validate the inference of a similarly lowered position of the hyoid and tongue root. Further they suggest that, because Boë et al. have started from a theoretical model [47] that incorporates all possible MH VT shapes, the estimates of the Neanderthal vowel space they obtain from it may be biased towards a MH-like vowel triangle. Meanwhile, de Boer [48,49] has investigated the effect of larynx height on potential vowel space using Mermelstein's [50] model of the direct motion of the articulators, which is based on the integrated effect of the action of their associated muscles. This model permits direct control of the location and/or shape of the larynx, pharynx, hyoid, velum, tongue body, tongue blade, jaw and lips. De Boer considered VT mid-sagittal cross sections corresponding to an adult male MH and an adult female MH (and also a ‘mixed’ male VT model with female perilaryngeal anatomy at the level of the larynx). Area functions were generated from the mid-sagittal cross sections using the formulae given by Mermelstein [50] derived from X-ray data. A large number of VT configurations (10 000) were generated by random selection of the control parameters of the model to define the potential vowel space. Where a parameter set resulted in occlusion of the VT, the area was re-set to 0.1 cm2. The formant frequencies predicted using Kelly & Lochbaum's [51] method were plotted on an F1–F2 diagram and an estimate of the complete vowel space was made by calculating the convex hull of the cloud of data points so derived. The results showed that the female VT was predicted to have a larger vowel space than the male VT, given the same articulatory constraints. De Boer concluded that a VT with approximately equal lengths for its horizontal and vertical segments was optimal for maximizing articulatory range, and that the further descent of the larynx in the MH post-pubertal male must have been driven by a selection pressure other than enhancement of speech communication (such as size exaggeration).
In this paper, we report a new study of the speech potential of Neanderthals, based on reconstructions of the positions of the hyoid and tongue root (and thus addressing the critique of Boë et al. [41] made by de Boer & Fitch [46]), and a software articulatory model that also allows us to explore the effects on vowel space of varying the position of the hyoid and other articulators. Data obtained in other domains (e.g. handedness as inferred from tools and skeletal parts; ancient DNA) provide suggestive but indirect evidence of the potential for complex vocal communication in Neanderthals. We propose our new approach as a way of incrementally building understanding of more direct evidence for Neanderthal speech potential, while avoiding the polarization and polemic that have tended to characterize this debate.
2. Material and methods
(a). Anatomical reconstructions
For the Neanderthal VT reconstructions, we predicted cranio-caudal and dorsoventral distances to a hyoid landmark from skull and mandible landmarks or reference planes. These Neanderthal hyoid position reconstructions are based on prediction equations obtained by analysing a human reference sample, which use three-dimensional interlandmark distances describing face, skull base and mandible dimensions as the independent variables.
(i). Human sample
Our MH data consist of computed tomography (CT) scans produced from 10 female and 10 male volunteering healthy adults aged between 20 and 65. The data were provided by the Laboratory of Functional Anatomy of the University Paris René Descartes [52]. Study subjects were scanned in dorsal decubitus position, teeth in occlusion and tongue held against the palate. Image acquisition occurred parallel to the Frankfurt plane. CT scans were acquired using a Somatom Sensroation16—Siemens scanner (slice thickness 0.75 mm, pixel matrix 512 × 512, Inc. 0.48 mm, tube voltage 120 kV, tube current base line 200 mA, FOV 160 mm) at Ouest Parisien Medical Imaging Centre. Based on the exploration of the range of dorsoventral and cranio-caudal hyoid positions observed in this MH sample, we defined an envelope of anatomically observed human vertical hyoid positions in relation to the vertebral column, and horizontal hyoid positions in relation to the skull base (see electronic supplementary material, figure S1). Neanderthal hyoid position reconstructions were considered more anatomically plausible if they fell within the boundaries set by the MH sample projected onto the Neanderthal skulls and vertebral column reconstructions (see below).
(ii). Neanderthal sample
The fossil sample consisted of CT scans (industrial and medical scanners, various sources) and surface laser scans (NextEngine 3D Scanner, accuracy 0.4–0.7 mm) of skulls and/or mandibles of eight adult (La Ferrassie, La Chapelle-aux-Saints, Gibraltar 1, Guattari, Shanidar 1, Abri Bourgeois, La Quina 9 and Regourdou) and one subadult (Le Moustier) specimen and one case of an adult hyoid (Kebara). CT scans and stereolithography interface format (STL) models were acquired from museum casts and reconstructions or—where possible—from original bones. In cases where the fossil specimens had not already been fully reconstructed and/or crucial pieces were missing, we conducted additional reconstructions. This was necessary in order to obtain the full set of measurements. Two types of reconstructions were applied. We added missing pieces using boundaries defined by the contour of the remaining bone material. This technique was useful to reconstruct a lost coronoid process or mandibular angle (gonion) or nasal bone (rhinion). For specimens consisting of partial mandibles or skulls, we used mirror image techniques to copy the surviving pieces. The mirrored pieces were then fitted together in the three-dimensional image space using anatomical expertise and a best-fit approach.
(iii). Computed tomography scan data processing, distance measurement definition and collection
From the CT scans, we segmented three-dimensional representations of the skull, mandible and—in the case of the MH reference sample—the hyoid bone. From the STL models, we simply produced three-dimensional surface representations. The software suite AMIRA (Visage Imaging) was used in both cases. We chose 35 standard osteological measurements describing face, cranial base and mandibular dimensions (see electronic supplementary material, table S1). On the MH sample, we also defined and collected 19 hyoid distance measurements (12 vertical and seven horizontal, see table 1), which describe the position of the hyoid in relation to landmarks on the mandible and skull, measured parallel or orthogonal to the Frankfurt plane. The reference point on the hyoid was always the posterior-most point in the mid-sagittal plane on the superior rim of the hyoid body. All measurements (both mandible and cranial dimensions and hyoid distance measurements) were collected after skulls were orientated in the Frankfurt plane, using the Software suite AMIRA (Visage Imaging) and TPSdig2 [53] for measurement collection.
Table 1.
Coefficients of determination (R2), expressed as a percentage, for all hyoid distance regression models in the adult human reference sample. SS, based on stepwise selection from skull-only set of possible independent variables; FS, based on stepwise variable selection from full set including mandible dimensions; bold type, models selected for further analysis according to best-fit criterion, subject to the requirement that the dependent and independent variables also reference landmarks, which survive and can be identified on the three-dimensional scans of the fossil skulls.
| orientation | area | distance | human R2 |
|---|---|---|---|
| vertical | mandible | hyoid–gonion | (FS) 78.3% |
| hyoid–condyle | (FS) 80.1% | ||
| hyoid–coronion | (FS) 79.8% | ||
| hyoid–infradentale | (FS) 97.4% | ||
| hyoid–gnathion | (FS) 88.5% | ||
| skull | hyoid–palatal plane | (FS) 64.9% | |
| hyoid–porion | (FS) 89.6% | ||
| hyoid–sella | (FS) 80.3% | ||
| hyoid–nasion | (FS) 88.5% | ||
| hyoid–prosthion | (FS) 96.9% | ||
| hyoid–ANS | (FS) 96.3% | ||
| hyoid–rhinion | (FS) 92.6% | ||
| horizontal | mandible | hyoid–gnathion | (FS) 75.1% |
| hyoid–infradentale | (FS) 69.5% | ||
| skull | hyoid–nasion | (FS) 41.9% | |
| hyoid–prosthion | (SS/FS) 91.5% | ||
| hyoid–basion | (FS) 66.0% | ||
| hyoid–PNS | (SS/FS) 58.0% | ||
| hyoid–ANS | (FS) 89.3% |
(iv). Human regression models and application to Neanderthal reconstructions
Neanderthal hyoid positions were reconstructed using prediction equations (multiple linear regression models) obtained in an analysis of the MH sample. From an original set of 19 such prediction equations we retained five to use in predicting Neanderthal hyoid position (i.e. the offset distances to a mid-sagittal hyoid landmark from a skull or mandible landmark/reference plane in the x and y axes, dorsoventral and cranio-caudal). Selection criteria for these five regression models were as follows: R2 values greater than 80 per cent, and all skull and mandible dimension measurements retained (following stepwise variable selection) as independent variables in the regression equations had to be based on landmarks which survived and could be identified on the three-dimensional scans of the fossil skulls.
We then used the predicted hyoid distances for two adult Neanderthal specimens (La Ferrassie and La Chapelle-aux-Saints (La Chapelle)) to reconstruct and visualize the Neanderthal three-dimensional hyoid position. This also served as a test to see whether predicted Neanderthal hyoid positions fell within the position envelopes observed in the MH sample in relation to skull and vertebral column. We did not have access to CT scans of Neanderthal cervical vertebrae; however, earlier studies show that humans and Neanderthals are very similar in overall cervical spine length [54,55]. Therefore, the largest male cervical spine including C1 to C6 from our in vivo human sample, was selected and used as a proxy for the Neanderthal visualizations. In the three-dimensional shape space, we placed the human cervical spine in the correct anatomical position and in contact with the cranial condyles under the Neanderthal skulls orientated in the Frankfurt plane. For the Neanderthal hyoid, we used an STL scan of the Kebara hyoid [10].
(b). Acoustic modelling
Simus_Neanderthals is a software modelling tool that allows evaluation of potential Neanderthal VT geometries in terms of estimates of the vowel space they can produce. It draws on previous data and software developed for modelling human speech articulation by Badin and co-workers (cf. [56]). The model is flexible, allowing a variety of hypotheses to be tested depending on the selected modelling parameters and assumptions. The output of the model is an estimate of the formant frequencies F1 and F2 of a vowel from a Neanderthal VT analogous to that specified by a given reference human VT. Modelling starts from the three-dimensional mesh models of Neanderthal bony anatomy of the skull, jaw and hyoid together with a human cervical spine sample as described above and shown in figure 1. The use of the human spine is discussed above.
Figure 1.

Three views of the Neanderthal mesh based on high-resolution CT scans of the fossil sample La Ferrassie. The hyoid bone mesh comes from an STL scan of the Kebara hyoid [10] and its location is based on the human reference equation as described in §3. The mesh of cervical spine is a scan of a human sample located within the Neanderthal mesh using anatomical landmarks as described in §2.
The location of the hyoid bone for the Neanderthal mesh and the degree of opening of the jaw are user-selectable parameters of the model, and choosing different positions for these features allows testing of hypotheses about the effect of varying their location on the acoustical output from the VT. To make the acoustical model, the mesh is first cut in the mid-sagittal plane. The resulting outline is plotted on an arbitrary reference grid with the lower edge of the upper incisors located at (x = 5, y = 10). The x-axis is oriented from anterior to posterior and approximately in the occlusal plane, and the y-axis from feet to head. A mid-sagittal section of a reference human skull, hyoid, jaw and spine is plotted on the same reference grid with the same orientation and incisor location as shown in figure 2. A reference human VT is associated with the reference human bony architecture.
Figure 2.

Mid-sagittal cross section through the Neanderthal mesh (red) and mid-sagittal cross section of corresponding modern human bony architecture (blue) with its associated modern human vocal tract (green). Black lines show the location of the 16 selected bony landmarks in each sample from which the transformation vectors are derived.
For the Neanderthal (N) and the reference human (R) cross sections, 16 landmarks are identified in the bony architecture to form a set of transformation vectors. Selection of the landmarks was based on the set of most clearly identifiable features within the bony architecture of the Neanderthal and the reference human. The set of landmarks consists of three points on the hard palate (one at the most anterior point, one at the most posterior and one midway in between), eight points on the anterior upper and lower corners of each cervical vertebra, one point on the lower margin of the skull (occipital condyle), three points on the hyoid bone (the most inferior point, the most posterior point and the centre of the area) and one landmark on the most superior point of the anterior mandible. The user may choose whether the landmarks are considered in groups or individually according to the preferred modelling assumptions. A spatial transformation vector from each R landmark to the corresponding N landmark is calculated. If landmarks have been grouped, the mean of the transformations for each landmark in the group is applied to all members of the group.
Next, the reference VT is divided into user-defined sections, and each section is associated with a landmark or group of landmarks. The decision regarding which section of the VT is associated with which landmark or group of landmarks forms a further set of modelling assumptions. Each section of the VT is then deformed, point by point, using the transformation for its associated landmark or landmark group. Following transformation, junctions between VT sections are linearly smoothed to eliminate any boundary discontinuities or abrupt geometry changes. A boundary condition preventing the tongue crossing the upper VT margin is also applied. These two processes are jointly referred to as boundary conditioning.
From the transformed VT, an area function is calculated by sectioning the VT into a sequence of short, contiguous, cylindrical tubes using a standard grid (e.g. [21,44]) and then applying the alpha-beta model of Soquet et al. ([57], p. 176, table 3) for an adult male to obtain estimates for the cross-sectional area of each tube based on the height of its sagittal section. Any completely occluded sections of the tract are then reset to a minimum area of 0.2 cm2. The output of this stage of the modelling process is the estimated N area function derived from the transformed R VT geometry. Linear acoustic modelling (e.g. [58]) is then applied to the area function giving an estimate of the formant frequencies for the Neanderthal analogue under the chosen set of modelling parameters and assumptions.
Table 3.
Summary of mean hyoid distances (in centimetres) between humans and Neanderthals. Significant differences p < 0.01 (i.e. 0.002, Bonferroni corrected) shown in italics; no other differences exceeded the Bonferroni-corrected p < 0.05 threshold. Mean observed human distances based on n = 20; mean predicted Neanderthal distances obtained from human regression models based on n = 3 for all distances except for hyoid–prosthion distance, n = 6. PP, palatal plane.
| mean distance | condyle (vertical) | porion (vertical) | PP (vertical) | rhinion (vertical) | prosthion (horizontal) |
|---|---|---|---|---|---|
| humans | 7.058 | 7.972 | 5.617 | 9.845 | 6.724 |
| Neanderthal | 7.81 | 8.081 | 4.516 | 10.643 | 8.296 |
| difference | 0.752 | 0.109 | −1.101 | 0.795 | 1.572 |
3. Results
(a). Results 1: Neanderthal vocal tract reconstruction
(i). Modal qualitative horizontal and vertical hyoid positions in human computed tomography reference sample
The empirically observed range of the adult human hyoid positions in our CT reference sample was recorded in relation to landmarks on the cranial base (horizontal offset) and cervical spine (vertical offset; figure 3). In the antero-posterior axis, the modal human position for the reference point on the hyoid body is found in a plane passing through the posterior nasal spine orthogonal to the Frankfurt horizontal (55% of the sample) or slightly (less than 5 mm) anterior or posterior to it (35%). This plane also bisects the mandible at the deepest point of the intercondylar notch. In the supero-inferior axis, the reference point on the hyoid body is mostly found aligned on a plane parallel to the Frankfurt horizontal that passes through the inferior endplate of cervical vertebra C3 (females) or the superior endplate of C4 (males).
Figure 3.

(a) Hyoid position as observed in the MH adult reference sample, and (b,c) as predicted for two adult Neanderthal specimens ((b) La Chapelle-aux-Saints; (c) La Ferrassie). The green shading shows the range of positions of the hyoid observed in the adult human reference sample, measured as vertical and horizontal offsets from skull base and cervical vertebral landmarks. The coloured images of the hyoid in the Neanderthal specimens are positioned as predicted from alternative human reference equations (tables 1 and 2; hyoid–condyle, blue; hyoid–porion, red; hyoid–palatal plane, yellow; hyoid–rhinion, purple). The predicted vertical offsets are shown in profile view in the left-hand column, and the predicted horizontal offset (estimated from the single-used regression model) is illustrated in plan view in the right-hand column.
(ii). Reconstructed Neanderthal hyoid position
The human regression models (tables 1 and 2) resulted in Neanderthal estimates with similar patterns of hyoid to skull and mandible distances as those observed in the human sample (table 3 and figure 3). We have also included vertical distances to hyoid from the palatal plane, although the fit of the regression model is quite poor in the human reference sample, because this is a plane that has been used for similar purposes in previous studies [41]. The predicted means for Neanderthal vertical hyoid distances were not significantly different to the observed mean distances in the adult human sample, but the predicted mean distances to the hyoid in the antero-posterior axis were significantly greater in Neanderthals (table 3).
Table 2.
Summary of multiple regression equations for the five hyoid position prediction models selected for further analysis. All five models were statistically significant at α = 0.001. Abbreviations: MFD, middle face depth; GOW, gonion width; OCWmd, oral cavity width (mandibular); ZMW, midface width; ANS–hormion, anterior nasal spine to hormion; THF, total face height; PAH, piriform aperture height; UFH, upper face height; FML, foramen magnum length; FL2, face length2; IOW, interorbital width; OFD, total face depth; PAW, piriform aperture width; OCL, oral cavity length; PHL1, oropharynx length1.
| hyoid distance | regression equation |
|---|---|
| condyle | = (1.399 × MFD) + (0.422 × GOW) + (−6.512) |
| porion | = (0.884 × MFD) + (0.539 × GOW) + (−0.412 × OCWmd) + (0.318 × ZMW) + (−4.259) |
| palatal plane | = (1.366 × ANS–hormion) + (−0.81 × OCWMd) + (−0.2) |
| rhinion | = (1.035 × THF) + (2.23 × PAH) + (−2.16 × UFH) + (1.055 × FML) + (−2.95) |
| prosthion | = (1.726 × FL2) + (1.427 × IOW) + (−1.519 × OFD) + (1.658 × PAW) + (−0.431 × OCL) + (0.326 × PHL1) + (1.087) |
For the subsequent acoustic analyses, we chose the most MH-like hyoid position as reconstructed using the hyoid–porion (cranio-caudal) and the hyoid-prosthion (dorsoventral) regression equations. The hyoid–porion model was chosen because it resulted in both the La Ferrassie and the La Chapelle-aux-Saints specimen in a cranio-caudal hyoid position which fell within the cranio-caudal hyoid position range in relation to the vertebral column observed in the MH sample, when this was projected onto the mid-sagittal plane in those two Neanderthal digital three-dimensional images of the skull and mandible (with the human vertebral column added as described in §2; see figure 3).
(iii). Visualization of reconstructed Neanderthal hyoid position
In La Chapelle, three-dimensional reconstruction of horizontal hyoid position (figure 3) based on the human reference equations places it within or very close to the range found in the human reference sample. Vertical distances fall within the distribution space of the human reference sample with the exception of hyoid–condyle and hyoid–rhinion. This reflects the weight given by those prediction equations to this fossil's very wide mandible (GOW) and long cranial base (FL2). The predicted horizontal hyoid distance of the La Ferrassie Neanderthal three-dimensional reconstruction (figure 3) based on the human reference equation is slightly anterior to the positions recorded in the human reference sample, reflecting this fossil skull's relatively long cranial base and oral cavity (which have negative weights in the reference human multiple regression equation). Vertically, the predicted hyoid distance is within the range for the human reference sample with the exception of hyoid–rhinion distance, which has an excessively high predicted value. This is because cranial dimensions in the regression model include total face height (THF), piriform aperture height (PAH) and upper face height (UFH), all of which contribute substantially to facial shape differences between humans and Neanderthals.
(b). Results 2: acoustic analysis
As an example of how the model may be used, we can consider a specific case study using the Neanderthal mesh from the La Ferrassie sample (shown previously in figures 1 and 3) and a MH reference. Three VT reference configurations will be considered, one for each of the quantal vowels /a/, /i/ and /u/ [22], which are considered to acoustically delimit the extremes of the attainable MH vowel space [59]. The output of the model is an estimate of the formants of the analogue of these vowels for the Neanderthal VT. The effect on the Neanderthal analogue of these vowels owing to varying the jaw opening and the hyoid position will be explored. Initially, the hyoid bone for the Neanderthal VT was placed in the location designated anatomically predicted (i.e. the position reconstructed using the hyoid–porion (cranio-caudal) and the hyoid–prosthion (dorsoventral) regression equations.). The 16 bony landmarks were grouped into six groups designated as palate tip (one landmark), palate mid (one landmark), palate back (one landmark), spine (nine landmarks), hyoid (three landmarks), and jaw (one landmark), respectively. The VT sections were associated with landmark groups as shown in figure 4. This figure represents the raw transformation prior to boundary smoothing and conditioning. The transformed mid-sagittal VT section for each of the vowels after boundary conditioning is shown in figure 5 together with the MH version used to obtain the transform.
Figure 4.

Association of VT sections for each quantal vowel with the bony landmark groups for the transformed VTs prior to boundary conditioning. Sections are associated with landmarks tip of palate (blue), mid of palate (red), back of palate (green), spine (cyan), hyoid (magenta) and jaw (violet), respectively.
Figure 5.

Transformed VT (blue) and original VT (green) for each of the quantal vowels /a/, /i/, and /u/ following boundary conditioning.
For each transformed VT, the area function was then calculated as described in the previous section. Examples are shown in figure 6a together with the corresponding MH area functions. Also calculated and shown in figure 6b are the acoustic transfer function estimates for the Neanderthal and MH VTs. These indicate the energy that would be transferred from laryngeal vibrations to the lips for each frequency and the peaks correspond approximately to the formant frequencies of the tract.
Figure 6.

(a) Area functions for MH and transformed (Neanderthal) VTs and (b) corresponding VT acoustic transfer functions. The peaks in the transfer function correspond to the formant frequencies for a given VT area function.
In figure 7, the red triangle shows the vowel space for the reference VT (MH) and the dark blue triangle shows the vowel space for the VT after transformation (N). The axes are the values of the formants F1 and F2 and are plotted on the Bark scale which ranges from 1 to 24 Barks, corresponding to the first 24 critical bands of MH hearing with the conversion from a frequency, f, to the equivalent value in Bark, b, given by:
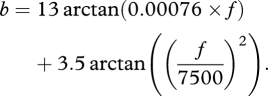 |
3.1 |
Figure 7.

Vowel space for: the MH reference (red); the Simus_Neanderthals prediction (blue) with the hyoid bone in the anatomically predicted location and the default jaw opening; the predictions of Lieberman & Crelin (green [28]) and the predictions of Boë et al. (deep pink [43]). The gold ellipses (shown partially) represent the regions of the vowel space covered by each of the datasets for American MH quantal vowels recorded by Peterson & Barney [27].
Note that implicit in this representation is an assumption that it is reasonable to plot the predicted Neanderthal formants on the Bark scale, which is based on the psychoacoustic perceptual capabilities of the MH ear. It is of course possible that a Neanderthal hearing system would have a different psychoacoustic profile and the Neanderthal would perceive these vowels differently to a MH.
The ellipses (shown partially in the figure) are based on the Peterson & Barney [27] data for the vowels /a/, /i/ and /u/, which show the range of typical F1 and F2 values for a sample of speakers of American English. It is notable that for the transformed VT, /i/ and /u/ have formants close to the human reference values, but /a/ does not. Also plotted in the figure are the Neanderthal vowel triangle estimates from the predictions of Lieberman & Crelin [28] and Boë et al. [43].
As an example of the effect of changing the modelling assumptions, figure 8 shows the effect on the vowel triangle of moving the hyoid bone from the location designated anatomically predicted to locations with coordinates ±0.5 cm in the x-direction and ±1.0 cm in the y-direction relative to the anatomically predicted location.
Figure 8.

Vowel space for: the MH reference (red); Simus_Neanderthals prediction with the hyoid bone in the anatomically predicted location (dark blue) and Simus_Neanderthals prediction with the hyoid bone displaced from the anatomically predicted location by: 1 cm superiorly and 0.5 cm anteriorly (pink), 1 cm superiorly and 0.5 cm posteriorly (mauve), 1 cm inferiorly and 0.5 cm posteriorly (grey-blue), 1 cm inferiorly and 0.5 cm anteriorly (pale blue). The jaw opening in each case is the default value and the gold ellipses (as in figure 7) represent the Peterson & Barney [27] data.
Figure 9 shows the effect on the predicted vowel triangle of opening the jaw a distance of −0.5, −1.0 and −1.5 cm in the y-direction relative to the position in the original mesh. The hyoid bone was at the anatomically predicted location for each of these trials.
Figure 9.

Vowel space for: the MH reference (red); Simus_Neanderthals prediction with the jaw in the default location (dark blue) and Simus_Neanderthals prediction with the jaw displaced inferiorly from the default location by: 0.5 cm (pink), 1 cm (mauve) and 1.5 cm (pale blue), respectively. The hyoid bone in each case was in the location designated anatomically predicted in §3 and the gold ellipses (as in figure 7) represent the Peterson & Barney [27] data.
For illustrative purposes, in the electronic supplementary material, we include three sound files of the simulated adult human quantal vowels /a/, /i/ and /u/ and three sound files of the simulated Neanderthal quantal vowels /a/, /i/ and /u/ (obtained for the hyoid position reconstruction designated anatomically predicted; see blue triangle, figure 7).
4. Discussion
Consistent with previous investigators [37,41], we have extrapolated soft tissue parameters of the Neanderthal VT from cranial and mandibular morphology, based on observations of their relationships in a human reference sample. Our results permit a reconstruction of the vertical position of the Neanderthal hyoid that places it within the range of empirically observed locations on this axis (the y-axis) in the human reference sample. However, our extrapolations of Neanderthal hyoid position in the antero-posterior axis (the x-axis) predict a distance to hyoid from the anterior margin of the oral cavity, which is significantly greater (by 1–2 cm) than in our human reference sample, and even then, the predicted location in relation to cranial base landmarks is further forward from the posterior pharyngeal wall than we would expect in a MH. This difference has also affected our acoustic analysis, since the reconstructed anterior placement of the hyoid relative to the posterior pharyngeal wall limits constriction of the pharyngeal cavity in the /a/ vowel articulation. We do not believe that we have discovered a key physical property of the Neanderthal VT in this respect: rather, this difference reflects the limitations of our method of using a MH reference sample given underlying differences in the morphology of the Neanderthal skull and mandible. MHs are characterized by greater facial flattening (shorter oral cavities), although the reasons for this remain unclear [60,61]. This places limits on fine-grained inference of hyoid-craniofacial hard tissue spatial relationships in a fossil species, when our living reference model (MHs) differs in global skull shape properties that determine the soft tissue reconstruction.
For our case study using Simus_Neanderthals, with the jaw in its default position and the hyoid in the anatomically predicted location, figure 7 shows that F1 and F2 are close to the MH range for both /u/ and /i/. F2 is also close to the MH range for /a/, but for this phoneme, F1 is significantly under-predicted. One reason for this may be the relatively larger pharyngeal cavity predicted for the N VT when compared with the MH VT, observable in the top left of figure 6. For /a/ Apostol et al. [23] show an affiliation between the Helmholtz resonance of the back cavity, and F1 that would, therefore, tend to lower values for larger pharyngeal volumes. On the other hand, Badin et al. [62] show that /a/ is a focal point, where F1 affiliation can equally be a quarter wavelength resonance of the front cavity for /a/ and may switch affiliation depending on the precise articulatory geometry adopted. It appears to be this affiliation to the front cavity that we are observing when, as the jaw opens, we see an increase in F1, consistent with the findings of Sundberg [63] for soprano singers. Figure 9 demonstrates this, although we were unable to find reasonable jaw opening widths that resulted in an F1 as high as that found in MHs. Further, in our case, as F1 increased with jaw opening, F2 increased above the Peterson & Barney [27] range for /a/.
Comparing our predictions with those of Lieberman & Crelin [28], neither our predictions nor those of Lieberman & Crelin produce a good match to a MH /a/ reference, but in our case, the value for F1 is significantly lower than expected, whereas their F1 compares well with the MH values. Their F2 prediction for /a/ gives a value higher than the MH range, whereas ours is within the ellipse. Comparing the area functions for /a/, the enlarged pharynx that we predict is not replicated in their model suggesting the basis for their acoustic prediction differs from ours, and perhaps has a different association between formants and cavities. The predictions of Boë et al. [43] are within the ellipses for all the quantal vowels. Clearly, the output of any given model is significantly dependent on the choice of modelling assumptions used to derive the VT geometry.
For our case study, figure 8 shows that moving the hyoid from a posterior to a more anterior position reduces F1 with the largest effect occurring for /i/, especially when the hyoid is also positioned low. Raising the hyoid also decreases F1, especially for /i/ when the hyoid is also positioned posteriorly. For F2, moving the hyoid to a more anterior position causes an increase in frequency, with a larger effect for /a/ when the hyoid is also raised, and raising the hyoid causes a small increase in frequency. No reasonable position for the hyoid bone increases F1 for /a/ sufficiently to give a good comparison with the MH data under this set of modelling assumptions.
Opening the jaw for a fixed hyoid location (figure 9) has little effect on F1 for /i/ or /u/, but does increase F1 for /a/ quite significantly although it is still not raised to MH frequencies. There is also an increase in F2 for both /u/ and /a/.
In figures 8 and 9, each predicted vowel triangle uses a fixed choice for hyoid location and jaw opening for all three phonemes. A best match between the vowel triangle for MH and N could perhaps be achieved by optimizing the pairing of jaw opening and hyoid location for each phoneme individually. Note that the predicted vowel triangle has corners that have the N analogue of the MH vowels. It may not be identical to the maximal vowel space for a Neanderthal VT, since vowels with formants closer to the MH /a/, /i/ and /u/ may be achievable from different MH reference tracts.
When considering the results of this case study, it should be remembered that the hyoid location designated anatomically predicted in §3 is in fact only one of a range of possible locations predicted by the regression analyses. Although we have examined the effects of some horizontal and vertical displacement of the hyoid from that predicted by the chosen regression equation, we have not yet conducted a systematic sensitivity analysis of the acoustic and articulatory implications of positioning the hyoid at locations estimated from alternative regression models. Additionally, Simus_Neanderthals has a number of fixed parameters that may influence the outcome of the acoustical predictions. The 16 bony landmarks were chosen as identifiable locations observable in both the MH and N mid-sagittal cuts through the mesh. We have not been able to test whether this set is in any way either necessary or sufficient to achieve an optimum set of transformation vectors. We have chosen to use linear smoothing after VT transformation. No test has been made of smoothing algorithms other than linear, although the choice of smoothing method will affect the detail of the VT shape to some extent. Further, since anatomical considerations point to a smooth VT outline, it might be argued that the need to smooth at all is a facet of an inadequate transformation process. A similar case might be made regarding the hard constraint required to keep the tongue within the VT boundaries and the need to adjust for a minimum VT area when transformation predicts complete occlusion of the tract. Our treatment of these unrealistic predictions has been largely pragmatic and based on typical methods used in modern articulatory models. Further analysis of the sensitivity of the transformation to landmark choice and smoothing process should be undertaken. The VT area functions are calculated using the male adult alpha-beta from Soquet et al.'s [57] paper. In the absence of soft tissue data from Neanderthals, this seems a reasonable choice, although other parameter sets could be used if preferred. As well as the fixed parameters, there are a number of user-selectable parameters: in particular, relating to how bony landmarks are grouped and how sections of the MH VT are associated with them to define their transformation vectors. There is scope for a systematic study of the effect of different groupings and affiliations on the estimates of the formants.
The options for further exploration with the Simus_Neanderthals model are wide. We envisage studies with meshes from scans of other Neanderthal fossils, and systematic studies of the effects of different combinations of modelling assumptions and parameter choices on VT acoustic outputs. We should emphasize that we view the model as a tool for hypothesis testing rather than as a definitive answer to the question of Neanderthal VT anatomy. It offers the opportunity for an incremental approach to the question of speech potential in fossil hominins and moves away from the more categorical approach found in much of the historical literature.
Acknowledgements
We are very grateful to Frédéric Richard and Françoise Tilotta for access to the human head-and-neck CT scans; C. Stringer, C. Soligo, L. Bondioli and NESPOS for access to Neanderthal specimen CT scans; Rob Kruszynski for support accessing the hominin collection at the NHM; E. Lewitus, I. de Groote and K. Balolia for assistance with producing STL scans; and to Pierre Badin for permission to use existing data and software resources for developing Simus_Neanderthals. We also thank the two referees who both provided very helpful comments on an earlier draft. This research was supported by the European Commission in a grant to the HANDTOMOUTH project (FP6, Contract no. 29065, NEST-2004-PATH-HUMAN).
Endnote
The fossil specimens matched with the non-human primate/neonatal human/Neanderthal condition included australopithecines (Australopithecus africanus, Paranthropus robustus, Paranthropus boisei), and also other classic Neanderthal specimens (Saccopastore 1, Monte Circeo, Teshik-Tash infant, La Ferrassie 1, La Quina infant, Pech-de-l'Azé, Shanidar 1), as well as Solo 2. The fossil specimens matched with the adult human condition included Steinheim, Broken Hill, Skhul 5, Djebel Qafzeh and Cro-Magnon ([29], p. 83).
References
- 1.Arbib M. A. 2006. Aphasia, apraxia and the evolution of the language-ready brain. Aphasiology 20, 1125–1155 10.1080/02687030600741683 (doi:10.1080/02687030600741683) [DOI] [Google Scholar]
- 2.Roy A., Arbib M. 2005. The syntactic motor system. Gesture 5, 7–37 10.1075/gest.5.1.03roy (doi:10.1075/gest.5.1.03roy) [DOI] [Google Scholar]
- 3.Kirby S. 2000. Syntax without natural selection: how compositionality emerges from vocabulary in a population of learners. In The evolutionary emergence of language: social function and the origins of linguistic form (ed. Knight C.), pp. 303–323 Cambridge, UK: Cambridge University Press [Google Scholar]
- 4.Kirby S., Dowman M., Griffiths T. 2007. Innateness and culture in the evolution of language. Proc. Natl Acad. Sci. USA 104, 5241–5245 10.1073/pnas.0608222104 (doi:10.1073/pnas.0608222104) [DOI] [PMC free article] [PubMed] [Google Scholar]
- 5.Corballis M. C. 2003. Out on a limb. Laterality 8, 195–200 [Google Scholar]
- 6.Corballis M. C. 2003. From mouth to hand: gesture, speech, and the evolution of right-handedness. Behav. Brain Sciences 26, 199–260 [DOI] [PubMed] [Google Scholar]
- 7.Steele J., Uomini N. T. 2005. Humans, tools and handedness. In Stone knapping: the necessary conditions for a uniquely hominin behaviour (eds Roux V., Bril B.), pp. 217–239 Cambridge, UK: McDonald Institute for Archaeological Research [Google Scholar]
- 8.Steele J., Uomini N. 2009. Can the archaeology of manual specialization tell us anything about language evolution? A survey of the state of play. Camb. Archaeol. J. 19, 97–110 10.1017/S0959774309000067 (doi:10.1017/S0959774309000067) [DOI] [Google Scholar]
- 9.Uomini N. T. 2010. Handedness in Neanderthals. In Neanderthal lifeways, subsistence and technology (eds Conard N. J., Richter J.). Heidelberg, Germany: Springer [Google Scholar]
- 10.Arensburg B., Tillier A. M., Vandermeersch B., Duday H., Rak Y. 1989. A middle Palaeolithic human hyoid bone. Nature 338, 758–760 10.1038/338758a0 (doi:10.1038/338758a0) [DOI] [PubMed] [Google Scholar]
- 11.Martínez I., Arsuaga J.-L., Quam R., Carretero J.-M., Gracia A., Rodríguez L. 2008. Human hyoid bones from the middle Pleistocene site of the Sima de los Huesos (Sierra de Atapuerca, Spain). J. Hum. Evol. 54, 118–124 10.1016/j.jhevol.2007.07.006 (doi:10.1016/j.jhevol.2007.07.006) [DOI] [PubMed] [Google Scholar]
- 12.Maclarnon A., Hewitt G. 2004. Increased breathing control: another factor in the evolution of human language. Evol. Anthropol. 13, 181–197 10.1002/evan.20032 (doi:10.1002/evan.20032) [DOI] [Google Scholar]
- 13.Krause J., et al. 2007. The derived FOXP2 variant of modern humans was shared with Neanderthals. Curr. Biol. 17, 1908–1912 10.1016/j.cub.2007.10.008 (doi:10.1016/j.cub.2007.10.008) [DOI] [PubMed] [Google Scholar]
- 14.Gibson K. R., Ingold T. (eds) 1993. Tools, language and cognition in human evolution. Cambridge, UK: Cambridge University Press [Google Scholar]
- 15.Greenfield P. M. 1991. Language, tools and brain: the ontogeny and phylogeny of hierarchically organized sequential behavior. Behav. Brain Sci. 14, 531–550 10.1017/S0140525X00071235 (doi:10.1017/S0140525X00071235) [DOI] [Google Scholar]
- 16.Ambrose S. H. 2001. Paleolithic technology and human evolution. Science 291, 1748–1753 10.1126/science.1059487 (doi:10.1126/science.1059487) [DOI] [PubMed] [Google Scholar]
- 17.Camps M., Uriagereka J. 2006. The Gordian Knot of linguistic fossils. In The biolinguistic turn. Issues on language and biology (eds Rosselló J., Martín J.), pp. 34–65 Barcelona, Spain: Universitat de Barcelona [Google Scholar]
- 18.Pastra K., Aloimonos Y. 2011. The minimalist grammar of action. Phil. Trans. R. Soc. B 367, 103–117 10.101098/rstb.2011.0123 (doi:10.101098/rstb.2011.0123) [DOI] [PMC free article] [PubMed] [Google Scholar]
- 19.Stout D., Chaminade T. 2011. Stone tools, language and the brain in human evolution. Phil. Trans. R. Soc. B 367, 75–87 10.101098/rstb.2011.0099 (doi:10.101098/rstb.2011.0099) [DOI] [PMC free article] [PubMed] [Google Scholar]
- 20.Lieberman P. 1975. On the origins of language. New York, NY: Macmillan [Google Scholar]
- 21.Fant G. 1960. Acoustic theory of speech production, 2nd edn The Hague, The Netherlands: Mouton [Google Scholar]
- 22.Stevens K. N. 1989. On the quantal nature of speech. J. Phonetics 17, 3–46 [Google Scholar]
- 23.Apostol L., Perrier P., Bailly G. 2004. A model of acoustic interspeaker variability based on the concept of formant-cavity affiliation. J. Acoust. Soc. Am. 115, 337–351 10.1121/1.1631946 (doi:10.1121/1.1631946) [DOI] [PubMed] [Google Scholar]
- 24.Lieberman P., Crelin E. S. 1971. On the speech of the Neanderthal man. Linguist. Inquiry 2, 203–222 [Google Scholar]
- 25.Lieberman P. H., Crelin E. S., Klatt D. H. 1972. Phonetic ability and related anatomy of the newborn and adult human, Neanderthal man, and the chimpanzee. Am. Anthropol. 74, 287–307 10.1525/aa.1972.74.3.02a00020 (doi:10.1525/aa.1972.74.3.02a00020) [DOI] [Google Scholar]
- 26.Henke W. L. 1966. Dynamic articulatory model of speech production using computer simulation. PhD thesis, MIT, Cambridge, MA [Google Scholar]
- 27.Peterson G. E., Barney H. L. 1952. Control methods used in a study of vowels. J. Acoust. Soc. Am. 24, 175–184 10.1121/1.1906875 (doi:10.1121/1.1906875) [DOI] [Google Scholar]
- 28.Lieberman P., Crelin E. S. 1971. On the speech of Neanderthal man. Linguistic Inquiry 2, 203–222 [Google Scholar]
- 29.Lieberman P. 1973. On the evolution of language: a unified view. Cognition 2, 59–94 [Google Scholar]
- 30.Takemoto H. 2001. Morphological analyses of the human tongue musculature for three-dimensional modeling. J. Speech Lang. Hear Res. 44, 97–107 10.1044/1092-4388(2001/009) (doi:10.1044/1092-4388(2001/009)) [DOI] [PubMed] [Google Scholar]
- 31.Takemoto H. 2008. Morphological analyses and 3D modeling of the tongue musculature of the chimpanzee (Pan troglodytes). Am. J. Primatol. 70, 966–975 10.1002/ajp.20589 (doi:10.1002/ajp.20589) [DOI] [PubMed] [Google Scholar]
- 32.Nishimura T., Mikami A., Suzuki J., Matsuzawa T. 2006. Descent of the hyoid in chimpanzees: evolution of face flattening and speech. J. Hum. Evol. 51, 244–254 10.1016/j.jhevol.2006.03.005 (doi:10.1016/j.jhevol.2006.03.005) [DOI] [PubMed] [Google Scholar]
- 33.Nishimura T., Mikami A., Suzuki J., Matsuzawa T. 2007. Development of the laryngeal air sac in chimpanzees. Int. J. Primatol. 28, 483–492 10.1007/s10764-007-9127-7 (doi:10.1007/s10764-007-9127-7) [DOI] [Google Scholar]
- 34.Nishimura T., Oishi T., Suzuki J., Matsuda K., Toshimitsu T. 2008. Development of the supralaryngeal vocal tract in Japanese macaques: implications for the evolution of the descent of the larynx. Am. J. Phys. Anthropol. 135, 182–194 10.1002/ajpa.20719 (doi:10.1002/ajpa.20719) [DOI] [PubMed] [Google Scholar]
- 35.Nishimura T. 2003. Comparative morphology of the hyo-laryngeal complex in anthropoids: two steps in the evolution of the descent of the larynx. Primates 44, 41–49 10.1007/s10329-002-0005-9 (doi:10.1007/s10329-002-0005-9) [DOI] [PubMed] [Google Scholar]
- 36.Nishimura T. 2005. Developmental changes in the shape of the supralaryngeal vocal tract in chimpanzees. Am. J. Phys. Anthropol. 126, 193–204 10.1002/ajpa.20112 (doi:10.1002/ajpa.20112) [DOI] [PubMed] [Google Scholar]
- 37.Laitman J. T., Heimbuch R. C., Crelin E. S. 1979. The basicranium of fossil hominids as an indicator of their upper respiratory systems. Am. J. Phys. Anthropol. 51, 15–34 10.1002/ajpa.1330510103 (doi:10.1002/ajpa.1330510103) [DOI] [PubMed] [Google Scholar]
- 38.Laitman J., Riedenberg J. 1993. Specializations of the human upper respiratory and upper digestive systems as seen through comparative and developmental anatomy. Dysphagia 8, 318–325 (doi:10.1007/BF01321770) [DOI] [PubMed] [Google Scholar]
- 39.Lieberman D. E., McCarthy R. C. 1999. The ontogeny of cranial base angulation in humans and chimpanzees and its implications for reconstructing pharyngeal dimensions. J. Hum. Evol. 36, 487–517 10.1006/jhev.1998.0287 (doi:10.1006/jhev.1998.0287) [DOI] [PubMed] [Google Scholar]
- 40.Lieberman D. E., McCarthy R. C., Hieemae K. M., Palmer J. B. 2001. Ontogeny of postnatal hyoid and larynx descent in humans. Arch. Oral Biol. 46, 117–128 10.1016/S0003-9969(00)00108-4 (doi:10.1016/S0003-9969(00)00108-4) [DOI] [PubMed] [Google Scholar]
- 41.Boë L.-J., Heim J.-L., Honda K., Maeda S. 2002. The potential Neanderthal vowel space was as large as that of modern humans. J. Phonetics 30, 465–484 10.1006/jpho.2002.0170 (doi:10.1006/jpho.2002.0170) [DOI] [Google Scholar]
- 42.Maeda S. 1989. Compensatory articulation during speech: evidence from the analysis and synthesis of vocal-tract shapes using an articulatory model. In Speech production and modelling (eds Hardcastle W. J., Marchal A.), pp. 131–149 Dordrecht, The Netherlands: Kluwer Academic [Google Scholar]
- 43.Boë L., Heim J., Honda K., Maeda S., Badin P., Abry C. 2007. The vocal tract of newborn humans and Neanderthals: acoustic capabilities and consequences for the debate on the origin of language. A reply to Liberman (2007a). J. Phonetics 35, 564–581 10.1016/j.wocn.2007.06.006 (doi:10.1016/j.wocn.2007.06.006) [DOI] [Google Scholar]
- 44.Badin P., Fant G. 1984. Notes on vocal tract computations. KTH Speech Transm. Lab. Q. Prog. Status Rep. 2–3, 53–108 [Google Scholar]
- 45.Heim J.-L. 1990. La nouvelle reconstitution du crâne néandertalien de la Chapelle-aux-Saints. Méthode et résultats. Bull. Mém. Soc. Anthropol. Paris 6, 94–117 [Google Scholar]
- 46.de Boer B., Fitch W. T. 2010. Computer models of vocal tract evolution: an overview and critique. Adapt. Behav. 18, 36–47 10.1177/1059712309350972 (doi:10.1177/1059712309350972) [DOI] [Google Scholar]
- 47.Maeda S. 1989. Compensatory articulation during speech: evidence from the analysis and synthesis of vocal-tract shapes using an articulatory model. In Speech production and modelling (eds Hardcastle W. J., Marchal A.), pp. 131–149 Boston, MA: Kluwer Academic [Google Scholar]
- 48.de Boer B. 2009. Why women speak better than men (and its significance for evolution). In The prehistory of language (eds Botha R., Knight C.), pp. 255–265 Oxford, UK: Oxford University Press [Google Scholar]
- 49.de Boer B. 2010. Investigating the acoustic effect of the descended larynx with articulatory models. J. Phonetics 38, 679–686 10.1016/j.wocn.2010.10.003 (doi:10.1016/j.wocn.2010.10.003) [DOI] [Google Scholar]
- 50.Mermelstein P. 1973. Articulatory model for the study of speech production. J. Acoust. Soc. Am. 53, 1070–1082 10.1121/1.1913427 (doi:10.1121/1.1913427) [DOI] [PubMed] [Google Scholar]
- 51.Kelly J. L., Jr, Lochbaum C. C. 1973. Speech synthesis. In Speech synthesis (eds Flanagan J. L., Rabiner L. R.), pp. 127–130 Stroudsburg, PA: Dowden, Hutchison & Ross, Inc [Google Scholar]
- 52.Tilotta F., Richard F., Glaunès J., Berar M., Gey S., Verdeille S., Rozenholc Y., Gaudy J.-F. 2009. Construction and analysis of a head CT-scan database for craniofacial reconstruction. Forensic Sci. Int. 191, 112.e111–112.e112 10.1016/j.forsciint.2009.06.017 (doi:10.1016/j.forsciint.2009.06.017) [DOI] [PubMed] [Google Scholar]
- 53.Rohlf F. J. tpsDig v. 2.10. 2006. See http://life.bio.sunysb.edu/morph/soft-dataacq.html. [Google Scholar]
- 54.Stewart T. D. 1962. Neanderthal cervical vertebrae—with special attention to the Shanidar Neanderthals from Iraq. Bibl. Primatol. 1, 130–154 [Google Scholar]
- 55.Gómez-Olivencia A., Carretero J. M., Arsuaga J. L., Rodríguez-García L., García-González R., Martínez I. 2007. Metric and morphological study of the upper cervical spine from the Sima de los Huesos site (Sierra de Atapuerca, Burgos, Spain). J. Hum. Evol. 53, 6–25 (doi:10.1016/j.jhevol.2006.12.006) [DOI] [PubMed] [Google Scholar]
- 56.Badin P., Serrurier A. 2006. Three-dimensional linear modeling of tongue: articulatory data and models. In Proc. 7th Int. Seminar on Speech Production, Ubatuba, Brazil, 13–15 December 2006, pp. 395–402 [Google Scholar]
- 57.Soquet A., Lecuit V., Metens T., Demolin D. 2002. Mid-sagittal cut to area function transformations: direct measurements of mid-sagittal distance and area with MRI. Speech Commun. 36, 169–180 10.1016/S0167-6393(00)00084-4 (doi:10.1016/S0167-6393(00)00084-4) [DOI] [Google Scholar]
- 58.Maeda S. 1982. A digital simulation method of the vocal-tract system. Speech Commun. 1, 199–229 10.1016/0167-6393(82)90017-6 (doi:10.1016/0167-6393(82)90017-6) [DOI] [Google Scholar]
- 59.Liljencrants J., Lindblom B. 1972. Numerical simulation of vowel quality systems: the role of perceptual contrast. Language 48, 839–862 [Google Scholar]
- 60.Lieberman D. E. 2008. Speculations about the selective basis for modern human craniofacial form. Evol. Anthropol. 17, 55–68 10.1002/evan.20154 (doi:10.1002/evan.20154) [DOI] [Google Scholar]
- 61.Trinkaus E. 2003. Neanderthal faces were not long; modern human faces are short. Proc. Natl Acad. Sci. USA 100, 8142–8145 10.1073/pnas.1433023100 (doi:10.1073/pnas.1433023100) [DOI] [PMC free article] [PubMed] [Google Scholar]
- 62.Badin P., Perrier P., Boë L.-J., Abry C. 1990. Vocalic nomograms: acoustic and articulatory considerations upon formant convergences. J. Acoust. Soc. Am. 87, 1290–1300 10.1121/1.398804 (doi:10.1121/1.398804) [DOI] [Google Scholar]
- 63.Sundberg J. 1977. Acoustics of the singing voice. Sci. Am. 236, 82–100 10.1038/scientificamerican0377-82 (doi:10.1038/scientificamerican0377-82) [DOI] [PubMed] [Google Scholar]