Abstract
Exposure of black carbon (BC) is associated with a variety of adverse health outcomes. A number of optical methods for estimating BC on Teflon filters have been adopted but most assume all light absorption is due to BC while other sources of colored particulate matter exist. Recently, a four-wavelength-optical reflectance measurement for distinguishing second hand cigarette smoke (SHS) from soot-BC was developed (Brook et al., 2010; Lawless et al., 2004). However, the method has not been validated for soot-BC nor SHS and little work has been done to look at the methodological issues of the optical reflectance measurements for samples that could have SHS, BC, and other colored particles. We refined this method using a lab-modified integrating sphere with absorption measured continuously from 350 nm to 1000 nm. Furthermore, we characterized the absorption spectrum of additional components of particulate matter (PM) on PM2.5 filters including ammonium sulfate, hematite, goethite, and magnetite. Finally, we validate this method for BC by comparison to other standard methods. Use of synthesized data indicates that it is important to optimize the choice of wavelengths to minimize computational errors as additional components (more than 2) are added to the apportionment model of colored components. We found that substantial errors are introduced when using 4 wavelengths suggested by Lawless et al. to quantify four substances, while an optimized choice of wavelengths can reduce model-derived error from over 10% to less than 2%. For environmental samples, the method was sensitive for estimating airborne levels of BC and SHS, but not mass loadings of iron oxides and sulfate. Duplicate samples collected in NYC show high reproducibility (points consistent with a 1:1 line, R2 = 0.95). BC data measured by this method were consistent with those measured by other optical methods, including Aethalometer and Smoke-stain Reflectometer (SSR); although the SSR looses sensitivity at filter loadings above 90 ng/mm2. Furthermore, positive correlations (R2 = 0.7) were observed between EC measured by NIOSH Method 5040 on quartz filters and BC measured in co-located Teflon filter samples collected from both heating and non-heating seasons. Overall, the validation data demonstrates the usefulness of this method to evaluate BC from archived Teflon filters while potentially providing additional component information.
1. Introduction
Multiple acute and chronic adverse health effects occur in association with exposure to black carbon (BC). Most of the health studies related to inhalation of BC have focused on exposures to diesel exhaust particles, an important urban source of BC worldwide. Recent studies suggest that traffic-related pollutants, especially fine particulate (PM) components of particles such as BC are associated with various health outcomes, including eye, throat and bronchial irritation (USEPA, 2002), respiratory (Bell et al., 2009; USEPA, 2002) and asthma symptoms (Diaz-Sanchez et al., 1999; Patel et al., 2009; Riedl & Diaz-Sanchez, 2005; Spira-Cohen et al., 2010), lung cancer (Garshick et al., 1987, 1988; Steenland et al., 1992; Steenland et al., 1990) and cardiovascular outcomes (Bell et al., 2009; Mills et al., 2005). Animal studies have suggested that soot particles themselves, independent from absorbed organic compounds, can be a casual agent of carcinogenesis (Heinrich et al., 1995; Mauderly et al., 1994).
BC is a generic term used to refer to particles formed naturally or anthropogenically through incomplete combustion of fossil fuels, biofuels, or biomass (e.g., grass, wood, dung). The black carbon definition has evolved with time to be seen as a continuum that represents combustion byproducts ranging from charred materials that retain structural information of the original fuel materials to highly condensed refractory soot. Different physical (particle size), chemical, thermal and/or optical approaches have been employed to separate non-combustion organic carbon and char from soot-BC. Although soot-BC is often referred to as being primarily elemental carbon in the form of graphite, it typically includes proportions of other atoms, as well as condensed or sorbed organics such as polycyclic aromatic hydrocarbons (PAHs).
There are intensive debates about the analytical methods for measuring soot-BC in both aerosols and sediments. In aerosols, common methods for the measurement of soot-BC include thermo-optical and optical methods. Thermo-optical methods have been widely used in measuring total carbon, organic carbon (OC), and element carbon (EC) on ambient quartz-fiber filter samples by heating a punch of filters in a continuous or stepwise temperature program under different gases. Carbon dioxide is produced through the oxidation of carbons species released from the filters in an oven immediately downstream from the primary oven and then reduced to methane before passing into a flame ionization detector (FID). Temperature and/or the amount of light transmitted through filters are used to split the OC from the more recalcitrant EC. In order to facilitate inter-laboratory comparison, the National Institute for Occupational Safety and Health (NIOSH) published Method 5040 (NIOSH, 1998) and since its publication, it has been widely used in environmental and health studies (Fromme et al., 2005; Seshagiri & Burton, 2003).
Optical measurement methods, which are nondestructive and inexpensive, take advantage of the strong absorption ability of BC across all wavelengths. The aethalometer, which is the most-widely-used instrument for real-time measurement of BC was introduced by Hansen et al. (1984). Because most air particles, except BC, absorb weakly in near-infrared region, the original aethalometer was designed to detect BC levels using a single wavelength around 880 nm (Hansen et al., 1984). Particles trapped within a three-dimensional quartz-paper tape can create complex scattering effects of the incident beam (Ballach et al., 2001). These scattering effects can also lead to errors in BC determination if scattered light is primarily attributed to absorption. To minimize filter matrix effects, Ballach et al. (2001) developed a technique by immersing the filter in a fluid that matches the index of refraction of the filter fibers. Because scattering is strongly affected by the difference of indices of refraction at the media interfaces, the filter scattering contribution is sharply reduced in comparison with the absorptive characteristics of the particles (Ballach et al., 2001). However, this method immerses the sample PM with oil, causing contamination and possible leaching of PM components.
In addition to BC measurement, efforts have been made for differentiating BC from other PM sources using optical absorbing techniques. A recent version of the aethalometer added the ability to measure absorbance in shorter wavelengths (370 nm) in order to determine woodsmoke emissions (Sandradewi et al., 2008). However, BC and woodsmoke emissions are not the only particles that absorbed strongly at 370 nm. Another common optical method used in health studies is the Smoke-stain Reflectometer (SSR) to quickly evaluate BC amounts collected on filters by the reflection method using a white light source and a simple detector (Kinney et al., 2000; Lena et al., 2002). This method assumes that light at any wavelength is absorbed only by BC. Prior work (Edwards et al., 1983, and reference therein) has demonstrated that SSR measurements can be a good proxy for elemental carbon concentrations in PM filters; however, the standard EXPOLIS method for using the SSR has the device directly touching the PM on the active area of the filter and measures the filter in five locations, leading to potential mass loss and/or cross contamination. To overcome contamination issues, the Columbia University group designed and successfully applied a filter holder that touches only the outer plastic ring, holding the filter in a fixed flat geometry and 2.5 mm away from the head of the SSR (Kinney et al., 2002; van Vliet & Kinney, 2007). Since the reflectance values are sensitive to the distance of the device to the filter, the Columbia group reports their values with an asterisk to indicate they are modified reflectance and absorbance values.
Recently, a four-wavelength-optical reflectance measurement for distinguishing second hand cigarette smoke (SHS) from soot-BC has been implemented in several studies (Brook et al., 2010; Lawless et al., 2004; Rodes et al., 2010). This method assumes that the entire absorption of a sample is due to the absorption from two types of colored particulate matter- soot-BC and SHS, with SHS primarily having strong absorbance in lower wavelengths of the visible spectrum (yellow-brown color of cigarette smoke) while soot-BC absorbs strongly at all wavelengths. However, the method has not been validated for soot-BC nor SHS and little work has been done to look at the methodological issues of the optical reflectance measurements for samples that could have SHS, BC, and other colored particles. In particular, the presence of non-carbonaceous light-absorbing aerosol components such as soil dust (mainly iron oxides), are reported to be able to play a significant role even in locations quite distant from desert regions (Fialho et al., 2005).
The overall research goal of this study is to extend the Lawless et al (2004) method to be able to distinguish more components and also validate its use. Advantages of our method is that is a rapid, non-destructive, contamination-free method for estimating BC, SHS and iron oxide exposures. For preventing matrix effects from filter materials, an integrating sphere is used with a newly designed interface between the filter and integrating sphere that minimizes light loss, increases the sensitivity and reliability while minimizing any potential contamination of the filter for subsequent analyses. The optical response of additional end-members, including several iron-containing particle sources, were characterized and incorporated into apportionment models. A novel “step-by-step zoom in” approach for finding the best-fit point was developed. This method allows for a rapid but thorough search for the best fit of the combination of various PM sources. For validating this method, we compared BC levels obtained using our multi-wavelength method for filters collected in New York City to other methods including thermo-optical method for elemental carbon and the smoke stain reflectometer for absorbance. The validation of this optical method for determination of second hand smoke levels will be reported in another article.
2. Methods
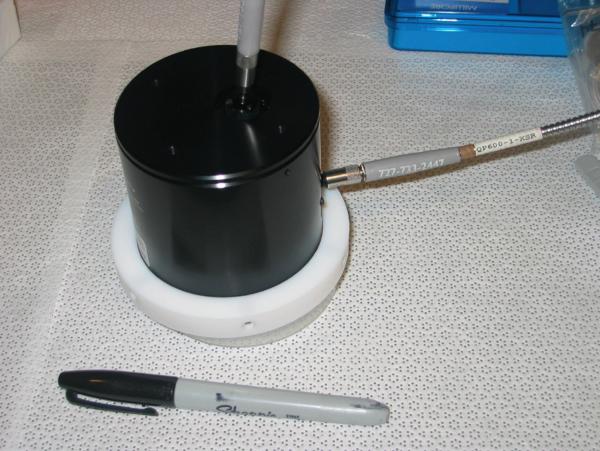
The optical device used for measuring BC and SHS levels consists of a balanced deuterium tungsten halogen light source (DH-2000-BAL), an integrating sphere (ISP-50-8-R), a lab-made filter holder, and an Ocean Optics USB4000-VIS-NIR miniature fiber-optic spectrometer. The light source was designed to supply a well-balanced spectrum from 210–2000 nm while the spectrometer was configured to detect from 345 to 1040 nm. The integrating sphere consists of sintered Teflon with a spherical cavity and has relatively two small holes (8 mm) as needed for entrance (light in) and exit (detector) ports. The excitation input is angled at 8° and collimates the fiber input before introduction into the sphere (Fig. 1). The output port is angled at 90° (to connect to a spectrometer). Due to the highly reflective nature of the sintered Teflon, light is distributed evenly to all directions inside of the sphere and the majority of light loss is due theoretically to the absorption of particles on the Teflon filters at the sample port. To reduce light loss due to the black bottom of integrating sphere, a highly reflective white coat (BaSO4) was painted to the bottom, which was then covered by a thin translucent layer (~1.5 mm) of white Teflon for preventing any potential flaking of BaSO4 overtime (Fig. 1). The filter holder is designed to hold the filter flat by the support ring of the Teflon filter, with no physical contact of the PM on the active area of the filter, and to reflect light passing through the filter back into the integrating sphere by putting a reflective Teflon surface behind the filter. Teflon filters from different manufacturer's lots (Pall Corporation) may have slight difference in background and absorbance tendency; for minimizing this effect, blank filters from the same manufacturer's lot number are used as white reference.
Figure 1.
The modified integrating sphere showing the fiber optical cables with light in at 8° off perpendicular and detector cable at 90°. A reflective white layer of BaSO4 was painted onto the bottom flat surface of the integrating sphere to minimize the loss of light interactive with the black enamel. To avoid flaking of this paint over time, a thin translucent layer of white Teflon (1.5 mm) was added to the bottom of the sphere (with a port to allow light in and out).
2.1 The collection of end-member standards
Kerosene soot and side-stream cigarette smoke were collected onto filters as pure component standards of BC and SHS, respectively. All component standards were collected on pre-weighed 37 mm Teflon filters (Pall, R2PJ037, 2.0 μm pore size) at 1.5 LPM using BGI triplex cyclones with a PM2.5 cut point. A combustion chamber (24 in × 24 in × 36 in) was designed to produce and capture combustion emissions from either a lamp oil burner or side-stream smoke from cigarettes (Marlboro LightsTM) with certain dilutions controlled by fluxes of the filtered air introduced into the chamber. For simulating a natural smoking situation, a handpump was used to generate a mainstream puff with a duration of 2–3 s and a puff interval of 40–60s, similar to conditions suggested by International Organization for Standardization standard ISO 3308 (ISO, 1999). Burning time, dilution ratios, and collection time were adjusted to obtain appropriate range of mass loadings onto filters. The color on collected filters (BC –black and SHS-yellow) also may be used to approximate the relatively mass loadings on filters, ensuring a wide range of mass loadings on each set of filters achieved. Collected samples were post-weighted after being aired in the HEPA filtered, temperature/humidity controlled weighing chamber (72±2°F; 40±2% relative humidity) for at least 24 hrs. For the SHS filters, filters were allowed to equilibrate for at least one week to allow the degassing of most volatile materials. Goethite (FeO(OH)), hematite (Fe2O3), magnetite (FeO·Fe2O3), and ammonium sulfate ((NH4)2SO4) were suspended in plastic chambers using filtered compressed air and their fine particles were collected onto 37 mm Teflon filters using cyclones with a PM2.5 cut point. Iron/sulfur- containing minerals are often the major components of aerosol particles and generally represent more than 50% of total PM2.5 mass in Eastern US (Kinney et al., 2005).
2.2 Apportionment model for colored components
Optical density (negative natural logarithm of the transmissivity) between 350 to 1000 nm was calculated and curves were fit to the resulting plots of filter loading (ng/mm2) vs. optical density to be able to predict optical density for any loading of selected components following the method of Lawless et al. (2004). Then an optimization algorithm was established to determine a filter's mass apportionment between different components. The data processing was automated in Matlab, utilizing an optimization algorithm to determine a filter's mass apportionment. The program compares the optical data from the filter to that of the various possible mass apportionment scenarios and reports the best fit. For a given mass-apportionment scenario (such as BC=50 ng/mm2 and ETS=100 ng/mm2), the program sums the OD-contribution for each of the components to arrive at a set of predicted OD-values, one for each user-specified wavelength. Such that for the ith user-specified wavelength, λi, (of n total user-specified wavelengths):
where the end-member contributions are computed from the aforementioned fitting curves. The optimization is based on a sum-of-squares parameter, SS, which compares each set of predicted OD-values to the values extracted from the filter's OD-curve at the same wavelengths.
When developing the algorithm it was necessary to choose an effective method for proceeding through the field of possible component mass combinations to minimize calculations and find the optimum apportionment. When utilizing a non-linear least squares method, it was found that in many instances, local minima could lead to the reporting of false, non-global minima. To avoid this, an adjusted full field approach was developed.
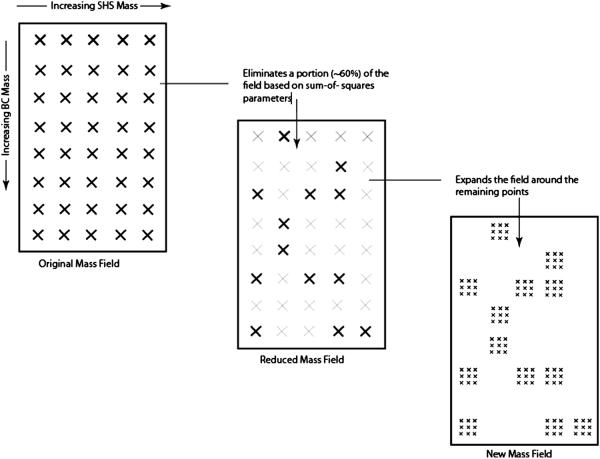
The drawback to a full-field approach is that with added components, the apportionment becomes computationally intensive. The field expansion (Fig. 2) limits the number of points evaluated, while still achieving the desired field resolution. The program first scans the field at a course resolution and then selects the subfields that are lower than the median of sum of squares for further expansion around these selected points. This expansion is repeated twice to obtain high resolution evaluations. Each component represents a dimension in the mass field, such that beyond two components, the field becomes challenging to visualize. We compared the full-field approach with this adjusted zoom-in method for more than 20 cases and found that the zoom-in approach quickly located the global minima point, validating the effectiveness of this method.
Figure 2.
Visual depiction of the “zoom-in” algorithm.
The number and values of wavelengths chosen to represent the optical signatures of the component standards in the data reduction program was optimized by creating linear combinations of the different components (synthetic data) and then seeing how accurate the data reduction program could apportion the synthetic filters' mass (after Lawless et al 2004). Two synthetic data experiments are reported here: the first with synthetic filters loaded with only BC and SHS, the second with BC, SHS, goethite, and hematite. Four sets of wavelengths are compared: Lawless wavelengths (430, 587, 660 940 nm), four wavelengths selected in this study (400, 475, 550, 850 nm), 10 wavelengths spread evenly between 375 and 960 nm (375, 440, 505, 570, 635, 700, 765, 830, 895, 960) and 20 wavelengths spread evenly between 375 and 992 nm. In the first experiment, 64 combinations of BC and SHS are tested, namely all combinations of
BC mass = 25, 50, 75, 100, 125, 150, 175, 200 ng/mm2 and
SHS mass = 25, 50, 75, 100, 125, 150, 175, 200 ng/mm2
In addition, each filter was set to have a random amount of non-absorbing mass selected from a uniform distribution on the interval zero to four times the absorbing mass on the filter. For each set of wavelengths, the experiment was repeated five times with a new non-absorbing mass for each run. The optical density data for the synthetic filters was formulated directly from the fitting curves with no added noise. In the second experiment, the same process was used, except with the 256 combinations of:
BC mass= 50, 100, 150, 200 ng/mm2
SHS mass= 50, 100, 150, 200 ng/mm2
Goethite mass= 50, 100, 150, 200 ng/mm2
Hematite mass= 50, 100, 150, 200 ng/mm2
The zoom-in approach was then used and results compared to the mathematical mixtures. The results of these experiments are reported in terms of average percent error in apportioning each component for each synthetic filter. This error result is then averaged for all filters across the five runs and presented for each of the two experiments.
2.3 Archived filters from a NYC cohort study
In the Columbia Center for Children's Environmental Health (CCCEH) cohort, indoor and/or outdoor PM2.5 samples are collected over a two-week period in a flow rate of 1.5 LPM, with a repeat measurement occurring 6 months later to assess seasonal variations (Jung et al., 2010a; Jung et al., 2010b). The CCCEH cohort is recruited from low-income neighborhoods of Northern Manhattan and the South Bronx, as previously reported (Perera et al., 2003).
2.4 Comparison measurements
Smoke stain reflectometer (model 43D, Diffusion Systems Ltd., London, UK) readings are made with a custom filter holder so as to avoid contamination of the filter as reported in Kinney et al., 2002. Because the reflectance measurement is sensitive to the distance between the reflectometer head and the filter (which is an additional 2.5 mm with our filter holder), we report our reflectance measurements as “modified” reflectance (R*) to help distinguish our measurements from those of others. To focus on the mass loading of soot on the filter instead of the air concentrations (the latter reported as absorbance units), we report the natural log of the ratio of a blank Teflon filter reflectance to the sample filter reflectance or LN(Ro*/R*).
Elemental carbon (EC) of co-located quartz filters were measured by Sunset Laboratory using the Method 5040 (NIOSH, 1998) and EC levels was compared with those determined by the multi-wavelength optical method. Method 5040 proceeds in following stages: evolving organic and carbonate (if present) carbon in a non-oxidizing atmosphere (He) by the 4 temperature ramp about 870 °C; cooling to 550°C and introducing 10% oxygen in He, then bringing the sample to a temperature of 910°C. The whole program runs about 14 mins. Comparisons were also made to co-located Aethalometer® readings collected every 5 minutes and then averaged over 24 hours. Aethalometer was operated at 4 /LPM flow rate with a BGI KTL cyclone with a PM2.5 cut. The aethalometer was run with the maximum attenuation set to 35%, i.e., filter will proceed to a new tape location if the light attenuation is more than 35%.
3. Results and discussion
3.1 Improved performance in optical measurement
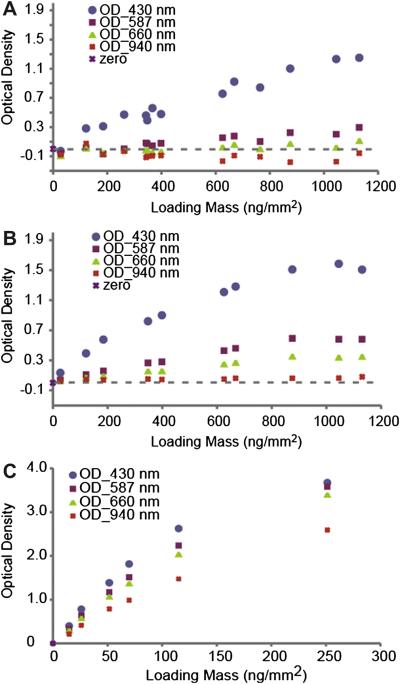
Figures 3A and 3B show variations of optical density with mass loadings (ng/mm2) before and after modification of the integrating sphere and sample holder. The primary modifications were decreasing the amount of light lost from the integrating sphere system at the interface with the filter holder while not allowing any physical contact with the active area of the filter (particle side). Key modifications were increasing the reflection of light that had passed through the filter back into the integrating sphere by placing a better reflector (white Teflon) directly behind the filter and painting the bottom of the integrating sphere case with a diffusive white reflectance coating (Labsphere, WRC-6080). To keep the coating from flaking over time the painted bottom was encased in a thin translucent layer of white Teflon (see Fig 1). Decreasing the overall thickness of the filter holder also made minor improvements. Overall improvement to the filter-holder-integrating sphere system, resulted in the data for both filters of kerosene soot (data not shown) and filters of SHS fitting smooth curves better, as well as drove the x-intercept from positive values to zero. Optical density values of just SHS filters at 940 nm increase from negative values before modification to around zero after modification. This finding suggests little to no absorbance at the near infrared wavelength and in this IR region, absorbance mainly is derived from BC rather than from SHS. In addition, the modifications increase the sensitivity of the 587 and 660 nm curves.
Figure 3.
Comparison of optical density vs. SHS loading for 4 wavelenghts before (A) and after (B) modification of the integrating sphere and sample holder. (C). Optical density vs kerosene soot loading for 4 wavelengths (after modification shown only).
The positive x-intercept of calibration curves for filters of pure kerosene soot or SHS observed by Lawless et al. (2004) were explained as being due to non-absorbing mass components on the filters. Our experience above where each modification to reduce light losses made the x-intercepts march towards zero indicate that the positive x-intercepts of the calibration curves obtained in Lawless et al 2004 system are probably due to minor light losses from their filter holder-integrating sphere system. The zero intercept obtained with our system simplifies the curve fitting to the following equation:
This plausible simplification helps reduce the number of parameters considered in the apportionment model and reduces the computation time.
3.2 Optimized wavelengths
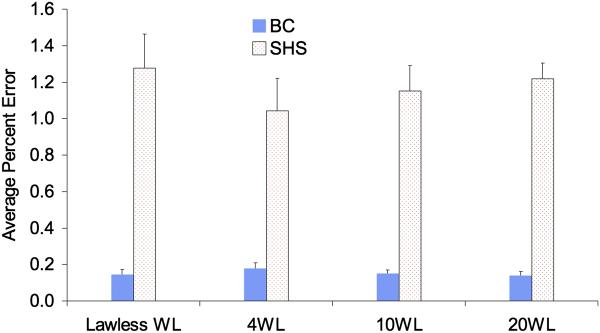
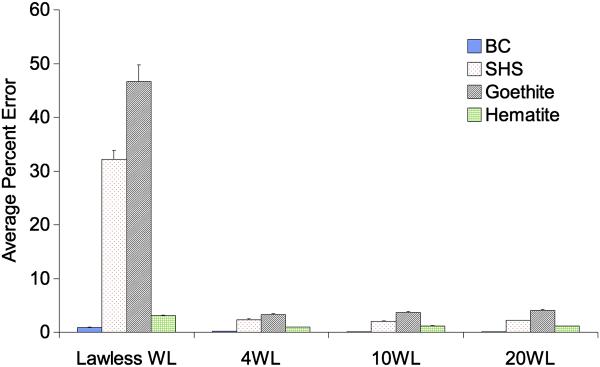
Having established the fitting curves for additional end-members, spectra derived from linear combinations of mixtures of either BC and SHS spectra (two component model) or mixtures of BC, SHS, goethite and hematite spectra (4 component model) were used to optimize the number of wavelengths needed to deconvolve precisely each component. We directly compared the original four wavelengths chosen by Lawless et al. 2004 to another set of four wavelengths (400, 475, 550, and 850) in which 3 wavelengths are below 600 nm, as well as to a set of ten wavelengths and a set of twenty wavelengths. When limiting the analysis to two components (i.e., BC and SHS), comparable errors were observed across all wavelength settings (Fig. 4). The deconvolution experiments with synthetic data that include 4 components (i.e. BC, SHS, goethite, and hematite) show that the wavelengths that Lawless et al 2004 chose for determining two components result in significant average percentage errors in SHS and goethite determinations when expanding to 4 components (1.2% error for two component model vs. 32.7% for four component model). This result suggests that this methodology is useful for optimizing choice of wavelengths when expanding the method to additional colored components. In effect, the original Lawless 4 wavelengths that worked well for 2 component model are not sufficient to tell the difference apart between SHS and goethite, both of which have strong response at 430 nm. However, if chosen carefully, four wavelengths can be sufficient to apportion mass from these four different sources. However, the wavelength set should have three less than 600 nm where the majority of optical variation occurs (Figure S1, Supporting Information provides the plots of each components optical signatures (OD vs wavength for filters of different mass loadings). We believe that 10 evenly distributed wavelengths should be sufficient even in different urban settings as evidenced in Figure 5, where similar errors were observed between the 10 wavelength set and 20 wavelength set. The other wavelength combinations also have additional wavelengths below 600 nm and can distinguish between all four components. The error associated with BC remains small for all choices of wavelengths supporting the robustness of this approach, more than a factor of 5 lower than errors associated with SHS. SHS is a complex mixture where the color in SHS is due to water soluble compounds (Pryor et al., 1998).
Figure 4.
Mathematical errors compared for different wavelength sets for the model that includes 2 colored components (BC, SHS).
Figure 5.
Mathematical errors compared for different wavelength sets for the model that includes 4 colored components (BC/SHS/Goethite/Hematite).
Estimated limit of detections by this optical method, calculated as three times of the standard deviation of the lowest pure component standard, vary substantially from component to component: SHS 0.7 (ng/mm2), BC (1.4 ng/mm2), hematite (43.8 ng/mm2), geothite (48.6 ng/mm2). In most urban environments, such as in NYC, iron levels in air result in filter loadings much lower than can be distinguished by this optical method. For example, maximum ambient iron levels in PM2.5 filters observed in NYC over 48 hrs in 1999 (270 ng/m3) are equivalent to iron oxide loadings of 6–16 ng/mm2, depending on the oxide. Such a loading is well below the iron oxide LODs above and would result in OD of less than 0.1 units at 400 nm (with even lower OD at higher wavelengths). In some environments, iron oxide levels can be much higher and then the optical method can be used to determine estimated iron loadings; example environments with high iron concentrations include underground subway stations or desert environments (Chillrud et al., 2005; Fialho et al., 2005). Airborne concentrations of iron associated with fine particulate matter were observed to be more than 100 times greater in the subway environment than in home indoor or outdoor settings in NYC, most likely due to the abrasion between subway wheels and track. Of important note for the subway environment, the optical signature of the iron oxide magnetite (black in color) mixed together with some SHS can be a confounder for BC analysis (Supporting information Fig.S2). As noted above, the very high sensitivity of the multi-wavelength method to BC mass loadings relative to the poor sensitivity of this method to the iron oxide mass loadings (Supporting information Fig.S1) makes this potential confounder of negligible importance, except in special microenvironments like subways. Due to the relative ubiquity of BC over magnetite, magnetite was not included in the apportionment experiments reported here. In such environments, it would be useful to use XRF measurements for Fe to identify maximum iron oxide loadings as an additional constraint to the optical model.
3.3 Reproducibility of BC measurements
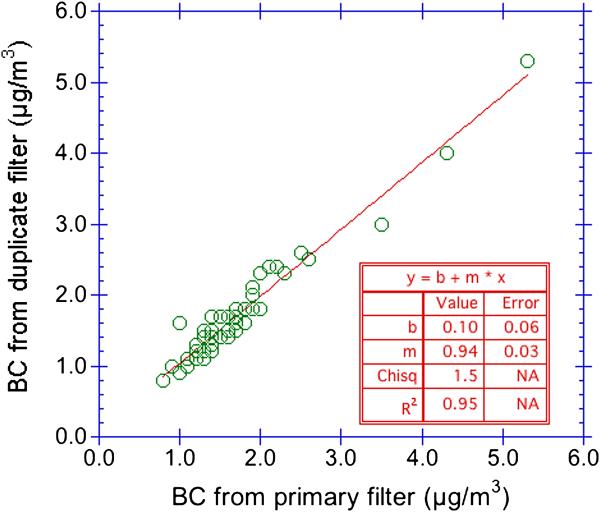
Replicate BC measurements on single filter on the same day and across multiple days suggest a reproducibility of 3% (RSD for n = 10). In comparison, Figure 6 shows the results of soot-BC determined for 48 sets of co-located duplicate PM2.5 filters collected (indoors and outdoors) over two week time periods (CCCEH cohort). The BC concentrations ranged from 0.8 to 5.3 μg/m3 and fall on or near the 1:1 line. For 47 out of 48 of the sets, the average % difference value is near zero, with the individual percent difference values spread evenly between −15% and +15%; one filter set displayed a 46% difference. The frequency distribution of the absolute difference between co-located duplicate filters shows that among the 48 pairs, 41 (85%) of the duplicates were within 0.2 μg/m3 of the original filter, 7 of the duplicates (15%) were within 0.2–0.6 μg/m3.
Figure 6.
Results from co-located duplicate filters (n = 48) collected in NYC. BC determined by 10 wavelength, 2 component model. Duplicate pairs where PM2.5 mass differed by more than 29% were removed.
3.4 BC vs. aethalometer, smoke stain reflectometer (SSR), and EC data
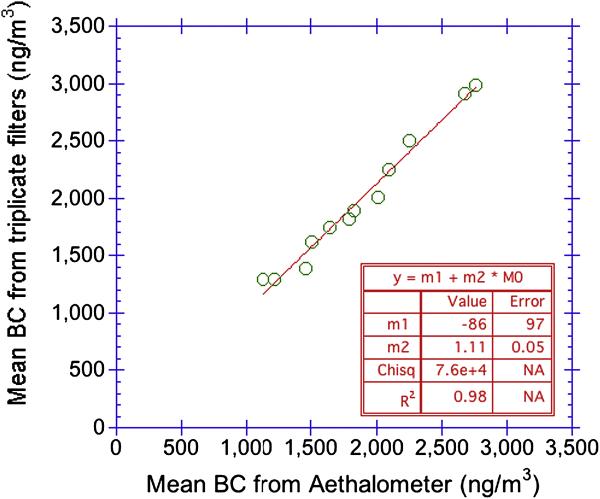
Excellent agreement (R2 = 0.99) was obtained when triplicate PM2.5 filters were collected over twelve 24 hr periods at a single site in northern Manhattan and compared to BC data obtained by averaging 5 minute measurements made by a Magee Aethalometer® for the same 24-hr time periods (Fig. 7).
Figure 7.
Aethalometer data averaged and compared to 24 hr sampling periods of triplicate PM2.5 filters measured by multi-wavelength optical method (10 wavelength, 2 component model).
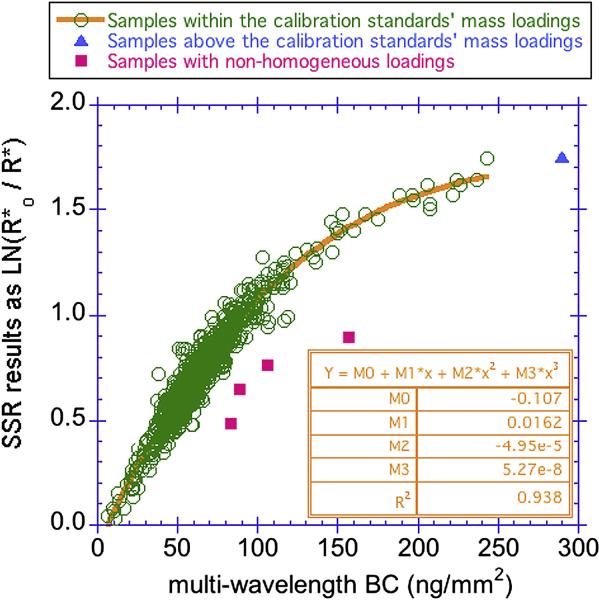
Figure 8 displays the comparison between the SSR and the multi-wavelength BC, with both results being presented in units that reflect mass loading of soot on the filters which is what the measurement actually responds to. The SSR results are represented as LN(R*o/R*) since the normal absorbance coefficient incorporates the volume of air filtered. The two measurements initially appear to be linearly correlated up to BC loading of ca. 90 ng/mm2; however, that level, the data are no longer linearly associated. We interpret the curvature to this figure to be due to the decrease in sensitivity of the SSR at high loadings where this instrument has been reported to have saturation issues (Taha et al., 2007). Although the multi-wavelength method will also reach a level of saturation, its gravimetric calibration allows this optical method to continue to be accurate to higher loadings. Although the linear portion of the figure represents almost 95% of the samples, the remaining 5% of the samples represent the highest concentrations, and the high end of the distribution is critically important for defining associations to different health outcomes. For the entire range of the mass loadings of the calibration standards used by the multi-wavelength method (up to 250 ng/mm2), the data are well represented by a 3rd order polynomial (R2 = 0.93). The four red samples that fall well below the main curve (Fig. 8) had its PM2.5 focused in the center of the filter, due to the failure of the cyclone. Both the SSR and multi-wavelength methods are based on the assumption that PM2.5 is evenly distributed on the filters; therefore for these four filters, both results are inaccurate. The BGI cyclones can fail to evenly distribute PM2.5 across the filter when the barb fitting, which connects the tubing to the cassette that holds the filter, is pushed in too far so that the end of the fitting is too close to the filter thereby concentrating the flow of air into the center of the filter. The model derived fits which apportion the amount of BC vs. other components show that soot-BC is not the only particulate matter type that impacts the optical reflectance of indoor samples whereas outdoor samples in NYC appear to be predominantly BC (data not shown). This type of information is not available by the SSR method.
Figure 8.
Comparison of smoke stain reflectometer SSR results to multi-wavelength BC results determined by the 10 wavelength, two component model. The asterisks indicate that we have modified the SSR method and thus the values will not be the same as others that follow the standard protocol (see text).
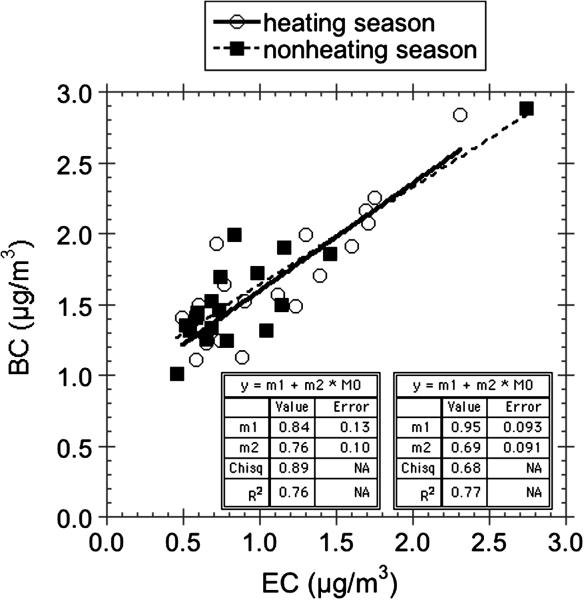
BC levels determined using this optical method were compared with EC levels measured by Sunset Inc. using thermo-optical NIOSH method 5040 on filters collected over 2 week periods (CCCEH cohort). The BC air concentrations are similar to but consistently higher than the EC concentrations. One possible explanation for higher values of BC than EC is that the NIOSH method can underestimated EC levels by up to 50% because of the oxidation of elemental carbon at 870°C in the helium atmosphere at which some minerals decompose (Chow et al., 2001). The correlations (R2 ≈ 0.77) observed for samples collected during both the heating season and non-heating seasons (Jung et al., 2010a) (Fig. 9) are reasonably strong for the amount of variation in the two week long samples (< factor of 4), and a similar slope characterizes the correlation between EC and the multi-wavelength optical method in heating and non-heating seasons. One pair of co-located samples that was not plotted in Figure 9, the quartz filter had a much higher EC concentration of 21 μg/m3. This high average level for EC for these two week samples would be equivalent to a BC filter loading that is well beyond the range that the multi-wavelength method works; and indeed the apportionment model fit to the optical data for the co-located Teflon filter was very poor suggesting the multi-wavelength method was unable to quantify the amount of BC accurately.
Figure 9.
Comparison of EC concentrations made on quartz PM2.5 filters to optical BC measurements for co-located Teflon PM2.5 filters collected over 2 week periods. One outlier pair was removed from an indoor setting (see text).
Conclusions
The current optical method can distinguish end-member standards of BC, SHS, and iron oxides. For environmental samples, the method has been found to be very sensitive for estimating airborne levels of BC. Validation of the BC levels included comparison to aethalometer measurements (R2 = 0.98) and EC measurements (R2 ≈ 0.77) in both heating and non-heating seasons. Comparison to SSR measurements appeared to be linearly correlated to multi-wavelength BC below a BC loading of 90 ng/mm2; above this value the multi-wavelength BC values are more accurate due to saturation of the SSR method. In addition, the multi-wavelength optical method can estimate concentration of additional components including SHS, hematite and goethite.
Supplementary Material
Acknowledgements
This research is supported by NIEHS grants (ES016110, ES015905, ES013163 and ES009089). Thanks to Cheng-Chuan Ho for fruitful programming discussion and coding, and to summer interns who have worked on this project, specifically Molly Plotkin and Cristine White. We also thank Phil Lawless for providing extended details of his method and useful discussion of our method and two anonymous reviewers for their useful suggestions and efforts in improving this manuscript. This is LDEO contribution number XXXX.
Footnotes
Publisher's Disclaimer: This is a PDF file of an unedited manuscript that has been accepted for publication. As a service to our customers we are providing this early version of the manuscript. The manuscript will undergo copyediting, typesetting, and review of the resulting proof before it is published in its final citable form. Please note that during the production process errors may be discovered which could affect the content, and all legal disclaimers that apply to the journal pertain.
References
- Ballach J, Hitzenberger R, Schultz E, Jaeschke W. Development of an improved optical transmission technique for black carbon (BC) analysis. Atmospheric Environment. 2001;35(12):2089–2100. [Google Scholar]
- Bell ML, Ebisu K, Peng RD, Samet JM, Dominici F. Hospital Admissions and Chemical Composition of Fine Particle Air Pollution. American Journal of Respiratory and Critical Care Medicine. 2009;179(12):1115–1120. doi: 10.1164/rccm.200808-1240OC. 10.1164/rccm.200808-1240OC. [DOI] [PMC free article] [PubMed] [Google Scholar]
- Brook AD, Bard RL, Burrnett RT, Shin HH, Vette A, Croghan CW, Philips M, Rodes CE, Thornburg JW, Williams RW. Differences in Blood Pressure and Vascular Responses Associated with Ambient Fine Particulate Matter Exposures Measured at the Personal versus Community Level. Occupational and Environmental Medicine. Occupational and Environmental Medicine. 2010 doi: 10.1136/oem.2009.053991. DOI: 10.1136/OEM.2009.053991. publication on line 10/08/10. 10.1136/OEM.2009.053991. [DOI] [PubMed] [Google Scholar]
- Chillrud SN, Grass D, Ross JM, Coulibaly D, Slavkovich V, Epstein D, Sax SN, Pederson D, Johnson D, Spengler JD, Kinney PL, Simpson HJ, Brandt-Rauf P. Steel dust in the New York City subway system as a source of manganese, chromium, and iron exposures for transit workers. Journal of Urban Health-Bulletin of the New York Academy of Medicine. 2005;82(1):33–42. doi: 10.1093/jurban/jti006. 10.1093/jurban/jti006. [DOI] [PMC free article] [PubMed] [Google Scholar]
- Chow JC, Watson JG, Crow D, Lowenthal DH, Merrifield T. Comparison of IMPROVE and NIOSH carbon measurements. Aerosol Science and Technology. 2001;34(1):23–34. [Google Scholar]
- Diaz-Sanchez D, Garcia MP, Wang M, Jyrala M, Saxon A. Nasal challenge with diesel exhaust particles can induce sensitization to a neoallergen in the human mucosa. Journal of Allergy and Clinical Immunology. 1999;104(6):1183–1188. doi: 10.1016/s0091-6749(99)70011-4. [DOI] [PubMed] [Google Scholar]
- Edwards JD, Ogren JA, Weiss RE, Charlson RJ. Particulate air pollutants: A comparison of British “Smoke” with optical absorption coefficient and elemental carbon concentration. Atmospheric Environment (1967) 1983;17(11):2337–2341. [Google Scholar]
- Fialho P, Hansen ADA, Honrath RE. Absorption coefficients by aerosols in remote areas: a new approach to decouple dust and black carbon absorption coefficients using seven-wavelength Aethalometer data. Journal of Aerosol Science. 2005;36(2):267–282. 10.1016/j.jaerosci.2004.09.004. [Google Scholar]
- Fromme H, Lahrz T, Hainsch A, Oddoy A, Piloty M, Ruden H. Elemental carbon and respirable particulate matter in the indoor air of apartments and nursery schools and ambient air in Berlin (Germany) Indoor Air. 2005;15(5):335–341. doi: 10.1111/j.1600-0668.2005.00377.x. 10.1111/j.1600-0668.2005.00377.x. [DOI] [PubMed] [Google Scholar]
- Garshick E, Schenker MB, Munoz A, Segal M, Smith TJ, Woskie SR, Hammond SK, Speizer FE. A CASE-CONTROL STUDY OF LUNG-CANCER AND DIESEL EXHAUST EXPOSURE IN RAILROAD WORKERS. American Review of Respiratory Disease. 1987;135(6):1242–1248. doi: 10.1164/arrd.1987.135.6.1242. [DOI] [PubMed] [Google Scholar]
- Garshick E, Schenker MB, Munoz A, Segal M, Smith TJ, Woskie SR, Hammond SK, Speizer FE. A RETROSPECTIVE COHORT STUDY OF LUNG-CANCER AND DIESEL EXHAUST EXPOSURE IN RAILROAD WORKERS. American Review of Respiratory Disease. 1988;137(4):820–825. doi: 10.1164/ajrccm/137.4.820. [DOI] [PubMed] [Google Scholar]
- Hansen ADA, Rosen H, Novakov T. THE AETHALOMETER - AN INSTRUMENT FOR THE REAL-TIME MEASUREMENT OF OPTICAL-ABSORPTION BY AEROSOL-PARTICLES. Science of the Total Environment. 1984;36(JUN):191–196. [Google Scholar]
- Heinrich U, Fuhst R, Rittinghausen S, Creutzenberg O, Bellmann B, Koch W, Levsen K. CHRONIC INHALATION EXPOSURE OF WISTAR RATS AND 2 DIFFERENT STRAINS OF MICE TO DIESEL-ENGINE EXHAUST, CARBON-BLACK, AND TITANIUM-DIOXIDE. Inhalation Toxicology. 1995;7(4):533–556. [Google Scholar]
- ISO . Standard 3402: Tobacco and tobacco productssAtmosphere for conditioning and testing, International Organization for Standardization. 1999. [Google Scholar]
- Jung KH, Patel M, Moors K, Kinney PL, Chillrud SN, Whyatt R, Hoepner L, Garfinkel R, Yan BZ, Ross J, Camann D, Perera FP, Miller RL. Effects of heating season on residential indoor and outdoor polycyclic aromatic hydrocarbons, black carbon, particulate matter in an urban birth cohort. Atmospheric Environment. 2010a;44:4545–4552. doi: 10.1016/j.atmosenv.2010.08.024. [DOI] [PMC free article] [PubMed] [Google Scholar]
- Jung KH, Yan BZ, Chillrud SN, Perera FP, Whyatt R, Camann D, Kinney PL, Miller RL. Assessment of Benzo(a)pyrene-equivalent Carcinogenicity and Mutagenicity of Residential Indoor versus Outdoor Polycyclic Aromatic Hydrocarbons Exposing Young Children in New York City. International Journal of Environmental Research and Public Health. 2010b;7(5):1889–1900. doi: 10.3390/ijerph7051889. 10.3390/ijerph7051889. [DOI] [PMC free article] [PubMed] [Google Scholar]
- Kinney PL, Aggarwal M, Northridge ME, Janssen NAH, Shepard P. Airborne concentrations of PM2.5 and diesel exhaust particles on Harlem sidewalks: A community-based pilot study. Environmental Health Perspectives. 2000;108(3):213–218. doi: 10.1289/ehp.00108213. [DOI] [PMC free article] [PubMed] [Google Scholar]
- Kinney PL, Chillrud SN, Ramstrom S, Ross J, Spengler JD. Exposures to multiple air toxics in New York City. Environ Health Perspect. 2002;110(Suppl 4):539–46. doi: 10.1289/ehp.02110s4539. [DOI] [PMC free article] [PubMed] [Google Scholar]
- Kinney PL, Chillrud SN, Sax SN, Ross JM, Pederson DC, Johnson D, Aggarwal M, Spengler JD. (TEACH) Study (The New York City Report) Mickey Leland National Urban Air Toxics Research Center; 2005. Toxic Exposure Assessment: A Colubia- Harvard. [Google Scholar]
- Lawless PA, Rodes CE, Ensor DS. Multiwavelength absorbance of filter deposits for determination of environmental tobacco smoke and black carbon. Atmospheric Environment. 2004;38(21):3373–3383. 10.1016/j.atmosenv.2004.03.038. [Google Scholar]
- Lena TS, Ochieng V, Carter M, Holguin-Veras J, Kinney PL. Elemental carbon and PM2.5 levels in an urban community heavily impacted by truck traffic. Environmental Health Perspectives. 2002;110(10):1009–1015. doi: 10.1289/ehp.021101009. [DOI] [PMC free article] [PubMed] [Google Scholar]
- Mauderly J, Snipes M, Barr E, Belinsky S, Bond J, Brooks A, Chang I-Y, Cheng Y, Gillet N, Griffith W, Henderson R, Mitchell C, Nikula K, Thormassen D. Pulmonary Toxicity of Inhaled Diesel Exhaust and Carbon Black inChronically Exposed Rats 1994. Research Report 68. Health Effects Institute; Cambridge, MA: 1994. Part I: Neoplastic and nonneoplactic lung lesions. [PubMed] [Google Scholar]
- Mills NL, Tornqvist H, Robinson SD, Gonzalez M, Darnley K, MacNee W, Boon NA, Donaldson K, Blomberg A, Sandstrom T, Newby DE. Diesel exhaust inhalation causes vascular dysfunction and impaired endogenous fibrinolysis. Circulation. 2005;112(25):3930–3936. doi: 10.1161/CIRCULATIONAHA.105.588962. 10.1161/circulationaha.105.588962. [DOI] [PubMed] [Google Scholar]
- NIOSH . NIOSH Manual of Analytical Methods. 4th Ed. NIOSH; Cincinnati, Ohio: 1998. Elemental carbon (diesel particulate) Method 5040, Issue 2. [Google Scholar]
- Patel MM, Hoepner L, Garfinkel R, Chillrud S, Reyes A, Quinn JW, Perera F, Miller RL. Ambient Metals, Elemental Carbon, and Wheeze and Cough in New York City Children through 24 Months of Age. American Journal of Respiratory and Critical Care Medicine. 2009;180(11):1107–1113. doi: 10.1164/rccm.200901-0122OC. 10.1164/rccm.200901-0122OC. [DOI] [PMC free article] [PubMed] [Google Scholar]
- Perera FP, Rauh V, Tsai WY, Kinney P, Camann D, Barr D, Bernert T, Garfinkel R, Tu YH, Diaz D, Dietrich J, Whyatt RM. Effects of transplacental exposure to environmental pollutants on birth outcomes in a multiethnic population. Environmental Health Perspectives. 2003;111(2):201–205. doi: 10.1289/ehp.5742. 10.1289/ehp.5742. [DOI] [PMC free article] [PubMed] [Google Scholar]
- Pryor WA, Stone K, Zang LY, Bermudez E. Fractionation of aqueous cigarette tar extracts: Fractions that contain the tar radical cause DNA damage. Chemical Research in Toxicology. 1998;11(5):441–448. doi: 10.1021/tx970159y. [DOI] [PubMed] [Google Scholar]
- Riedl M, Diaz-Sanchez D. Biology of diesel exhaust effects on respiratory function. Journal of Allergy and Clinical Immunology. 2005;115(2):221–228. doi: 10.1016/j.jaci.2004.11.047. 10.1016/j.jaci.2004.11.047. [DOI] [PubMed] [Google Scholar]
- Rodes CE, Lawless PA, Thornburg JW, Williams RW, Croghan CW. DEARS particulate matter relationships for personal, indoor, outdoor, and central site settings for a general population. Atmospheric Environment. 2010;44(11):1386–1399. 10.1016/j.atmosenv.2010.02.002. [Google Scholar]
- Sandradewi J, Prevot ASH, Weingartner E, Schmidhauser R, Gysel M, Baltensperger U. A study of wood burning and traffic aerosols in an Alpine valley using a multi-wavelength Aethalometer. Atmospheric Environment. 2008;42(1):101–112. 10.1016/j.atmosenv.2007.09.034. [Google Scholar]
- Seshagiri B, Burton S. Occupational exposure to diesel exhaust in the Canadian federal jurisdiction. Aiha Journal. 2003;64(3):338–345. doi: 10.1080/15428110308984825. [DOI] [PubMed] [Google Scholar]
- Spira-Cohen A, Chen LC, Kendall M, Sheesley R, Thurston GD. Personal exposures to traffic-related particle pollution among children with asthma in the South Bronx, NY. Journal of Exposure Science and Environmental Epidemiology. 2010;20(5):446–456. doi: 10.1038/jes.2009.34. 10.1038/jes.2009.34. [DOI] [PMC free article] [PubMed] [Google Scholar]
- Steenland K, Silverman D, Zaebst D. EXPOSURE TO DIESEL EXHAUST IN THE TRUCKING INDUSTRY AND POSSIBLE RELATIONSHIPS WITH LUNG-CANCER. American Journal of Industrial Medicine. 1992;21(6):887–890. doi: 10.1002/ajim.4700210612. [DOI] [PubMed] [Google Scholar]
- Steenland NK, Silverman DT, Hornung RW. CASE-CONTROL STUDY OF LUNG-CANCER AND TRUCK DRIVING IN THE TEAMSTERS-UNION. American Journal of Public Health. 1990;80(6):670–674. doi: 10.2105/ajph.80.6.670. [DOI] [PMC free article] [PubMed] [Google Scholar]
- Taha G, Box GP, Cohen DA, Stelcer E. Black carbon measurement using laser integrating plate method. Aerosol Science and Technology. 2007;41(3):266–276. 10.1080/02786820601156224. [Google Scholar]
- USEPA . Health Assessment Document for Diesel Engine Exhaust. National Center for Environmental Assessment; Washington DC: 2002. EPA/600/8-90/057F/ downloaded at http://cfpub.epa.gov/ncea/cfm/recordisplay.cfm?deid=29060. [Google Scholar]
- van Vliet EDS, Kinney PL. Impacts of roadway emissions on urban particulate matter concentrations in sub-Saharan Africa: new evidence from Nairobi, Kenya. Environmental Research Letters. 2007;2(4):045028. 10.1088/1748-9326/2/4/045028. [Google Scholar]
Associated Data
This section collects any data citations, data availability statements, or supplementary materials included in this article.


