

Abstract
Background
Primary effusion lymphoma (PEL) is a rare KSHV/HHV8-associated high-grade non-Hodgkin's lymphoma (NHL) of B-cell origin, characterized by serous effusions in body cavities. Most patients are HIV-infected men with severe immunosuppression and other HHV8-associated diseases such as Kaposi's sarcoma (KS). The prognosis for those infected is poor, with a median survival of less than 6 months in most cohorts. Sustained complete remission is rare. High-dose chemotherapy regimens are used to improve remission rate and survival. The aim of the present study was to compare the drug sensitivity pattern of the available primary effusion (body cavity based) lymphoma-derived cell lines in order to find additional, potentially effective drugs that are not included in current chemotherapy treatment protocols.
Methods
We have analyzed 11 cell lines against 27 frequently used cytostatic drugs in short term (3 days) survival assays using automated high throughput confocal microscopy.
Results
All cell lines showed a distinct, individual drug sensitivity pattern. Considering the in vitro used and clinically achieved drug concentration, Vinorelbine, Paclitaxel, Epirubicin and Daunorubicin were the most effective drugs.
Conclusions
We suggest that inclusion of the above drugs into PEL chemotherapy protocols may be justified. The heterogeneity in the drug response pattern however indicated that assay-guided individualized therapy might be required to optimize therapeutic response.
Background
Human herpesvirus 8 (HHV8) or Kaposi sarcoma herpesvirus (KSHV) is the probable causative agent of two distinct lymphoproliferative disorders: primary effusion lymphoma (PEL) and the plasma cell variant of multicentric Castleman disease (MCD) in addition to Kaposi sarcoma (KS) [1].
Primary effusion lymphoma (PEL), or alternatively: body cavity lymphoma is a non-Hodgkin's lymphoma (NHL) of B-cell origin that develops predominantly in the serous body cavities [2]. The lymphoma cells, although lacking many conventional B-cell markers, carry immunoglobulin gene rearrangement and express syndecans, suggesting pre-plasma cell origin. At the clinico-pathological level, PEL is characterized by liquid growth in the serous body cavities associated with spreading along the serous membranes without infiltrative or destructive growth patterns [3,4]. Morphologically, PEL bridges immunoblastic and anaplastic features and frequently displays a certain degree of plasmacell differentiation. In all known cases, the monoclonal B-cell population is infected with HHV-8. Half of the lymphomas are dually infected with HHV-8 and Epstein-Barr virus (EBV) [5]. In the context of AIDS, most cases are associated with other KSHV/HHV8-related diseases such as Kaposi's sarcoma (KS) or multicentric Castleman's disease (MCD). As PEL typically lacks a solid component, its diagnosis rests on the cytological examination of body fluid. Phenotypically, expression of the CD45 antigen (> 90% of cases) confirms the lymphoid derivation of PEL cells, which exhibit an indeterminate immunophenotype, as they usually lack expression of B- and T-cell associated antigens (the majority of cases reported). There are, however, cases in the literature that had a B-cell or T-cell phenotype respectively [1].
Conversely, PEL cells generally express various markers associated with activation, including CD30 (approximately 75% of cases), CD38, CD71 and the epithelial membrane antigen. Moreover, PEL cells express several plasma cell markers including CD138, VS38c and MUM-1/IRF4 [1].
The prognosis of PEL is poor, as the median survival in the previously published series does not exceed 3 months [3,6-10].
Given its rarity, however, there are very few longitudinal observational series of patients with PEL and no large prospective trials have ever defined optimal treatment strategies [11].
Prior to the introduction of antiretroviral therapy, the therapeutic results were unsatisfactory in cohorts of HIV+ patients, despite the use of aggressive polychemotherapy regimens including anthracyclines. The significant improvement in the prognosis of AIDS-related lymphomas observed in the antiretroviral therapy era also applies to the PEL setting.
In addition, the routine use of growth factors, such as the granulocyte colony-stimulating factor (G-CSF), to avoid prolonged periods of neutropenia resulting from chemotherapy is standard practice for all AIDS-related lymphoma (ARL) patients.
Despite the improvement in therapeutical strategies during the last few years, there is no evidence of a cure for PEL patients with conventional systemic chemotherapy addressed to aggressive NHL. The suggested benefit of high-dose Methotrexate in association with CHOP (Cyclophosphamide, Doxorubicin, Prednisolone and Vincristine)-like regimens is negatively balanced by the hampered toxicity of Methotrexate in the presence of serous effusions [1].
Novel approaches for body cavity lymphoma therapy outside traditional chemotherapy have been suggested as well [11]. These include the addition of antiviral therapy as well as inhibition of specific cellular targets. Anti-tumor activity of the antiviral therapy directed against KSHV/HHV8 infection has been reported. This experience is based on single case reports. Patients with a diagnosis of PEL, related or not to HIV infection, experienced prolonged complete remission after the intracavitary administration of Cidofovir - an antiviral agent. Intracavitary Cidofovir, as well as interferon-α, may represent a reasonable choice in patients' refractory to conventional chemotherapy, or in elderly patients not eligible for more toxic systemic therapies [12].
Another approach may be to target NF-κB through the use of proteasome inhibition with drugs, such as Bortezomib that induces apoptosis of PEL cell lines in vitro [13].
In the present study we have investigated 11 different primary effusion (body cavity based) lymphoma-derived cell lines to compare the drug sensitivity pattern, in order to find new potentially successful chemotherapy agents, that are not used in current treatment protocols.
Methods
Cell lines and culture conditions
The following primary effusion (body cavity based) lymphoma-derived cell lines were used in the present study. CRO-AP/2, CRO-AP/5, CRO-AP/6, BC-2, BC-3 were established from pleural effusion, CRO-AP/3, HBL-6, BC-3, BCBL-1, JSC-1 were established from ascites fluid and BCP-1 from peripheral blood.
Body-cavity cell lines were cultured in IMDM (Sigma), supplemented with 20% heat-inactivated (at 56°C for 45 min) fetal calf serum (FCS, Sigma), 100 IU/ml penicillin (Sigma), 100 μg/ml streptomycin (Sigma) and 2 mM L-glutamine (Sigma). Cell lines were grown at 37°C in the presence of 5% CO2. Cultures were fed twice weekly with the above-mentioned medium; maintained at ca. 0.5 × 10⁶ cells/ml. All cell lines were examined daily in their culture vessels under an inverted microscope. Absence of mycoplasma contamination was routinely assessed using staining with Hoechst 33258.
In vitro drug sensitivity assay
In vitro drug resistance of body-cavity cell lines were assessed using a 3-day cell culture on microtiter plates. 27 drugs (Table 1) were tested, each at 4 different concentrations in triplicates on 384 well plates. Each well was loaded with 30 μl cell suspension containing 9000 cells. After three days of incubation the living and dead cells were differentially stained using fluorescent VitalDye (Biomarker Hungary). The precise number of living and dead cells was determined using a custom built-automated laser confocal fluorescent microscope (a modified Perkin-Elmer UltraView LCI) at the Karolinska Institute core Visualization Facility (KIVIF). The images were captured using the computer program QuantCapture 4.0 [14,15]. Image correction and counting of living and dead cells was carried out by the program QuantCount 5.0. All programs were created by the authors, using the symbol based graphical programming environment OpenLab Automaton (Improvision). The 15 control wells, that were used to determine the control cell survival (CCS), contained cells with only culture medium and 50 nl DMSO without drugs. 5 wells contained cells with culture medium alone. Comparing the two types of control wells no toxic effect of DMSO could be seen. Mean cell survival (MCS) was determined from the average of cell survival of all 11 body-cavity cell lines (Table 2).
Table 1.
Chemotherapic agents used in the present study
| Clinical dose |
Half time |
In vivo
AUC72 hr |
In vitro used concentrations |
In vitro
AUC72 hr |
Ref | QAUC | |||
|---|---|---|---|---|---|---|---|---|---|
| Antimetabolites | Folic acid | Methotrexate | 12 g/m2 | 24 | 623,70 | 0,033 - 4,17 | 12,000-1499,976 | [21] | 0,019 - 2,405 |
| Purine | Cladribine | 5 mg/m2 | 3 | 5,67 | 0,007 - 0,83 | 0,480-59,976 | [22] | 0,085-10,578 | |
| Fludarabine | 25 mg/m2 | 2 | 27,72 | 0,167 - 20,83 | 12,000-1499,976 | [23] | 0,433-54,112 | ||
| 6-Mercaptopurin | 85 mg/m2 | 4 | 138,60 | 0,556 - 69,44 | 39,997-4999,680 | [24] | 0,289-36,073 | ||
| Pyrimidine | Cytarabine | 1 g/m2 | 2 | 221,76 | 0,133 - 16,66 | 9,596-1199,520 | [25] | 0,043-5,409 | |
| Fluorouracil | 400 mg/m2 | 0.25 | 69,30 | 0,333 - 41,66 | 23,996-2999,520 | [26] | 0,346-43,283 | ||
| Gemcitabine | 1000 mg/m2 | 0.7 | 388,08 | 0,267 - 33,33 | 19,198-2399,760 | [27] | 0,049-6,184 | ||
| Alkylating/alkylating-like | Nitrogen mustards | Chlorambucil | 0.2 mg/m2 | 2 | 33,60 | 0,667 - 83,33 | 47,998-5999,760 | [28] | 1,429-178,564 |
| Platinum | Carboplatin | 360 mg/m2 | 3 | 665,28 | 0,007 - 0,83 | 0,480-59,976 | [29] | 0,001-0,090 | |
| Oxaliplatin | 130 mg/m2 | 5.74 | 270,46 | 0,033 - 4,17 | 2,400-299,952 | [30] | 0,009-1,109 | ||
| Spindle poison/mitotic inhibitor | Taxane | Docetaxel | 85 mg/m2 | 0.6 | 24,95 | 0,067 - 8,33 | 4,798-599,760 | [31] | 0,192-24,040 |
| Paclitaxel | 175 mg/m2 | 3 | 257,80 | 0,013 - 1,67 | 0,956-119,520 | [27] | 0,004-0,464 | ||
| Vinca | Vinblastin | 1.7 mg/m2 | 0.83 | 1,71 | 0,00067 - 0,083 | 0,048-5,998 | [32] | 0,028-3,510 | |
| Vincristine | 1.32 mg/m2 | 2 | 1,55 | 0,00067 - 0,083 | 0,480-59,976 | [33] | 0,309-38,636 | ||
| Vinorelbine | 80 mg/m2 | 40 | 498,96 | 0,007 - 0,83 | 4,798-599,760 | [34] | 0,010-1,202 | ||
| Cytotoxic/antitumor antibiotics | Anthracyclin | Daunorubicin | 1.5 mg/kg | 18 | 531,56 | 0,033 - 4,17 | 2,400-299,952 | [35] | 0,005-0,564 |
| Doxorubicin | 50 mg/m2 | 30 | 1091,48 | 0,013 - 1,66 | 0,956-119,520 | [36] | 0,001-0,110 | ||
| Epirubicin | 90 mg/m2 | 15 | 604,21 | 0,013 - 1,66 | 0,960-119,952 | [27] | 0,002-0,199 | ||
| Streptomyces | Dactinomycin | 1.5 mg/m2 | 36 | 8,98 | 0,003 - 0,42 | 0,240-29,995 | [37] | 0,027-3,340 | |
| Bleomycin | 8 IU/kg/day | 6 | 33,26 | 0,008 - 1 | 0,576-72,000 | [38] | 0,017-2,165 | ||
| Mitomycin | 20 mg/m2 | 1 | 4,44 | 0,003 - 0,33 | 0,317-39,600 | [39] | 0,071-8,929 | ||
| Hydroxyurea | 15 mg/m2 | 2 | 630,00 | 0,333 - 41,66 | 23,996-2999,520 | [40] | 0,038-4,761 | ||
| Topo-isomerase in-hibitors | Camptotheca | Topotecan | 1.2 mg/m2 | 3 | 2,49 | 0,007 - 0,83 | 0,054-6,718 | [41] | 0,022-2,693 |
| Etoposide | 100 mg/m2 | 4 | 221,76 | 0,133 - 16,66 | 9,596-1199,520 | [25] | 0,043-5,409 | ||
| Other | Asparaginase | 30000 IU/m2 | 8 | 26,56 | 0,033 - 4,17 | 2,400-299,952 | [42] | 0,090-11,294 | |
| Bortezomib | 1.45 mg/m2 | 40 | 21,62 | 0,007 - 0,83 | 0,480-59,976 | [43] | 0,022-2,774 | ||
| Prednisolone | 1 mg/kg/day | 3 | 41.58 | 0,16666 - 20,83 | 11,998-1499,760 | [44] | 0,289-36,069 | ||
Table 2.
The average Mean Cell Survival (MCS) of the eleven body cavity lymphoma cell lines at different drug concentrations, expressed as the Q Area Under Curve values (QAUC).
| 125 × dilution | 25 × dilution | 5 × dilution | 1 × dilution | 125 × dilution | 25 × dilution | 5 × dilution | 1 × dilution | |||
|---|---|---|---|---|---|---|---|---|---|---|
| Effective drugs | Chlorambucil | Epirubicin | ||||||||
| MCS | 14.8560 | 46.6236 | 80.8708 | 84.7608 | MCS | 19.2643 | 37.3816 | 63.5034 | 85.1459 | |
| SD | 15.3967 | 12.9966 | 21.0326 | 22.0111 | SD | 14.6115 | 16.3379 | 19.2617 | 26.7694 | |
| QAUC | 1,4285 | 7,1426 | 35,7129 | 178,5643 | QAUC | 0,0016 | 0,0079 | 0,0397 | 0,1985 | |
| Paclitaxel | Dactinomycin | |||||||||
| MCS | 17.0131 | 45.1537 | 67.7781 | 89.5709 | MCS | 7.9351 | 36.0115 | 67.0155 | 86.7944 | |
| SD | 24.0155 | 49.5533 | 35.9258 | 22.0081 | SD | 8.4436 | 31.4395 | 26.8592 | 24.4412 | |
| QAUC | 0,0037 | 0,0185 | 0,0927 | 0,4636 | QAUC | 0,0267 | 0,1336 | 0,6679 | 3,3397 | |
| Daunorubicin | Docetaxel | |||||||||
| MCS | 20.7690 | 27.3619 | 63.7950 | 87.2387 | MCS | 19.7376 | 21.9731 | 37.6060 | 59.5325 | |
| SD | 25.0224 | 24.1810 | 31.5421 | 23.0699 | SD | 21.0333 | 20.3415 | 21.1706 | 27.0225 | |
| QAUC | 0,0045 | 0,0226 | 0,1129 | 0,5643 | QAUC | 0,1923 | 0,9616 | 4,8081 | 24,0404 | |
| Vinorelbine | Vinblastin | |||||||||
| MCS | 18.1346 | 20.5045 | 40.0830 | 53.0230 | MCS | 26.8433 | 40.9968 | 67.9391 | 81.0989 | |
| SD | 16.8776 | 21.5082 | 22.6266 | 26.5102 | SD | 32.9835 | 31.9132 | 33.5183 | 17.2183 | |
| QAUC | 0,0096 | 0,0481 | 0,2404 | 1,2020 | QAUC | 0,0281 | 0,1404 | 0,7020 | 3,5100 | |
| Asparaginase | Fluorouracil | |||||||||
| MCS | 33.4151 | 62.3275 | 90.6113 | 94.4347 | MCS | 41.1156 | 58.9125 | 70.3122 | 83.0342 | |
| SD | 25.9953 | 34.9567 | 26.1363 | 23.3606 | SD | 19.1314 | 27.2339 | 23.4010 | 19.8986 | |
| QAUC | 0,0903 | 0,4517 | 2,2587 | 11,2937 | QAUC | 0,3463 | 1,7313 | 8,6566 | 43,2831 | |
| Etoposide | Doxorubicin | |||||||||
| MCS | 30.6138 | 50.2125 | 64.2707 | 74.6943 | MCS | 29.0927 | 66.8651 | 77.2076 | 80.7702 | |
| SD | 20.8709 | 23.8410 | 23.6330 | 19.0535 | SD | 19.1960 | 25.0111 | 26.0959 | 27.3229 | |
| QAUC | 0,0433 | 0,2164 | 1,0818 | 5,4091 | QAUC | 0,0009 | 0,0044 | 0,0219 | 0,1095 | |
| Gemcitabin | Methotrexate | |||||||||
| MCS | 31.4369 | 45.9785 | 58.4073 | 67.9991 | MCS | 47.1542 | 44.9205 | 70.0761 | 84.2659 | |
| SD | 33.0357 | 38.5124 | 37.0529 | 36.6568 | SD | 22.4628 | 21.6895 | 25.4751 | 25.4385 | |
| QAUC | 0,0495 | 0,2473 | 1,2367 | 6,1837 | QAUC | 0,0192 | 0,0962 | 0,4810 | 2,4050 | |
| Vincristine | Topotecan | |||||||||
| MCS | 43.8400 | 69.1932 | 80.2086 | 81.6665 | MCS | 41.8048 | 75.3319 | 84.1050 | 90.7907 | |
| SD | 34.7208 | 35.8971 | 29.9816 | 32.6203 | SD | 16.4675 | 24.5366 | 25.2812 | 25.3696 | |
| QAUC | 0,3091 | 1,5455 | 7,7273 | 38,6364 | QAUC | 0,0215 | 0,1077 | 0,5385 | 2,6926 | |
| Non-effective drugs | Bortezomib | Bleomycin | ||||||||
| MCS | 79.4105 | 66.8656 | 68.2865 | 64.8357 | MCS | 60.3729 | 69.3422 | 76.5090 | 80.8431 | |
| SD | 25.4732 | 25.6668 | 28.0206 | 24.9547 | SD | 16.7323 | 18.8710 | 22.7197 | 16.8950 | |
| QAUC | 0,0222 | 0,1110 | 0,5548 | 2,7739 | QAUC | 0,0173 | 0,0866 | 0,4330 | 2,1650 | |
| Cladribine | 6-mercaptopurin | |||||||||
| MCS | 81.0033 | 82.0998 | 84.1061 | 92.0852 | MCS | 74.0197 | 87.8677 | 97.1334 | 98.2332 | |
| SD | 21.2666 | 22.0174 | 20.1630 | 21.3224 | SD | 28.3769 | 23.3376 | 30.0858 | 25.3860 | |
| QAUC | 0,0846 | 0,4231 | 2,1156 | 10,5778 | QAUC | 0,2886 | 1,4429 | 7,2146 | 36,0729 | |
| Oxaliplatin | Cytarabine | |||||||||
| MCS | 87.0156 | 89.3148 | 82.6868 | 86.8853 | MCS | 69.9787 | 77.2199 | 83.5057 | 89.0542 | |
| SD | 30.3307 | 26.7413 | 24.1939 | 25.6311 | SD | 31.2151 | 36.2648 | 38.6377 | 32.5155 | |
| QAUC | 0,0089 | 0,0444 | 0,2218 | 1,1090 | QAUC | 0,0433 | 0,2164 | 1,0818 | 5,4091 | |
| Prednisolone | Mitomycin | |||||||||
| MCS | 98.9838 | 99.8113 | 95.6985 | 92.9011 | MCS | 73.4043 | 79.2375 | 80.0565 | 79.4133 | |
| SD | 12.7979 | 15.5728 | 14.2013 | 14.0330 | SD | 28.5533 | 19.7620 | 18.7334 | 19.3133 | |
| QAUC | 0,2886 | 1,4428 | 7,2139 | 36,0693 | QAUC | 0,0714 | 0,3571 | 1,7857 | 8,9286 | |
| Hydroxyurea | Carboplatin | |||||||||
| MCS | 88.8788 | 86.3322 | 97.5959 | 98.8578 | MCS | 113.3868 | 103.2988 | 113.4341 | 110.1786 | |
| SD | 21.5473 | 19.8568 | 17.5610 | 18.7218 | SD | 39.2983 | 27.4344 | 43.5238 | 38.6427 | |
| QAUC | 0,0381 | 0,1904 | 0,9522 | 4,7611 | QAUC | 0,0007 | 0,0036 | 0,0180 | 0,0902 | |
| Fludarabine | ||||||||||
| MCS | 67.0129 | 76.1851 | 79.2040 | 95.8649 | ||||||
| SD | 43.0343 | 35.3340 | 37.6906 | 19.6811 | ||||||
| QAUC | 0,4329 | 2,1645 | 10,8223 | 54,1117 | ||||||
Drugs
For the in vitro drug sensitivity test 27 drugs were used (summarized in Table 1). All the drugs were dissolved in 50% dimethyl sulfoxide (DMSO) - 50% phosphate buffered saline (PBS) and were printed on the 384 well plates using high-density array replicator metal pins with 50 nl replica volumes in a Biomek 2000 fluid dispenser robot (Beckman). The same robot was used to generate the drug masterplates containing the triplicates of four different drug dilutions (1 ×, 5 ×, 25 ×, 125 ×) using a single tip automatic pipettor dispenser head. The starting concentration of the dilution series for the individual drugs was initially determined based on the solubility of the different agents.
The drug plates that were used in this study were also tested on a large number of in vitro tumor cell lines and cells from primary tumor samples. In these assays we could show that it was possible to find sensitive cell lines for each individual drug, demonstrating that all the drugs on the plate were active [16,17] (data not shown).
To calculate the relationship between the in vitro drug concentrations and the in vivo ones, we used area under curve (AUC; area under the plasma, concentration curve versus time) values of the individual drugs. For this comparison Quotient of Area Under Curve values (QAUC72 hr) were determined by the following formula:
The in vivo AUC72 hr corresponds to the area under curve value achieved in patients under a 72 hours period. The in vivo AUC72 hr was established from the clinical dose and half-time using the standard trapezoidal rule calculation. The in vivo AUC72 hr data is summarized in the seventh column of Table 1. The detailed references to the clinical dose and to the in vivo halftime data are available at the Swedish pharmacological website http://fass.se. A QAUC72 hr value higher than 1 indicates that the in vitro drug concentration is higher than the one used in the clinical practice. If this value is 1, it means that the in vitro concentration corresponds to the clinically achieved in vivo concentration.
Results
The in vitro drug sensitivity assay
We have tested the drug sensitivity patterns of the body cavity lymphoma lines in short term, in vitro survival assays. The clinical origin and viral status of the individual lines is summarized in Figure 1. Each cell line was tested against 27 different drugs, in triplicates, at four different concentrations. The assay was carried out on 384 well plates. After 3 days of incubation each individual well of the test plates was photographed using a custom developed, automated extended field confocal microscope. Living and dead cells were differentially stained using viability dependent fluorescent dyes as shown in Figure 2. Each individual living or dead cell was identified counted and their fluorescence intensity distribution was recorded using automated image analytic and quantitation programs. For each well the percentage of surviving cells was calculated by comparing the number of living cells in the given well to the average of living cells in the untreated control wells.
Figure 1.

Heat map representation of the hierarchical clustering of the simplified drug sensitivity data of the individual cell lines against all the drugs along with the presence of EBV in the cell lines, the HIV status and the age of the patients and the anatomical location of the founder sample (A - ascites, P - pleural effusion, B - blood). Intensity of the color shows the scale of the sensitivity. Black is resistant, brightness of the red color is proportional to the effectiveness of the drug.
Figure 2.
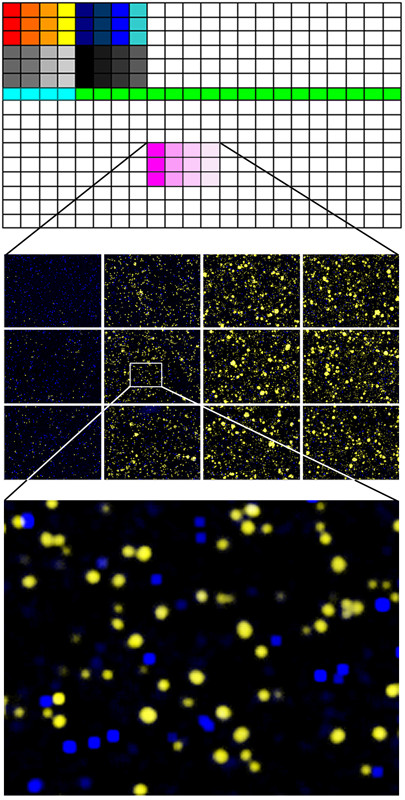
In vitro drug resistance of body cavity cell lines was assessed using a 3 day survival assay on microtiter plates on single cell level. The top panel shows the 384 well plates, the colored area shows the drugs, each at 4 different concentrations in triplicates. The highest concentrations are on the left and each adjacent column represents a 5-fold serial dilution. The middle panel is the magnification of a mosaic of microscopic images of six wells treated with the dilution series of one drug. The living and dead cells were differentially stained using fluorescent dyes as shown in yellow and blue colors on the digitally colored images. The bottom panel shows a close-up of a single microscopic field within one well.
The summarized drug sensitivity pattern of the body cavity lymphoma cell lines
The summarized cell survival data is shown in Figure 3. The middle line of the individual curves represents the Mean Cell Survival (MCS) for all the cell lines along with the ± Standard Deviations of the means (SD - gray shaded area) for the four different dilutions of the 27 drugs. Drugs were considered to be more universally active if they showed less standard deviation around the means.
Figure 3.
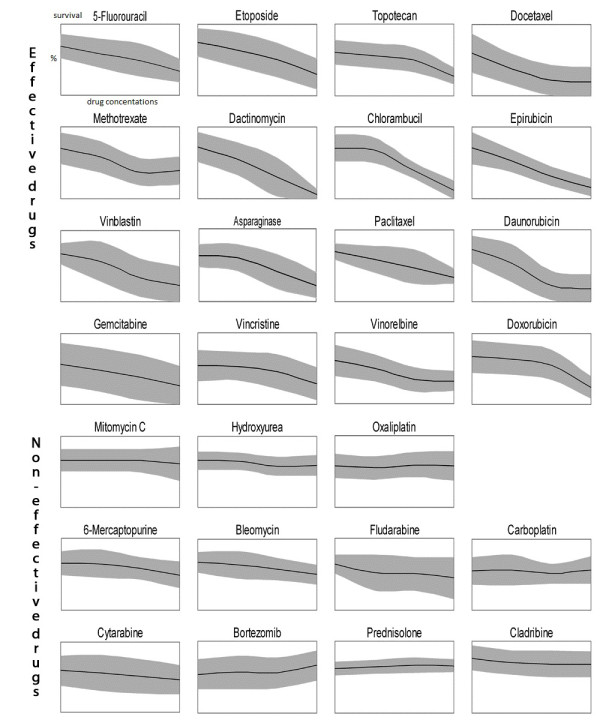
Mean values and standard deviations of drug sensitivity of eleven body cavity cell lines for 27 different cytostatic drugs; x axis: increasing concentrations of the drug, y axis: fraction of surviving cells 0-100%. The drug was considered to be effective if the survival was below 50% at least at one concentration. Non-effective drugs: survival is above 50% even at the highest concentration.
Most of the lines were sensitive for sixteen of the 27 drugs where sensitivity was defined as less than 50% mean survival at any of the drug dilutions (effective drugs). If more than half of the cells were alive even at the highest concentration than the drug was considered to be ineffective.
We found that the sixteen effective drugs against body-cavity lymphoma were the following in the order of effectiveness: Dactinomycin, Chlorambucil, Paclitaxel, Vinorelbine, Epirubicin, Docetaxel, Daunorubicin, Vinblastin, Doxorubicin, Etoposide, Gemcitabine, Asparaginase, Fluorouracil, Topotecan, Vincristine and Methotrexate.
Most body-cavity lymphoma lines were resistant to Oxaliplatin, Bleomycin, 6-Mercaptopurine, Hydroxyurea, Cladribine, Carboplatin, Bortezomib, Cytosine-arabinosid, Prednisolone, Mitomycin and Fludarabin. Although the Oxaliplatin, Cisplatin and Prednisolone drugs were not effective against any of the body-cavity lymphoma lines these drugs show concentration-dependent growth-inhibitory effect on other cell lines or primary tumors in parallel experiments (data not shown) at the same concentration as used in this paper [18].
Heat map of the cluster analysis
In order to identify possible co-segregation of the sensitivity patterns of the individual drugs as well as to systematically compare all the lines with each other, we have carried out unsupervised two-dimensional hierarchical clustering of the simplified drug sensitivity data using the Cluster 3.0 program for MacOS X. The results were visualized using the program TreeView [19]. The sensitivity to the drug was represented on a 5 step scale where every step represents less than 50% viability at the four different drug dilutions. (Resistant - if more than 50% survival at the highest concentration, maximum sensitivity - if less than 50% survival at the lowest concentration.) The graphical representation of the clustering results, along with the EBV, HIV status and the presence of concomitant Kaposi sarcoma, are shown in Figure 1.
Pharmacokinetic comparison
Absolute drug sensitivity values have relatively little clinical relevance if they are not correlated with clinically achievable in vivo concentrations. In order to analyze the data in relation to the pharmacokinetic behavior of the given drugs we have plotted the mean survival values as the function of the Quotient of the Area Under Curve (QAUC72 hr) values of the particular drugs. The QAUC72 hr values of a drug were created by dividing the calculated in vitro AUC72 hr values by the in vivo achievable AUC values (which were calculated from clinical dose and half-time). As shown in Figure 4. most drugs were tested in the pharmacologically most relevant range of QAUC72 hr (close to 1).
Figure 4.

Drug sensivity mean values of the survival of the body cavity lymphoma lines, plotted against QAUC72 hrs values identify Epirubicin, Daunorubicin, Vinorelbine and Paclitaxel as novel candidate drugs against body cavity lymphomas.
Plotting the mean cell survival for each individual drug against a common QAUC72 hr axis shows that Daunorubicin, Epirubicin, Paclitaxel and Vinorelbine were the most effective drugs (low survival at low QAUC72 hr values). Moreover most body cavity lymphoma lines were sensitive to these drugs. Importantly, Doxorubicin, the only antracyclin drug that is currently included in chemotherapy protocols against body cavity lymphomas showed a rather heterogeneous effect. Two of the eleven lines were highly sensitive for Doxorubicin whereas two were completely resistant at the maximum drug concentration that we could reach in the current assay (QAUC = 0.11). The two lines (JSC-1 and BC-3) were, in general, the least sensitive for chemotherapeutic drugs, however were still sensitive for Daunorubicin, Epirubicin and Vinorelbine.
Dactinomycin showed the highest killing efficiency in the present in vitro assay. The calculation of the QAUC72 hr value for the corresponding Dactinomycin concentration however revealed that the concentration that was required for the high killing effect is higher than the levels that are realistically achievable in a patient.
When treating the body-cavity lymphoma cells with Carboplatin at low QAUC72 hr values, a relative increase in the number of surviving cells was observed as compared to non-treated controls. The survival was above 100% in case of all the 11 lines suggesting that low dose Carboplatin protected from spontaneous cell death.
Discussion
In vitro growing cell lines are the closest model systems available today for studying the biological features of body cavity lymphomas. The cell lines that were used in the present study represent a variety of different origin. The investigation included cell lines established from ascites fluid, pleural effusion or from the peripheral blood of PEL patients. Despite their different origin, the body-cavity lymphoma lines showed a remarkably similar sensitivity pattern for a number of drugs. Only one cell line was highly resistant for most of the drugs (JSC1) whereas two cell lines (BC1 and BCBL-1) showed increased overall sensitivity to most of the drugs.
The presented data suggests that, for a number of cytostatic drugs the body cavity lymphoma cell lines share a common cytotoxic drug sensitivity profile. These profiles show no obvious correlation with the biological or clinical features of the lymphomas. Clustering of the drug sensitivity data revealed that the profiles are independent of the EBV status, anatomical localization of the lesion, the age the patient or the rapidity of the progression of the disease. The two cell lines (BCP-1 and BC-3) that arouse from HIV negative patients showed relatively low drug sensitivity.
The current treatment alternative is a combination of Methotrexate with CHOP (Cyclophosphamide, Doxorubicin, Prednisolone, Vincristine)-regimes. The present data showed that the cell lines exhibit varying sensitivity to Methotrexate and Vincristine and are completely resistant to Prednisolone.
Cyclophosphamide or Ifosphamide were not tested on the body cavity lymphoma lines, because both of these compounds are prodrugs that have to be converted into active metabolites by the liver in vivo.
It has been reported that the proteasome inhibitor Bortezomib induces apoptosis of the cell lines BCBL-1 and BCP-1 in vitro [13]. In this study only BCBL-1 showed detectable sensitivity to Bortezomib and only at the highest concentration whereas all the other lines were resistant.
In the present study body cavity lymphoma lines showed considerable sensitivity for anti-microtubule drugs and anthracyclins. Importantly all lines were sensitive to Epirubicin and Vinorelbine even at low QAUC72 hr values. Epirubicin required tenfold lower concentration than the in vivo achievable concentration to kill more than 80% of the cells for most of the lines. Epirubicin is primarily used against breast and ovarian cancer, gastric cancer, lung cancer and lymphomas, but has not yet been tested against body cavity lymphomas [20].
In summary, the analysis of drug sensitivity profiles of the available body cavity lymphoma lines against 27 commonly used drugs revealed considerable heterogeneity in drug response. Four drugs, namely, Daunorubicin, Epirubicin, Paclitaxel and Vinorelbine showed uniformly high efficiency on the cell lines. These drugs are not yet included in the current chemotherapy protocols of body cavity lymphomas. The heterogeneity of drug response also suggests that optimal care of the lymphoma patients would include the determination of drug sensitivity patterns of the primary tumor samples and that these patients would benefit from assay guided individualized therapy.
Conclusions
We suggest that inclusion of the above drugs into PEL chemotherapy protocols may be justified. The heterogeneity in the drug response pattern however indicated that assay guided individualized therapy might be required to optimize therapeutic response.
Competing interests
The authors declare that they have no competing interests.
Authors' contributions
The project was conceived and designed by LS. The experiments were mainly carried out and/or coordinated by ÖR. LLK, AG and LM took part in cell culturing, and preparation of the microtiter plates for in vitro drug sensitivity assays. EF was responsible for measuring the plates using the automated laser confocal fluorescent microscope. LS and EF wrote the computer programs QuantCapture 4.0 and QuantCount 5.0. LM and HS analysed and interpreted the data. SE made comparable the in vitro results with the in vivo data. JK, LG, AC together with the other authors have been involved in the planning of the experimental details, and the drafting and critical reading of the manuscript. All authors read and approved the final manuscript.
Pre-publication history
The pre-publication history for this paper can be accessed here:
Contributor Information
Rita Ötvös, Email: rita.otvos@ki.se.
Henriette Skribek, Email: henriette.skribek@ki.se.
Lorand L Kis, Email: lorand.kis@karolinska.se.
Annunziata Gloghini, Email: annunziata.gloghini@istituto.mi.it.
Laszlo Markasz, Email: markaszl@freemail.hu.
Emilie Flaberg, Email: emilie.flaberg@ki.se.
Staffan Eksborg, Email: konya@med.unideb.hu.
Jozsef Konya, Email: konya@med.unideb.hu.
Lajos Gergely, Email: gl@jaguar.unideb.hu.
Antonino Carbone, Email: acarbone@cro.it.
Laszlo Szekely, Email: laszlo.szekely@ki.se.
Acknowledgements
We thank the Swedish Research Council, Cancer Research Institute/Concern Foundation for Cancer Research and the IRIS center for economic support. The study sponsors had no role in the conduct of the study, in the collection, management, analysis, or interpretation of data, or in the preparation, review, or approval of the manuscript.
References
- Carbone A, Gloghini A. KSHV/HHV8-associated lymphomas. Br J Haematol. 2008;140(1):13–24. doi: 10.1111/j.1365-2141.2007.06879.x. [DOI] [PubMed] [Google Scholar]
- Boulanger E, Daniel MT, Agbalika F, Oksenhendler E. Combined chemotherapy including high-dose methotrexate in KSHV/HHV8-associated primary effusion lymphoma. Am J Hematol. 2003;73(3):143–148. doi: 10.1002/ajh.10341. [DOI] [PubMed] [Google Scholar]
- Komanduri KV, Luce JA, McGrath MS, Herndier BG, Ng VL. The natural history and molecular heterogeneity of HIV-associated primary malignant lymphomatous effusions. J Acquir Immune Defic Syndr Hum Retrovirol. 1996;13(3):215–226. doi: 10.1097/00042560-199611010-00003. [DOI] [PubMed] [Google Scholar]
- Morassut S, Vaccher E, Balestreri L, Gloghini A, Gaidano G, Volpe R, Tirelli U, Carbone A. HIV-associated human herpesvirus 8-positive primary lymphomatous effusions: radiologic findings in six patients. Radiology. 1997;205(2):459–463. doi: 10.1148/radiology.205.2.9356629. [DOI] [PubMed] [Google Scholar]
- Nador RG, Cesarman E, Chadburn A, Dawson DB, Ansari MQ, Sald J, Knowles DM. Primary effusion lymphoma: a distinct clinicopathologic entity associated with the Kaposi's sarcoma-associated herpes virus. Blood. 1996;88(2):645–656. [PubMed] [Google Scholar]
- Ansari MQ, Dawson DB, Nador R, Rutherford C, Schneider NR, Latimer MJ, Picker L, Knowles DM, McKenna RW. Primary body cavity-based AIDS-related lymphomas. Am J Clin Pathol. 1996;105(2):221–229. doi: 10.1093/ajcp/105.2.221. [DOI] [PubMed] [Google Scholar]
- Otsuki T, Kumar S, Ensoli B, Kingma DW, Yano T, Stetler-Stevenson M, Jaffe ES, Raffeld M. Detection of HHV-8/KSHV DNA sequences in AIDS-associated extranodal lymphoid malignancies. Leukemia. 1996;10(8):1358–1362. [PubMed] [Google Scholar]
- Karcher DS, Alkan S. Human herpesvirus-8-associated body cavity-based lymphoma in human immunodeficiency virus-infected patients: a unique B-cell neoplasm. Hum Pathol. 1997;28(7):801–808. doi: 10.1016/s0046-8177(97)90153-2. [DOI] [PubMed] [Google Scholar]
- Valencia ME, Martinez P, Moreno V, Laguna F, Lahoz JG. AIDS-related body cavity-based lymphomas, herpesvirus-8 and HIV infection: a study of seven cases. Aids. 1999;13(18):2603–2605. doi: 10.1097/00002030-199912240-00021. [DOI] [PubMed] [Google Scholar]
- Boulanger E, Agbalika F, Maarek O, Daniel MT, Grollet L, Molina JM, Sigaux F, Oksenhendler E. A clinical, molecular and cytogenetic study of 12 cases of human herpesvirus 8 associated primary effusion lymphoma in HIV-infected patients. Hematol J. 2001;2(3):172–179. doi: 10.1038/sj.thj.6200096. [DOI] [PubMed] [Google Scholar]
- Chen YB, Rahemtullah A, Hochberg E. Primary effusion lymphoma. Oncologist. 2007;12(5):569–576. doi: 10.1634/theoncologist.12-5-569. [DOI] [PubMed] [Google Scholar]
- Halfdanarson TR, Markovic SN, Kalokhe U, Luppi M. A non-chemotherapy treatment of a primary effusion lymphoma: durable remission after intracavitary cidofovir in HIV negative PEL refractory to chemotherapy. Ann Oncol. 2006;17(12):1849–1850. doi: 10.1093/annonc/mdl139. [DOI] [PubMed] [Google Scholar]
- An J, Sun Y, Fisher M, Rettig MB. Antitumor effects of bortezomib (PS-341) on primary effusion lymphomas. Leukemia. 2004;18(10):1699–1704. doi: 10.1038/sj.leu.2403460. [DOI] [PubMed] [Google Scholar]
- Flaberg E, Stuber G, Szekely L. Multi-dimensional laser confocal microscopy on live cells in submicroliter volumes using glass capillaries. Acta Histochem Cytochem. 2006;39(4):103–106. doi: 10.1267/ahc.05056. [DOI] [PMC free article] [PubMed] [Google Scholar]
- Flaberg E, Sabelstrom P, Strandh C, Szekely L. Extended Field Laser Confocal Microscopy (EFLCM): combining automated Gigapixel image capture with in silico virtual microscopy. BMC Med Imaging. 2008;8:13. doi: 10.1186/1471-2342-8-13. [DOI] [PMC free article] [PubMed] [Google Scholar]
- Markasz L, Kis LL, Stuber G, Flaberg E, Otvos R, Eksborg S, Skribek H, Olah E, Szekely L. Hodgkin-lymphoma-derived cells show high sensitivity to dactinomycin and paclitaxel. Leuk Lymphoma. 2007;48(9):1835–1845. doi: 10.1080/10428190701559132. [DOI] [PubMed] [Google Scholar]
- Markasz L, Stuber G, Flaberg E, Jernberg AG, Eksborg S, Olah E, Skribek H, Szekely L. Cytotoxic drug sensitivity of Epstein-Barr virus transformed lymphoblastoid B-cells. BMC Cancer. 2006;6:265. doi: 10.1186/1471-2407-6-265. [DOI] [PMC free article] [PubMed] [Google Scholar]
- Skribek H, Otvos R, Flaberg E, Nagy N, Markasz L, Eksborg S, Masszi T, Kozma A, Adam E, Miseta A. et al. Chronic lymphoid leukemia cells are highly sensitive to the combination of prednisolone and daunorubicin, but much less to doxorubicin or epirubicin. Exp Hematol. 2010;38(12):1219–1230. doi: 10.1016/j.exphem.2010.09.001. [DOI] [PubMed] [Google Scholar]
- de Hoon MJ, Imoto S, Nolan J, Miyano S. Open source clustering software. Bioinformatics. 2004;20(9):1453–1454. doi: 10.1093/bioinformatics/bth078. [DOI] [PubMed] [Google Scholar]
- Cersosimo RJ, Hong WK. Epirubicin: a review of the pharmacology, clinical activity, and adverse effects of an adriamycin analogue. J Clin Oncol. 1986;4(3):425–439. doi: 10.1200/JCO.1986.4.3.425. [DOI] [PubMed] [Google Scholar]
- Crews KR, Liu T, Rodriguez-Galindo C, Tan M, Meyer WH, Panetta JC, Link MP, Daw NC. High-dose methotrexate pharmacokinetics and outcome of children and young adults with osteosarcoma. Cancer. 2004;100(8):1724–1733. doi: 10.1002/cncr.20152. [DOI] [PubMed] [Google Scholar]
- Albertioni F, Lindemalm S, Reichelova V, Pettersson B, Eriksson S, Juliusson G, Liliemark J. Pharmacokinetics of cladribine in plasma and its 5'-monophosphate and 5'-triphosphate in leukemic cells of patients with chronic lymphocytic leukemia. Clin Cancer Res. 1998;4(3):653–658. [PubMed] [Google Scholar]
- Hersh MR, Kuhn JG, Phillips JL, Clark G, Ludden TM, Von Hoff DD. Pharmacokinetic study of fludarabine phosphate (NSC 312887) Cancer Chemother Pharmacol. 1986;17(3):277–280. doi: 10.1007/BF00256699. [DOI] [PubMed] [Google Scholar]
- Chan GL, Erdmann GR, Gruber SA, Stock P, Chen S, Ascher NL, Canafax DM. Pharmacokinetics of 6-thiouric acid and 6-mercaptopurine in renal allograft recipients after oral administration of azathioprine. Eur J Clin Pharmacol. 1989;36(3):265–271. doi: 10.1007/BF00558158. [DOI] [PubMed] [Google Scholar]
- Gruber A, Liliemark E, Tidefelt U, Paul C, Bjorkholm M, Peterson C, Liliemark J. Pharmacokinetics of mitoxantrone, etoposide and cytosine arabinoside in leukemic cells during treatment of acute myelogenous leukemia--relationship to treatment outcome and bone marrow toxicity. Leuk Res. 1995;19(10):757–761. doi: 10.1016/0145-2126(95)00061-r. [DOI] [PubMed] [Google Scholar]
- Casale F, Canaparo R, Serpe L, Muntoni E, Pepa CD, Costa M, Mairone L, Zara GP, Fornari G, Eandi M. Plasma concentrations of 5-fluorouracil and its metabolites in colon cancer patients. Pharmacol Res. 2004;50(2):173–179. doi: 10.1016/j.phrs.2004.01.006. [DOI] [PubMed] [Google Scholar]
- Fogli S, Danesi R, Gennari A, Donati S, Conte PF, Del Tacca M. Gemcitabine, epirubicin and paclitaxel: pharmacokinetic and pharmacodynamic interactions in advanced breast cancer. Ann Oncol. 2002;13(6):919–927. doi: 10.1093/annonc/mdf164. [DOI] [PubMed] [Google Scholar]
- GlaxoSmithKline Research Triangle Park N. Prescribing Information Leukeran®. http://www.drugs.com/monograph/leukeran.html
- Ghazal-Aswad S, Calvert AH, Newell DR. A single-sample assay for the estimation of the area under the free carboplatin plasma concentration versus time curve. Cancer Chemother Pharmacol. 1996;37(5):429–434. doi: 10.1007/s002800050408. [DOI] [PubMed] [Google Scholar]
- Graham MA, Lockwood GF, Greenslade D, Brienza S, Bayssas M, Gamelin E. Clinical pharmacokinetics of oxaliplatin: a critical review. Clin Cancer Res. 2000;6(4):1205–1218. [PubMed] [Google Scholar]
- Rischin D, Ackland SP, Smith J, Garg MB, Clarke S, Millward MJ, Toner GC, Zalcberg J. Phase I and pharmacokinetic study of docetaxel in combination with epirubicin and cyclophosphamide in advanced cancer: dose escalation possible with granulocyte colony-stimulating factor, but not with prophylactic antibiotics. Ann Oncol. 2002;13(11):1810–1818. doi: 10.1093/annonc/mdf305. [DOI] [PubMed] [Google Scholar]
- Bates SE, Bakke S, Kang M, Robey RW, Zhai S, Thambi P, Chen CC, Patil S, Smith T, Steinberg SM. et al. A phase I/II study of infusional vinblastine with the P-glycoprotein antagonist valspodar (PSC 833) in renal cell carcinoma. Clin Cancer Res. 2004;10(14):4724–4733. doi: 10.1158/1078-0432.CCR-0829-03. [DOI] [PubMed] [Google Scholar]
- Desai ZR, Van den Berg HW, Bridges JM, Shanks RG. Can severe vincristine neurotoxicity be prevented? Cancer Chemother Pharmacol. 1982;8(2):211–214. doi: 10.1007/BF00255486. [DOI] [PubMed] [Google Scholar]
- Freyer G, Delozier T, Lichinister M, Gedouin D, Bougnoux P, His P, Imadalou K, Trillet-Lenoir V. Phase II study of oral vinorelbine in first-line advanced breast cancer chemotherapy. J Clin Oncol. 2003;21(1):35–40. doi: 10.1200/jco.2003.09.057. [DOI] [PubMed] [Google Scholar]
- Andersson B, Andersson I, Beran M, Ehrsson H, Eksborg S. Liquid chromatographic monitoring of daunorubicin and daunorubicinol in plasma from leukemic patients treated with daunorubicin or the daunorubicin-DNA complex. Cancer Chemother Pharmacol. 1979;2(1):15–17. doi: 10.1007/BF00253099. [DOI] [PubMed] [Google Scholar]
- Toffoli G, Corona G, Cattarossi G, Boiocchi M, Di Gennaro G, Tirelli U, Vaccher E. Effect of highly active antiretroviral therapy (HAART) on pharmacokinetics and pharmacodynamics of doxorubicin in patients with HIV-associated non-Hodgkin's lymphoma. Ann Oncol. 2004;15(12):1805–1809. doi: 10.1093/annonc/mdh464. [DOI] [PubMed] [Google Scholar]
- Veal GJ, Cole M, Errington J, Parry A, Hale J, Pearson AD, Howe K, Chisholm JC, Beane C, Brennan B. et al. Pharmacokinetics of dactinomycin in a pediatric patient population: a United Kingdom Children's Cancer Study Group Study. Clin Cancer Res. 2005;11(16):5893–5899. doi: 10.1158/1078-0432.CCR-04-2546. [DOI] [PubMed] [Google Scholar]
- Peng YM, Alberts DS, Chen HS, Mason N, Moon TE. Antitumour activity and plasma kinetics of bleomycin by continuous and intermittent administration. Br J Cancer. 1980;41(4):644–647. doi: 10.1038/bjc.1980.110. [DOI] [PMC free article] [PubMed] [Google Scholar]
- Kozuch P, Hoff PM, Hess K, Adams J, Newman RA, Lee F, Pazdur R. Phase I bioequivalency study of MitoExtra and mitomycin C in patients with solid tumors. Cancer. 2001;91(4):815–821. [PubMed] [Google Scholar]
- Yan JH, Ataga K, Kaul S, Olson JS, Grasela DM, Gothelf S, Kutlar A, Orringer E. The influence of renal function on hydroxyurea pharmacokinetics in adults with sickle cell disease. J Clin Pharmacol. 2005;45(4):434–445. doi: 10.1177/0091270004273526. [DOI] [PubMed] [Google Scholar]
- Gerrits CJ, Schellens JH, Burris H, Eckardt JR, Planting AS, van der Burg ME, Rodriguez GI, Loos WJ, van Beurden V, Hudson I. et al. A comparison of clinical pharmacodynamics of different administration schedules of oral topotecan (Hycamtin) Clin Cancer Res. 1999;5(1):69–75. [PubMed] [Google Scholar]
- Ylikangas P, Mononen I. Serious neutropenia in ALL patients treated with L-asparaginase may be avoided by therapeutic monitoring of the enzyme activity in the circulation. Ther Drug Monit. 2002;24(4):502–506. doi: 10.1097/00007691-200208000-00007. [DOI] [PubMed] [Google Scholar]
- Papandreou CN, Daliani DD, Nix D, Yang H, Madden T, Wang X, Pien CS, Millikan RE, Tu SM, Pagliaro L. et al. Phase I trial of the proteasome inhibitor bortezomib in patients with advanced solid tumors with observations in androgen-independent prostate cancer. J Clin Oncol. 2004;22(11):2108–2121. doi: 10.1200/JCO.2004.02.106. [DOI] [PubMed] [Google Scholar]
- Penzak SR, Formentini E, Alfaro RM, Long M, Natarajan V, Kovacs J. Prednisolone pharmacokinetics in the presence and absence of ritonavir after oral prednisone administration to healthy volunteers. J Acquir Immune Defic Syndr. 2005;40(5):573–580. doi: 10.1097/01.qai.0000187444.38461.70. [DOI] [PubMed] [Google Scholar]