

When the activity of a drug can be expressed in terms of a stable standard which does not differ from it qualitatively, there is no difficulty in getting reproducible results, since all the assays tend to give the same answer, and any degree of accuracy can be attained provided that the experiment is repeated sufficiently often. When, however, the activity of a new drug or drug antagonist has to be defined in terms either of some other drug or of some of its own effects, the results are not equally reproducible since the apparent activity varies in successive experiments, even though conditions are kept as constant as possible. The difficulty of making results of one laboratory available to another is aggravated by the multiplicity of methods used and frequently by the lack of information of their variability; this applies particularly to methods of expressing drug antagonism.
It would obviously be of advantage if some common method of expressing drug antagonism could be agreed upon. In the present paper it is proposed to introduce a new measure of drug antagonism, pA, based on a suggestion made originally by Clark and Raventos (1937). Apparatus and methods are described for determining pA accurately on the guinea-pig's ileum, and the activity of several known antagonists of histamine and acetylcholine has been measured in terms of pA. The variability of the pA measure has been estimated and methods are discussed of obtaining reproducible results in the most economical way.
Apparatus
All the experiments were done on the isolated ileum of the guinea-pig. The apparatus used for assaying drug antagonists is shown in Fig. 1. It consists essentially of a gut bath which can communicate with two alternative systems, one of which is filled with ordinary Tyrode solution and the other with Tyrode solution containing the antagonistic drug; the latter solution can be replaced in the course of the experiment without interfering with the assay.
Fig. 1.
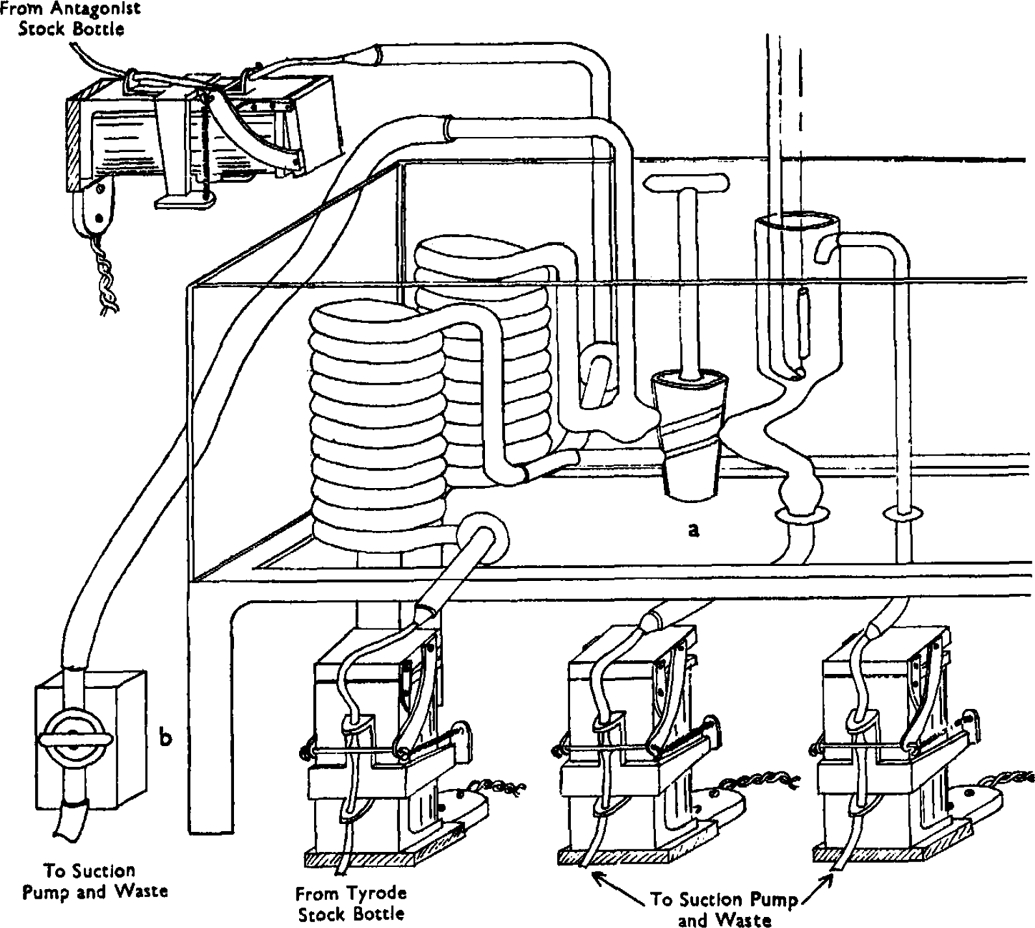
Apparatus for assaying drug antagonists. Two stock bottles provide the inflow; one filled with Tyrode solution, and the other with a Tyrode solution of the antagonist drug. All the outflows are connected to a water suction pump. The electro-magnets compressing rubber tubing are automatically operated through the selector circuit shown in Fig. 2. They are standard P.O. telephone relays of 3,000–6,000 ohms resistance operated directly from D.C. mains, with a special armature made in our workshop. The movement of the armature is controlled by two coiled springs which tend to compress rubber tubing of 2×4 mm. diameter by means of a thin brass rod.
All the operations involved in an assay, except the injection of the drug, are performed automatically. The principle of the method has been described before (Schild, 1946): “Telephone relays are converted to compress rubber tubing. When the relays are activated the rubber tubing is decompressed and fluid is allowed to flow. These relays control the emptying and filling and the adjustment of fluid level of an isolated organ bath. They are activated at regular time intervals through a telephone uniselector which makes 12 successive contacts in a cycle. The duration of each contact is usually 15 sec., thus producing a cycle of 3 min. The selector also controls the movements of the drum and a light signal to time the injection of drugs.” A diagram of the selector circuit is shown in Fig. 2.*
Fig. 2.
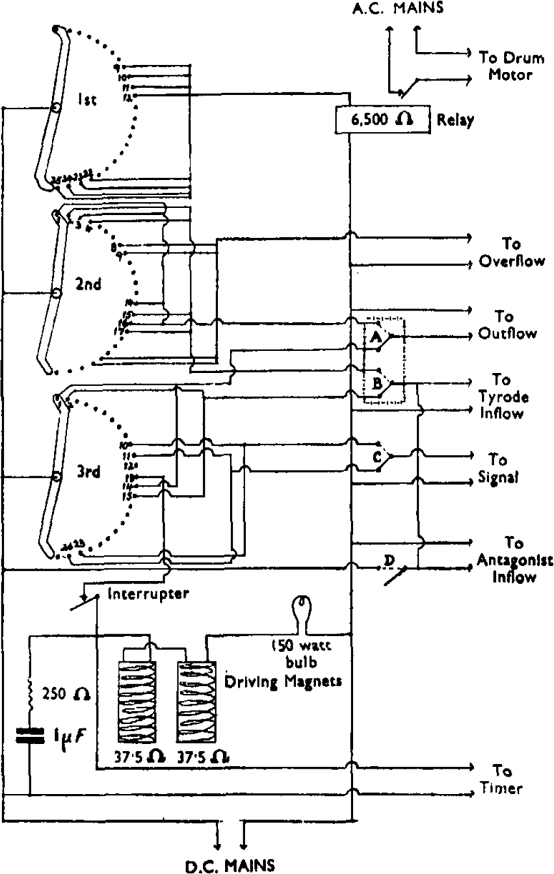
Diagram of selector circuit for one muscle bath.
The present apparatus differs in the following respects from the one previously described:
An additional inflow relay is provided to control the inflow of the antagonistic solution. The two inflow relays are activated simultaneously, allowing one of the two solutions to flow into the bath according to the position of the 3-way tap. By means of switch D (Fig. 2) the selector can be short-circuited and the inflow relays activated directly. If the solution in the system containing the antagonistic drug is to be replaced, the 3-way tap a (Fig. 1) is turned into the null position, switch D is activated, and tap b is opened, allowing the solution to drain into the exhaust.
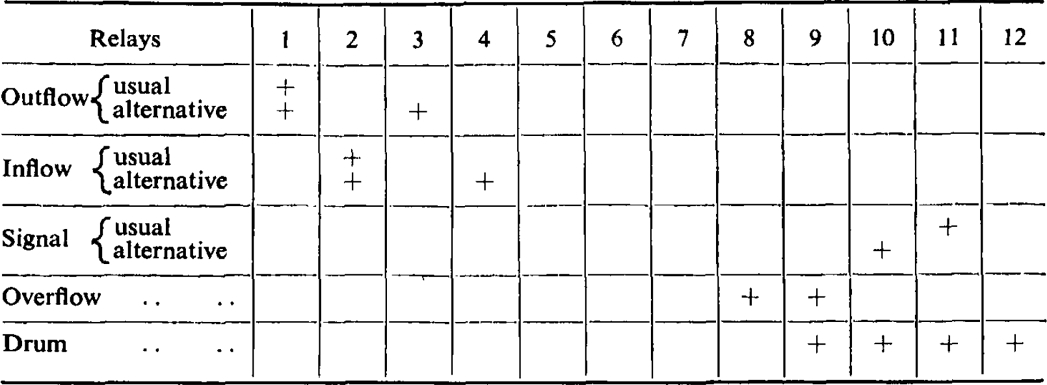
Switches A, B, and C control certain alternative arrangements of the cycle. By means of switches A and B the gut bath may be emptied and refilled twice in succession instead of only once. By means of switch C the signal may be advanced by 15 sec., permitting a longer period of contact between drug and tissue. Table I shows the automatic operations performed in a complete cycle together with the possible alternative arrangements.
The outflows are operated by suction.
A new type of adjustment for telephone relays has been used to compress rubber tubing. The adjustment is somewhat more complicated than the one previously described, but it is more efficient and stable. It is illustrated in Fig. 1.
Two gut baths have been operated simultaneously. The baths were contained in a large thermostatically controlled tank, stirred by a circulating water-pump. As a rule a lag period of 30 sec. was maintained between the two cycles, tracings being recorded on two independent drums situated at opposite ends of the tank.
Table I.
Steps in Cycle
 |
The writing lever used in these experiments is illustrated in Fig. 3.
Fig. 3.
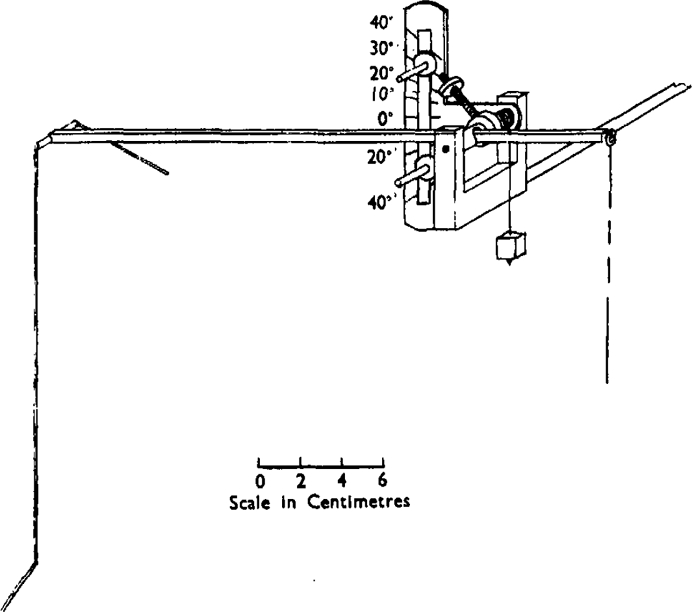
Approximately linear and isotonic frontal writing lever.
It may be asked to what extent these modifications of the usual Burn-Dale isolated organ bath are essential for these experiments.
The purpose of the automatic apparatus is to ensure constant time intervals and bath volumes, to enable more than one assay to be performed at the same time and in general to enable the experimenter to divert his attention from servicing the bath and drum. In practice the automatic apparatus has been found very useful, but it is obviously not essential for carrying out these tests since all the operations can be performed by hand.
The main purpose of adding the antagonistic drug to the bath fluid before it reaches the gut, instead of adding it in the usual way by injection into the muscle bath, is to prevent the gut coming into contact with pure Tyrode solution during the period of replacement of the bath fluid when the effect of an antagonist on successive contractions is being investigated. The present method is thus particularly suitable for investigating the effect of antagonists in relation to time, whilst both methods are suitable for determining the effect of antagonists on a single contraction. The old method is most suited for preliminary experiments and for comparative measurements.
The purpose of the long writing point used on the frontal writing lever is to ensure that the relation between shortening of the gut and effect on the drum should be linear. This is especially important when the effects are measured in terms of a maximum contraction. The errors obtained with a shorter writing point are, however, usually not excessive, unless a very short writing point is used or the angle of excursion of the lever becomes greater than about 30° from the horizontal; this may be prevented by means of two adjustable stops limiting the excursion of the lever as shown in Fig. 3. The errors may be calculated from the formula given in a previous communication (Schild, 1944). The lever can be made practically isotonic by means of the screw adjustment shown on the pivot. The adjustment may be tested by suspending an appropriate weight at the point of attachment of the thread. The lever should then balance in every position in which it is likely to be used. The tension exerted by the lever in these experiments was of 600–800 mg.
The following antagonist drugs were used in these experiments:
Neoantergan, or N-p-methoxybenzyl-N-dimethylaminoethyl-α-aminopyridine acid maleate (Bovet, Horclois, and Walthert, 1944).
Benadryl, or dimethylaminoethyl benzhydryl ether hydrochloride (Loew, Kaiser, and Moore, 1945).
Pethidine, or ethyl 4 - phenyl −1 - methylpiperidine - − - carboxylate hydrochloride (Schaumann, 1940).
Atropine sulphate.
The pA Scale
pAx is defined as the negative logarithm to base 10 of the molar concentration of an antagonistic drug which will reduce the effect of a multiple dose (x) of an active drug to that of a single dose. Thus, if the presence of a concentration of 10−5.8 molar pethidine in the bath fluid reduces the effect of 2 μg. histamine to that produced, in the absence of pethidine, by 1 μg. histamine, pA2 pethidine-histamine = 5.8.
It is obvious that a constant of this nature can refer only to a given drug-antagonist pair acting on a definite pharmacological preparation, e.g., the guinea-pig's ileum, and that a representative pA value must be the mean of several individual determinations. pA values are dependent on the length of contact between antagonistic drug and tissue, but they are apparently independent of the absolute concentrations of the active drug used. These points will be discussed in detail later.
Method of determining pA2.—The principle of the method consists in finding two concentrations of the antagonistic drug such that one will reduce the effect of a double dose of the active drug to slightly less and the other to slightly more than the effect of a single dose. The concentration corresponding to pA2 is then computed by interpolation on a logarithmic scale.
The following results justify to some extent the use of a logarithmic scale for interpolation. In a series of pA2 determinations a third concentration of antagonist was added to test for linearity between log concentration of antagonist and effect. The points, plotted on a logarithmic scale in Fig. 4, each point representing the mean of several determinations, fall on approximately straight lines.
Fig. 4.
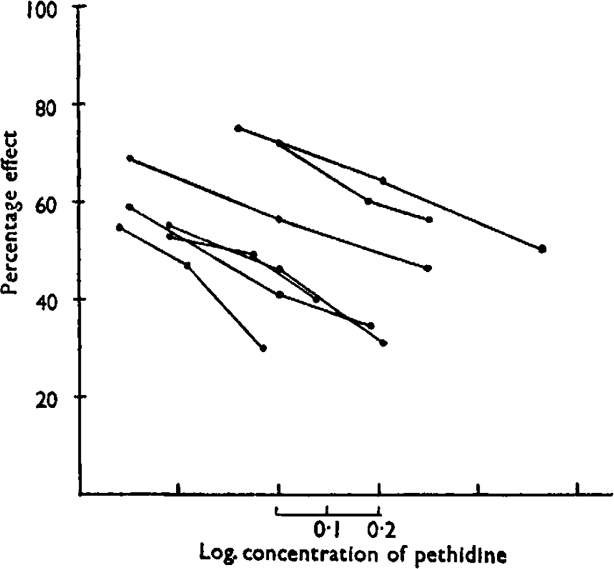
Guinea-pig ileum. Pethidine-histamine. Approximately linear relation between log concentration of pethidine and reduction of histamine effect.
In order to get reliable results a constant submaximal response to the stimulant drug must be produced before addition of the antagonist; 10–20 preliminary contractions may be required to achieve this. At this point the muscle chamber is joined to the system containing a Tyrode solution of the antagonistic drug, which now replaces Tyrode solution when the bath fluid is changed. At the next injection the dose of active drug is doubled. Injections of a double dose of active drug in the presence of the antagonist are continued for several periods (usually five periods) in order to observe whether the effect of the antagonist increases with increasing length of contact. Eventually the bath fluid is switched back to Tyrode solution to test for persistence of antagonistic effect and the assay is concluded by producing a series of maximal effects. A second concentration of antagonist is investigated in the same way, usually on a fresh piece of gut, and the results, expressed in terms of the maximal contraction, are used for interpolating pA2 values after various periods of contact with the antagonist.
As in these experiments the automatic apparatus was set to produce intervals of 3 min. between injections and pauses of 2 min. between completion of change of bath fluid and the next injection, the first pA measurement was made when the antagonistic drug had been in contact with the tissue for 2 min. and further determinations at 3 min. intervals. During this period the tissue never ceases to be in contact with the antagonistic drug which is contained in the bath fluid itself, and an even flow of stimulation at constant intervals is maintained as the period of contact with the antagonist is gradually increased.
Although tedious, the use of a fresh piece of gut for each concentration of the antagonist has been found to be the most satisfactory procedure when the effect of the antagonist is persistent. In our experience, variations in sensitivity to the action of antagonists of different segments of the same gut are remarkably small and are not correlated with variations in sensitivity to the stimulant drug, provided that pieces which are obviously damaged and insensitive are rejected. Although it is advantageous to use two pieces of gut simultaneously, this is not essential, since the guinea-pig ileum does not seem to alter appreciably in sensitivity if left in clear Tyrode solution at room temperature for several hours.
Fig. 5 (p. 205) illustrates two complete pA2 determinations done on six segments of the same gut. The object was to determine pA2 values after a short period of 2 min. and after a long period of 14 min. contact with the antagonist. The following two examples, quoted from the experiment shown in Fig. 5, illustrate the method of computing pA2:
Fig. 5.
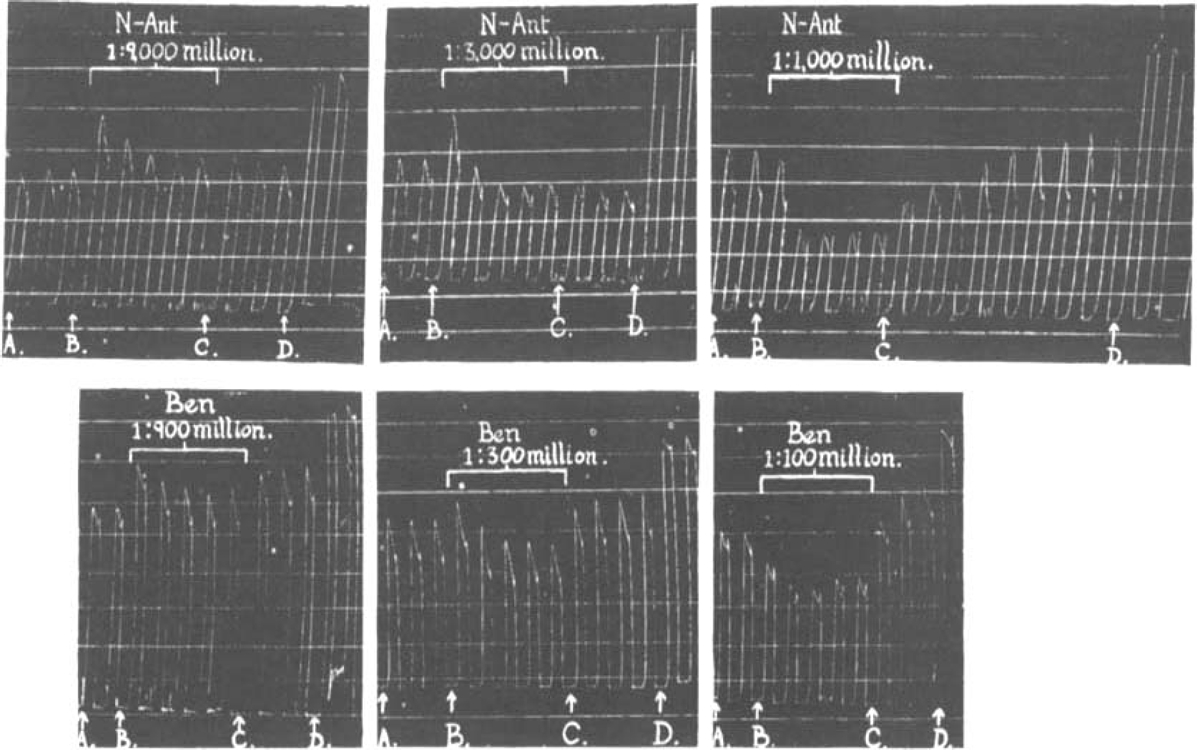
Neoantergan-histamine and benadryl-histamine. Complete pA2 assay. The whole assay of the two antagonists was done on the same animal; a separate piece of ileum was used for each concentration of antagonist. Before the addition of the antagonist the preparations were stabilized by a series of preliminary histamine injections. A–B: 0.5 μg. histamine, Tyrode. B–C: 1.0 μg. histamine, antagonistic solution. C–D: 1.0 μg. histamine, Tyrode. D: maximum effects. Bath volume = 18 c.c.
pA2 benadryl-histamine (2 min. contact).—After 2 min. contact between muscle and antagonistic drug a double dose of histamine in 10−7·94 molar benadryl (1:300 million) produces an effect which is 7 per cent (of the maximal effect) greater, and a double dose of histamine in 10−7·46 molar benadryl (1:100 million) an effect 11 per cent smaller, than that produced by a single dose of histamine in Tyrode. By interpolation the molar concentration of benadryl which would just reduce the effect of a double dose of histamine to that of a single dose is 10−7·75 (1:195 million). Hence pA2 (2 min. contact) = 7.75.
pA2 neoantergan-histamine (14 min. contact).—When the antagonist has been in contact with the muscle for 14 min. (5th injection in presence of antagonist) a double dose of histamine in 10−9·55 molar neoantergan (1:9,000 million) produces an effect 7 per cent greater, and the same dose in 10−9·08 molar neoantergan (1:3,000 million) an effect 10 per cent smaller, than a single dose of histamine in Tyrode. By interpolation pA2 (14 min. contact) = 9.36.
Independence of pA and concentration of antagonist.—Since the absolute concentration of the active drug does not enter into the definition of pA, it was of interest to find out whether the depression produced by a certain concentration of the antagonist was, in fact, independent of the concentration of active drug used. Although this is generally accepted as true (Gaddum, 1937), it seemed worth investigating the point, using a properly randomized experimental design which could be statistically analysed.
The experiments were carried out as follows. Several doses of the active drug alone and of the active drug plus antagonist were administered. If the antagonist produced the same amount of depression at each concentration of the active drug, the concentration–action curves in the presence and the absence of the antagonist should be parallel. Doses were administered repeatedly in a random order, and the results were analysed by means of analysis of variance for statistically significant deviations from parallelism.
Five such experiments were performed; three with pethidine-histamine, one with atropine-acetylcholine, and one with pethidine-acetylcholine. One of the experiments is illustrated in Fig. 6, each point on the curve representing the mean of four determinations. It will be seen that at each level the reduction of the histamine effect by pethidine was approximately the same. There was no statistically significant deviation from parallelism between the two curves. Similar results were obtained in the other experiments.
Fig. 6.
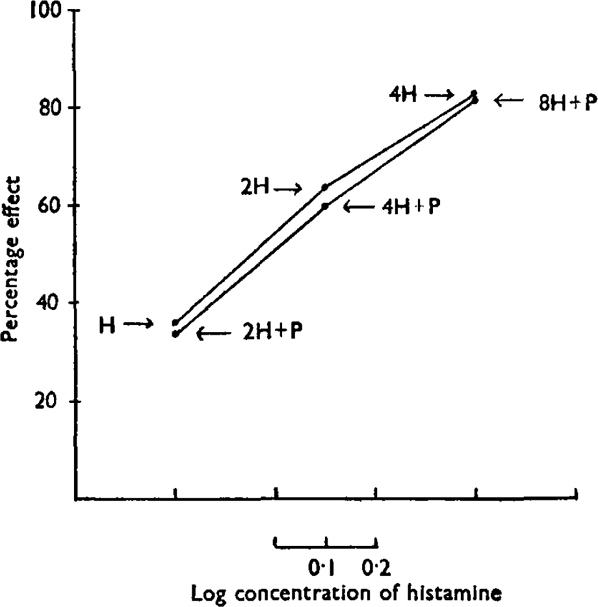
Effect of a constant dose of pethidine (P) on contraction produced by various concentrations of histamine (H). The depressor effect of the antagonist is independent of the contraction produced by the active drug. Upper curve: histamine alone. Lower curve: double dose of histamine + pethidine.
Antagonism of Neoantergan, Benadryl, Pethidine and Atropine Towards Histamine and Acetylcholine
The activity and relative specificity of these antagonists of histamine and acetylcholine can be conveniently summarized in terms of pA. In Fig. 7 the two vertical lines represent pA2 scales for antagonists of histamine and acetylcholine. The activity of an antagonist towards these drugs is indicated by its position on the scale, one scale division corresponding to a tenfold difference in activity. Points on the two scales referring to the same antagonist are joined. If an antagonistic drug does not discriminate between two active drugs, the line joining the scales is horizontal; if it discriminates sharply the line is steep, as with neoantergan and atropine. Neoantergan is the most discriminating of the four antagonists, being 40,000 times as active against histamine as it is against acetylcholine. Atropine is 1,000 times as active against acetylcholine as it is against histamine. Pethidine, on the other hand, discriminates hardly at all between the two.
Fig. 7.
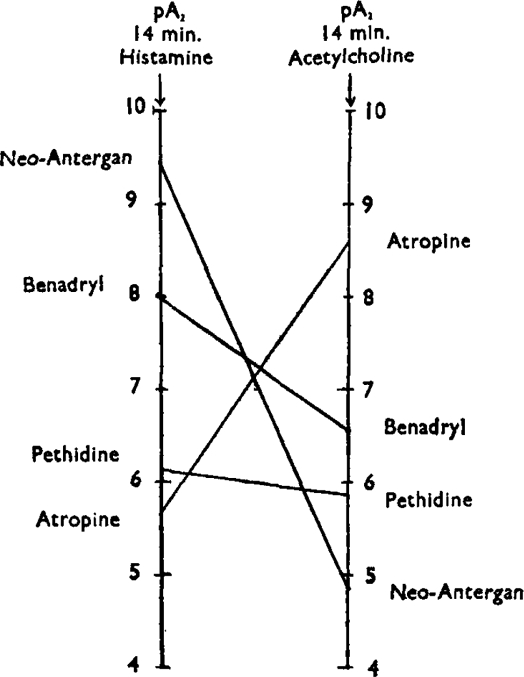
pA2 scales of histamine and acetylcholine. At the time of measurement the antagonist had been in contact with the tissue for 14 min. The results may be taken to represent approximately equilibrium conditions.
A single pA value is not sufficient to characterize an antagonist fully. To describe fully the relation between a given antagonist and an active drug it would be necessary to state completely both the time-action and the concentration-action relations of the system. Short of this, four characteristic pA values have been selected in the present study which together give some indication of the change of activity of an antagonist with concentration and with time. The following four pA values have been selected for this purpose: the pA2 values after 2 and 14 min. contact and the pA10 values after the same two periods of contact.
A 14 min. period of contact with the antagonist (corresponding to five consecutive contractions in the presence of an antagonistic drug) has been arbitrarily chosen as representing approximately equilibrium conditions, since at that time there is usually not much further increase of depression. It would, of course, be preferable always to establish true equilibrium conditions, but it was found that in some instances the effect of the antagonist appeared to increase indefinitely; when this happens it becomes difficult to distinguish between the effect of the antagonistic drug and that of a spontaneous deterioration of the preparation, and true equilibrium conditions cannot be established.
A convenient method of summarizing the four pA values is shown below:
| Atropine—Acetylcholine | Pethidine—Acetylcholine | ||||||
|---|---|---|---|---|---|---|---|
| pA2 | pA10 | pA2–pA10 | pA2 | pA10 | pA2–pA10 | ||
| 2′ | 8.37 | 7.72 | 0.65 | 2′ | 5.79 | 4.69 | 1.10 |
| 14′ | 8.77 | 8.05 | 0.72 | 14′ | 5.89 | 4.71 | 1.18 |
| 14′–2′ | 0.40 | 0.33 | 14′–2′ | 0.10 | 0.02 | ||
The data are taken from three experiments in which pethidine was tested against acetylcholine and three further experiments in which atropine was the antagonist, each experiment being complete in the sense that all the four pA values were determined in the course of a single assay. When the data are tabulated in this manner the row differences provide a measure of the steepness of the concentration-action curve, and the column differences indicate changes of activity with time. Pethidine and atropine differ in both these respects. The row differences are of the order of 0.7 for atropine and of 1.1 for pethidine, indicating that in order to compensate for a fivefold rise of acetylcholine the concentration of atropine has to be raised fivefold and that of pethidine thirteen-fold. The difference is statistically significant. The differences in the columns show that after 14 min. contact the effect of atropine is over twice that after 2 min. contact, whilst the effect of pethidine increases hardly at all during this period.
The difference between pA2 and pA10 provides a quantitative test for the hypothesis that antagonists compete with drugs for receptors according to a simple mass action relation. It can be shown that the mass action equation as developed by Gaddum (1937) for a first order reaction requires a ninefold increase of antagonist corresponding to a fivefold increase of active drug between pA2 and pA10. Straight proportionality between drug and antagonist at low concentrations of the antagonist is presumptive evidence against the existence of a simple mass action relation.
The results of pA determinations are summarized in Table II. Each drug-antagonist pair is characterized by four pA values. The figures given are mean values, the total number of individual determinations and their standard deviation being indicated in the Table. Fig. 8 shows some of the differences between antagonists as revealed by the measurement of four pA values for each. Apart from differences in their general activity, antagonists also show characteristic differences in time-action and concentration-action relations. The lines joining the outer scales to the two inner scales represent increases of activity with time; these are greatest in the two most active antagonists. The lines joining the two inner scales indicate differences between pA2 and pA10 (at approximately equilibrium conditions). This difference is smallest with the pair atropine-acetylcholine, which provides the only instance of straight proportionality between concentration of drug and antagonist. In all other cases a tenfold or greater increase of antagonist concentration is required to balance a fivefold increase of drug concentration.
Table II.
Results of pA Determinations
The total number of individual determinations is given in parentheses and σ is the standard deviation
| Active drug | Antagonist | pA2 | PA10 | ||
|---|---|---|---|---|---|
| 2 min. | 14 min. | 2 min. | 14 min. | ||
| Acetylcholine | Atropine | 8.27 (11) σ = 0.11 | 8.61 (11) σ = 0.15 | 7.72 (3) σ = 0.07 | 8.05 (3) σ = 0.13 |
| Benadryl | 6.49 (3) σ = 0.07 | 6.57 (3) σ = 0.09 | 5.36 (2) σ = 0.06 | 5.4 (2) σ = 0.04 | |
| Pethidine | 5.79 (3) σ = 0.07 | 5.84 (4) σ = 0.14 | 4.7 (4) σ = 0.05 | 4.76 (5) σ = 0.15 | |
| Neoantergan | 4.71 (2) σ = 0.06 | 4.86 (2) σ = 0.09 | |||
| Histamine | Neoantergan | 8.71 (4) σ = 0.15 | 9.46 (5) σ = 0.22 | 7.99 (1) | 8.36 (1) |
| Benadryl | 7.75 (8) σ = 0.1 | 8.02 (9) σ = 0.28 | 6.74 (4) σ = 0.11 | 7.02 (4) σ = 0.31 | |
| Pethidine | 5.78 (19) σ = 014 | 6.13 (5) σ = 0.46 | 4.84 (5) σ = 0.17 | 5.0 (5) σ = 0.21 | |
| Atropine | 5.73 (3) σ = 0.22 | 5.64 (3) σ = 0.18 | 4.63 (3) σ = 0.24 | 4.6 (3) σ = 0.24 | |
Fig. 8.
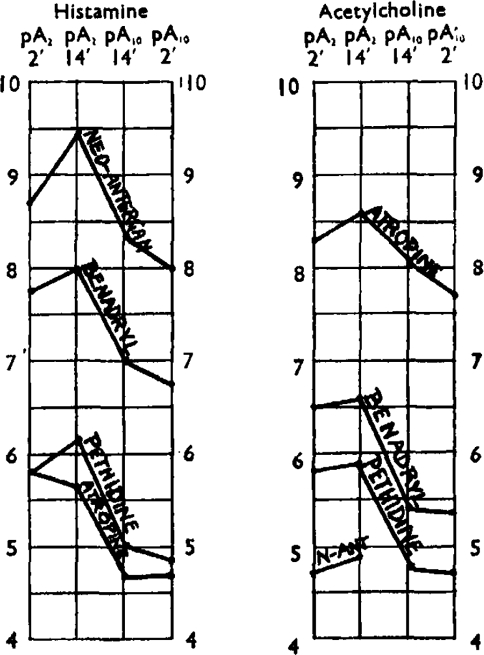
Each antagonist of histamine and acetylcholine is characterized by four pA values. Note qualitative differences between antagonists with regard to increase of action with time and pA2-pA10 difference.
One of the most interesting findings has been a complete lack of correlation in the behaviour of the same antagonist when tested against two different drugs. This applies both to time-action and concentration-action relations. Thus, the effect of neoantergan after the first 2 min. contact increases little further against acetylcholine, but continues to increase steeply against histamine. As for concentration-action curves, atropine has a steep concentration-action curve against acetylcholine and a relatively flat one against histamine. These results suggest that when the same antagonist antagonizes two different drugs the mechanisms involved may be quite different.
After-effects of antagonists.—The rate of recovery after the antagonist has been removed from the bath varies in much the same way as the rate of development of the effects, and here again the same antagonist may be persistent when assayed against histamine and non-persistent against acetylcholine and vice versa. Fig. 5 shows examples of slow (neoantergan) and quick (benadryl) recovery from antagonists on the same preparation.
A curious after-effect which occurred at times, especially with neoantergan, is shown in Fig. 9 (p. 205): the maximum depression of the effect of histamine did not take place in the presence of neoantergan, but shortly after it had been removed from the bath, as if the act of washing out the antagonist had further increased its effect.
Fig. 9.
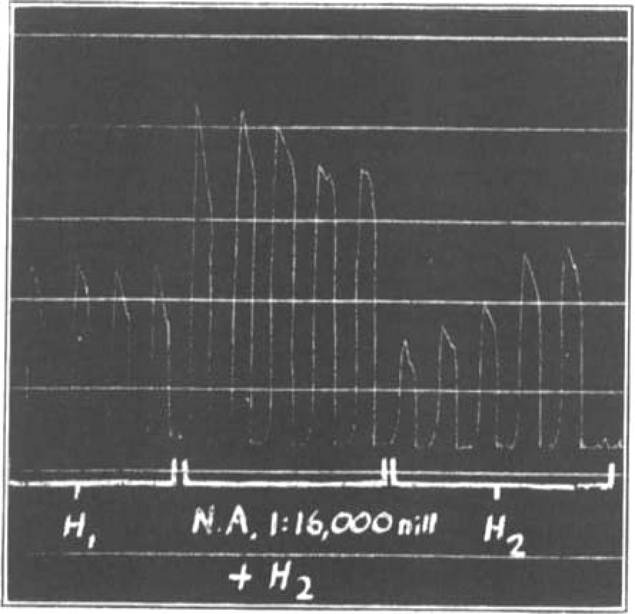
Neoantergan-histamine. After-effect of antagonist. Immediately after removal of the antagonistic drug from the bath there is a further increase of depression. H2 = double dose of histamine.
Variability of pA Determinations
Determinations of pA2 pethidine-histamine were made in 19 different experiments spread over a period of over one year. The results were distributed as shown in Fig. 10. The variations of pA indicate a 3.2-fold (or, omitting one result, 2.4-fold) variation in the sensitivity of the tissue. The shape of the distribution curve suggests sampling from a non-homogeneous population. In 10 of these experiments two or more pA2 determinations were made on the same gut and consequently variation between animals could be compared with variation in successive tests on the same animal by means of Fisher's Z test. The resulting Z value was highly significant, suggesting that there is true variation between guinea-pigs in their sensitivity to antagonists.
Fig. 10.
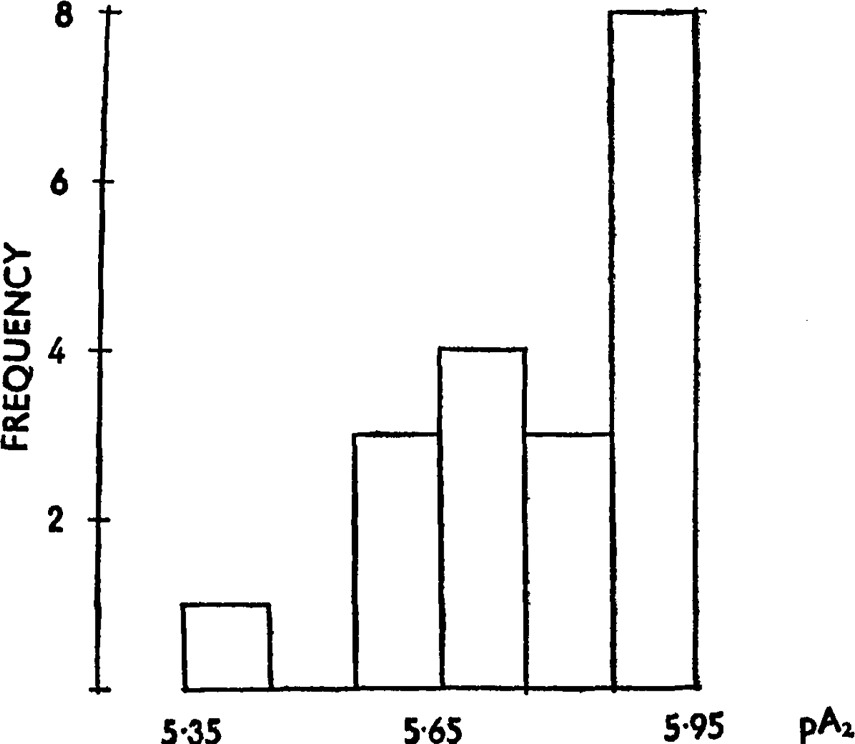
Frequency distribution of pA2 values for pethidine-histamine obtained after 2 min. contact between drug and antagonist; 19 experiments.
pA measurements are more variable after long periods of contact with the antagonist than after short periods. The following standard deviations summarize the variation encountered for the four different types of pA measurements:
| Standard deviation | Degrees of freedom | ||
|---|---|---|---|
| pA2 2 min. contact*… | … | 0.13 | 31 |
| pA10 2 min. contact… | … | 0.14 | 15 |
| pA2 14 min. contact | … | 0.25 | 34 |
| pA10 14 min. contact | … | 0.22 | 16 |
Omitting pethidine-histamine.
The standard deviation is nearly twice as great after 14 min. as after 2 min. This is somewhat surprising, since variation might be expected to become less as equilibrium conditions were approached. The increase in variability may be partly due to spontaneous changes in sensitivity of the preparation during the longer period of contact
The Use of Comparative Assays for Determining pA2
It has been shown that animals vary in their sensitivity towards individual antagonists and that this variation is greater when the period of contact of antagonist with tissue is long than when it is short. It seemed possible that some of this variability might be eliminated in a comparative assay in which one antagonist was pitted against another antagonist. Such an experiment, involving repeated injections of each antagonist, might possibly be carried out on a single piece of gut so long as excessive depression by the antagonists was prevented by keeping the periods of contact short and by giving numerous “recovery” injections of the stimulant drug, after washing out the antagonist.
Six experiments were performed in which the action of pethidine towards histamine was compared with that of atropine on a single preparation. The experimental plan of these assays was similar to one previously used by the author (Schild, 1942) for histamine assays. In the histamine assay only two concentrations of the standard and two of the unknown are used. These concentrations are given in a random order in successive “randomized groups” of four, and the results are eventually computed and analysed statistically on the assumption of a linear relation between log dose and effect. In the present experiments the place of four concentrations of histamine is taken by two concentrations of each antagonist administered 2 min. before the injection of a constant dose of histamine. In addition several injections of histamine alone are given following each administration of the antagonist until the sensitivity to histamine has been apparently restored. Fig. 11 shows parts of two such experiments. In both cases a “randomized group” of four doses of antagonist is represented, a complete experiment consisting of several (2–4) such “randomized groups.” In one of these experiments the antagonists produced little after-effect; in the other a prolonged depression necessitating many “recovery” injections. In all the experiments statistical analysis showed satisfactory parallelism between atropine and pethidine slopes. The results of these comparisons, which were done at various times and on different stocks, were remarkably constant. The following figures of the logarithm of the ratio pethidine/atropine were obtained: 0.33, 0.36, 0.37, 0.34, 0.3, 0.33.
Fig. 11.
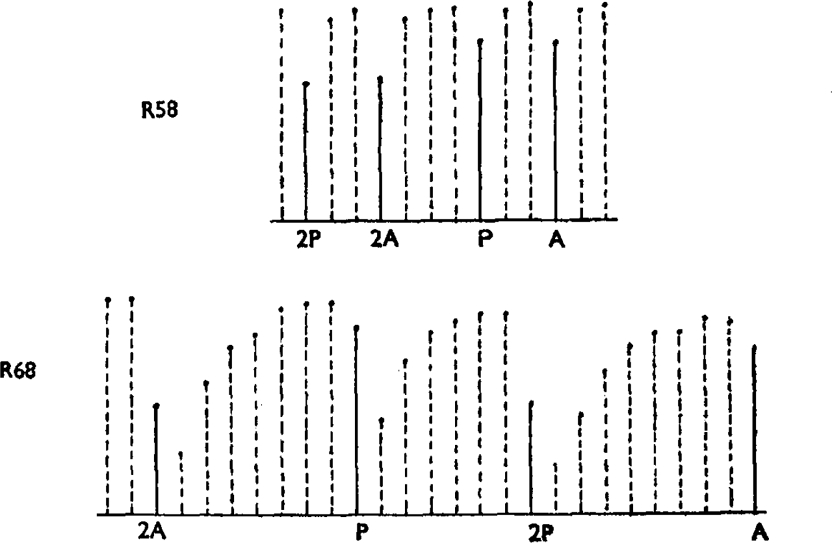
Comparisons of activity of pethidine and atropine towards histamine on a single piece of gut. Extracts from two such experiments. The solid lines represent effects of histamine in the presence of an antagonist which has previously been in contact with the tissue for 2 min., the dotted lines the effects of the same dose of histamine alone administered at 3 min. intervals until sensitivity is restored. As far as possible approximately equally depressant doses of pethidine and atropine were used, pethidine being more than twice as active as atropine. The final ratio of activity is calculated by assuming a common slope for the two antagonists and a linear relation between log concentration and effect.
pA2 atropine-histamine by direct and indirect method.—pA values may be determined directly without reference to another antagonist, or indirectly, by measuring in a comparative assay, such as the one outlined above, the activity of an unknown antagonist in relation to one whose pA is already established, and computing the unknown pA by adding to the known pA the logarithm of the ratio of molar activity of the two antagonists. Thus:
 |
This method would seem to be economical provided that the results agree with those of direct determinations; this, however, is not entirely the case. There is a slight discrepancy between direct and indirect pA determinations which suggests that, although in comparing the activity of antagonists on a single piece of gut a 2 min. period of contact was adhered to, the gut responded in fact as if the period of contact had been longer. Indeed, the results agree better with direct pA2 determinations done after 14 min. contact, as the following data show:
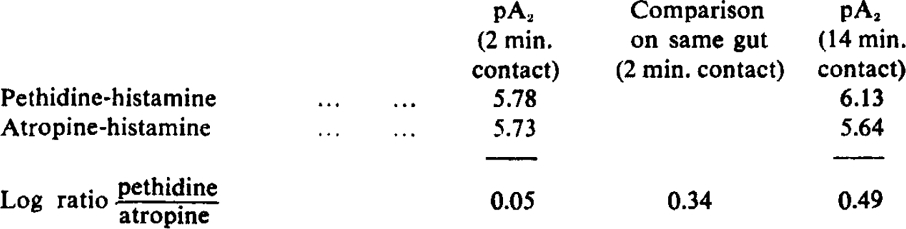 |
These results might be explained by assuming that in comparing antagonists on a single preparation they are never completely removed in spite of repeated washings.
In comparing two antagonists on the same gut the result may be vitiated by certain systematic errors unless care is taken that the effect of a previous dose has subsided at the time the next dose is added, especially when the two antagonists have different modes of action. The following example illustrates the point.
Antagonist (a) is to be compared with antagonist (b); their effects are additive but (a) has a persistent action and (b) a readily reversible action. When (a) is added to the bath some of its effect persists after it has been removed. If a depression is produced by (a) and matched at the next injection by a depression produced by (b) the real effect of the latter, acting as it does on a depressed preparation, is less than it appears. At the next injection the same concentration of (a) reproduces its old action, the effect of (b) having worn off.
Comparison of antagonists on separate pieces of the same gut.—In these experiments direct pA determinations on two different antagonists were done simultaneously using a separate piece of gut for each antagonist and each concentration, all the segments being taken from the same guinea-pig. Variability between guinea-pigs was thus eliminated.
An experiment of this kind comparing the action of neoantergan and benadryl towards histamine is illustrated in Fig. 5. The results of this and two further similar experiments are shown in Table III.
Table III.
pA2 Neoantergan-Histamine and Benadryl-Histamine Determined in the Same Experiment Using A Separate Piece of Ileum for Each Concentration of Antagonist
| pA2 values | pA2 neoantergan —pA2 benadryl | |||
|---|---|---|---|---|
| neoantergan | benadryl | |||
| R.205 | 2′ | 8.91 | 7.94 | 0.97 |
| 14′ | 9.76 | 8.35 | 1.41 | |
| 14′–2′ | 0.85 | 0.41 | ||
| R.206 | 2′ | 8.61 | 7.66 | 0.95 |
| 14′ | 9.60 | 7.78 | 1.82 | |
| 14′–2′ | 0.99 | 0.12 | ||
| R.207 | 2′ | 8.65 | 7.75 | 0.90 |
| 14′ | 9.36 | 8.26 | 1.10 | |
| 14′–2′ | 0.71 | 0.51 | ||
The following points may be noted:
The difference between pA2 values at 2 min. contact is remarkably constant, more constant than the absolute values. This confirms previous conclusions that the gut varies simultaneously in sensitivity towards different antagonists.
Increase of activity with time (pA2 14 min.–pA2 2 min.) varies, but it is in each case considerably greater with neoantergan than with benadryl.
At 14 min. pA2 values and their differences vary more than at 2 min. This confirms previous conclusions.
In conclusion it may be said that comparative measurements definitely eliminate a certain amount of variation. Comparisons on a single piece of gut are efficient in the sense of allowing many determinations to be made in a relatively short time, but they may be affected by systematic errors owing to persistence of antagonistic effects. Comparisons on separate pieces of gut are laborious but free from objections and give a more complete picture, since the time factor may be taken into account.
Discussion
Clark and Raventos (1937) proposed to use as a measure of activity of an antagonist the concentration which would neutralize the effect of a tenfold increase of active drug. One of the chief merits of this measure is that, being a null measure, and involving no change in response, it is independent of the method of experimentation used, and yields results on different preparations which are directly comparable.
pA is based on the same idea as the measure adopted by Clark and Raventos, but it is expressed in a rather more convenient form. It may be used to define the activity and specificity of an antagonist, its time-action relations and the trend of its concentration-action curve. pA values are additive; for instance, in order to express the total activity of a compound against both histamine and acetylcholine, the respective pA values may be added together.
The activity of an antagonistic drug may be expressed in one of two ways, by reference to another antagonist or by some measurement not involving a comparison with another drug. Since the activity of a drug cannot as a rule be expressed accurately in terms of another drug which is qualitatively different, the comparative method gives an incomplete and often misleading picture of the activity of an antagonist. Moreover, unless a definite common standard has been agreed upon, results from different laboratories are difficult to correlate. Comparisons may nevertheless be useful in practice owing to their greater economy of time and effort, especially when a series of related compounds is being investigated within the same laboratory. This question has been discussed in detail above.
The real test of the usefulness of a measure of drug antagonism is whether the results can be reproduced in another laboratory. Variations occurring within the same laboratory can be overcome by repeating the experiment and by random selection of experimental animals, but systematic variations between different laboratories present a more difficult problem. At present it is not known whether pA will be affected by such systematic variations or whether results in different laboratories will fall within the range of variations obtained with a highly mixed stock of animals in an individual laboratory. If important variations in sensitivity between laboratories should occur, one way of eliminating them would be to use in this type of work a homogeneous strain of guinea-pigs, available to all the laboratories concerned. Failing this, it might become necessary to fall back on the method of establishing differences of pA between antagonists rather than absolute pA values in the hope that the former would be less subject to laboratory variation than the latter. The use of an agreed measure of drug antagonism should, at least, make it easier to detect the occurrence and extent of such variations.
Summary
Clark and Raventos (1937) suggested a method of estimating antagonistic power in terms of “the concentration of antagonist which altered by a selected proportion (e.g., tenfold) the concentration of an active drug needed to produce a selected effect.” The negative logarithm of this (molar) concentration has been termed pAx, where x is the proportion selected. On the guinea-pig's ileum the value of pA appears to be independent of the degree of contraction produced by the active drug. Methods are described for determining the value of pA.
pA is a statistical constant. To obtain a representative value of pA for a given tissue, antagonist, and active drug, the mean of a random sample of determinations on different individual animals must be determined. pA values were found to vary by 0.4 to 0.5 of a unit when the period of contact of the muscle with the antagonist was short; at long periods of contact variability was increased. Variability may be reduced by comparing the activity of one antagonist with that of another. Methods are described for making such comparisons in an efficient way and possible objections to a comparative method are discussed.
The activity of neoantergan, benadryl, pethidine, and atropine in antagonizing histamine and acetylcholine has been determined in terms of pA on the guinea-pig's ileum. All these antagonists act against both histamine and acetylcholine, though at widely differing concentrations and in a qualitatively different way, as shown, for instance, by the time taken for equilibrium conditions to be reached. By characterizing each drug-antagonist pair by four pA values a more complete picture can be obtained of activity as influenced by duration of action and by concentration.
Acknowledgments
I am indebted to Dr. F. Bergel, of Roche Products, Ltd., for supplying Pethidine; to Dr. J. S. White, of Parke Davis & Co., for Benadryl; and to Dr. R. Wien, of May & Baker, for Neoantergan. The special armatures for converting P.O. relays into fluid switches were designed and made by Mr. B. F. Ballhatchet. The drawings are by Mr. A. Boura.
Footnotes
All the component parts of the automatic apparatus, including A.C. mains-operated electro-magnets compressing rubber tubing, and A.C.-operated 12-step selectors, are now made by Messrs, Londex, Ltd.
References
- Bovet D, Horclois R, Walthert F. C. r. Soc. Biol., Paris. 1944;138:99. [Google Scholar]
- Clark AJ, Raventos J. Quart. J. exp. Physiol. 1937;26:375. [Google Scholar]
- Gaddum JH. J. Physiol. 1937;89:7P. [Google Scholar]
- Loew ER, Kaiser ME, Moore V. J. Pharmacol. 1945;83:120. [Google Scholar]
- Schaumann O. Arch. exp. Path. Pharmak. 1940;196:109. [Google Scholar]
- Schild HO. J. Physiol. 1942;101:115. doi: 10.1113/jphysiol.1942.sp003970. [DOI] [PMC free article] [PubMed] [Google Scholar]
- Schild HO. J. Physiol. 1944;103:11P. [Google Scholar]
- Schild HO. Brit. J. Pharmacol. 1946;1:135. [Google Scholar]