

It is usually supposed that a drug combines with some part of a tissue as a necessary step in producing its action on that tissue. This view was expressed by Langley in 1878 while discussing experiments with pilocarpine and atropine. He later referred to “receptive substance” (Langley, 1905) and subsequently the term “receptor” has been widely used to express the same concept. Clark (1937a) attempted to put the concept on a quantitative basis by applying the adsorption isotherms of Langmuir which were derived from the application of the mass laws to the adsorption of gases on metal surfaces. The derivation of the equations as they apply to drugs in solution, and receptors or active patches in tissue, may be put as follows: Drug molecules combine with receptors at a rate which is proportional to the concentration of molecules in solution and to the number of free receptors. The resulting complex breaks down at a rate proportional only to the number of complexes. Thus the rate of combination is k1 A (l – y) and the rate of dissociation is k2y, where k1 and k2 are constants, A the concentration of drug, and y the proportion of receptors occupied by the drug. When the two rates are equal we have, putting K for 
| 1 |
When y = 0.5, then
 |
1a |
Equation 1 therefore relates the concentration of drug and the proportion of receptors which are occupied by drug molecules at equilibrium. Clark, however, went a step further than this and, by taking y as the response, used equation 1 to relate the response of the tissue to the concentration of drug. Thus there was in Clark's treatment the implicit assumption that the percentage of receptors occupied is equal to the percentage response of the tissue. When 50% of the receptors are occupied there is 50% of the possible response; when the response is maximal all the receptors are occupied.
Clark sought to show that the relation between concentration of drug and the effect produced did in fact agree with equation 1, and his apparent success was some justification for the assumption. The two situations he investigated were (a) the contraction of the isolated frog rectus abdominis produced by acetylcholine, and (b) the inhibition produced by acetylcholine of the contraction of strips of electrically stimulated frog ventricle. These tests have a common disadvantage in that both tissues contain enzymes which destroy acetylcholine, so that the concentration of drug in equilibrium with the receptors is less than that applied externally, and, though the applied concentration is known, that in the tissue is not. The receptors, indeed, may not all be in equilibrium with the same concentration of acetylcholine; a gradient is presumably established with a high concentration near the surface and a lower concentration at the centre of the tissue—because the further the acetylcholine penetrates the greater is its chance of being destroyed. Such a gradient would produce a log-concentration-effect curve flatter than the true curve. Furthermore, it cannot be assumed that the ratio of the applied concentration to the effective concentration (or concentrations) is constant for different applied concentrations. A block of cholinesterase activity would therefore be expected to alter the slope of log-concentration-effect curves; Webb (1950) has shown that this is so, and that the change of slope is considerable. Calculation from his graphs shows that, when the cholinesterase of isolated rabbit auricles is blocked with physostigmine, the slope of the acetylcholine log-concentration-effect curve is about 10 times steeper than on normal auricles (see Table I). An attempt has been made to determine the relation between log concentration and effect for acetylcholine and the frog rectus after blocking the cholinesterase with TEPP so that the size of the effect could be assessed in one of the systems used by Clark. This proved to be difficult, since the response of the rectus, always slow, became very much slower after TEPP, and the contractions continued to increase for an hour after acetylcholine was applied. The action of carbachol on normal recti was similarly slow. It was therefore impossible to get an accurate estimate of slope, but it was evident that the increase of effect with increased concentration was greater than required by equation 1. In any case it was clear that reliable evidence in support of any particular equation would be difficult to obtain from this tissue.
Table I.
Slopes of Concentration-Effect Curves
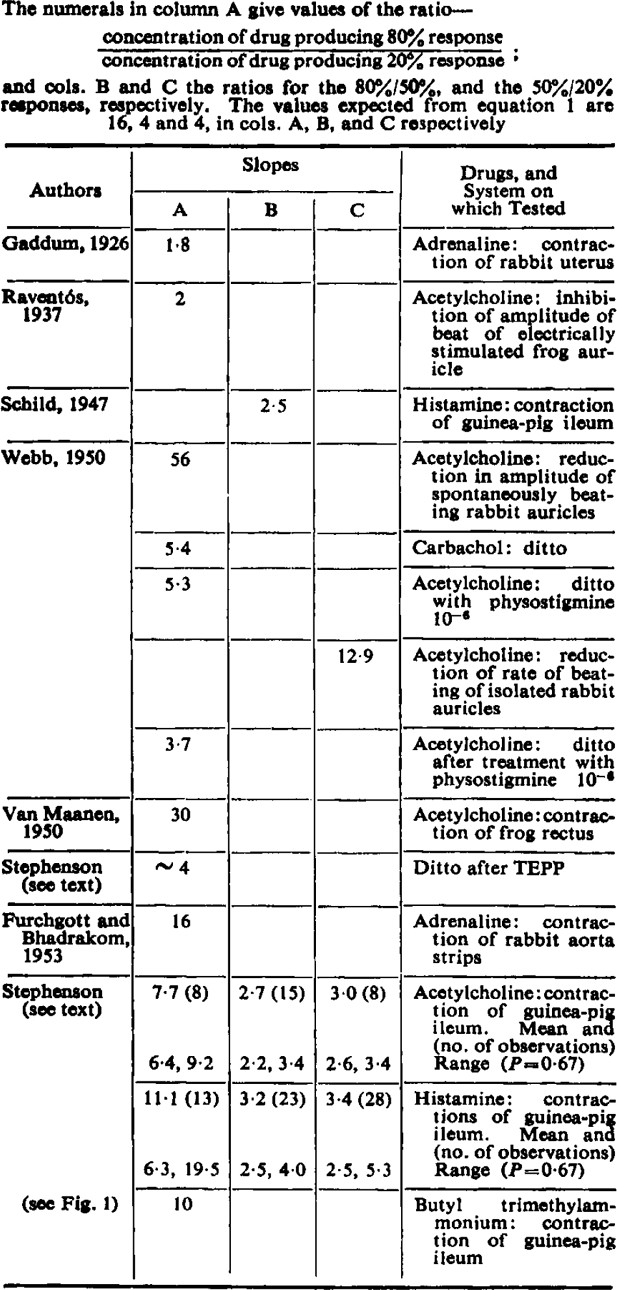 |
Clark discussed several other drug-tissue systems, but he was mainly concerned to show that a graded response was produced over a wide range of concentration and, in most of the examples he quoted, the slopes of the log concentration curves are not in accord with equation 1. A simple way of reducing data about concentration-effect curves to a single figure which is independent of any theory of drug action, and which can therefore be used to test any particular theory, is to use, as Clark did, the ratio of concentrations causing specified effects. Clark used the ratio for 84% and 16% of the maximum contraction; but a narrower range is easier to cover, and there is no need to restrict the ratio measured to any particular pair of responses. Evidence from which such ratios can be calculated is rare, because the maximum response is seldom recorded, but a few examples are shown in Table I. Some of these ratios represent new data for acetylcholine and histamine on guinea-pig ileum; details are given in the section on results. Furchgott and Bhadrakom commented on the theoretical implication of the slope, and considered that their results agreed with equation 1; the ratio given in Table I expresses this agreement. The other ratios in Table I have been calculated from published graphs: they are not in agreement with equation 1.
A variety of slopes can be accounted for by modifications of equation 1 obtained by postulating that a molecule of drug combines with either less or more than one receptor. The latter possibility may be true in some instances, but the postulate is unlikely to be generally correct—particularly where fractions are involved. Equation 1 appears to be the most likely relation between concentration of drug and the percentage of receptors occupied, but Table I shows that there is no experimental justification for supposing that it represents a general relation between concentrations of drug and the response of the tissue. It therefore becomes necessary to consider possibilities other than the one assumed by Clark for the relation between the proportion of receptors occupied and the response, and we can broaden the application of the receptor theory by the following hypotheses:
A maximum effect can be produced by an agonist when occupying only a small proportion of the receptors.
The response is not linearly proportional to the number of receptors occupied.
Different drugs may have varying capacities to initiate a response and consequently occupy different proportions of the receptors when producing equal responses. This property will be referred to as the efficacy of the drug.
The concept of efficacy, which may vary from zero to a large positive value, is at variance with Clark's (1937c) view of the action of a drug at a receptor as all or none; an agonist (Reuse, 1948) causes an effect and an antagonist causes no effect so that the activity of a drug of either kind is simply a measure of its affinity for the receptors. According to hypothesis 3, however, this remains true only for antagonists (which have zero efficacy): the activity of agonists is the product of their affinity and their efficacy. A drug with very low efficacy may produce a response which is less than the maximum, even when it is occupying nearly all the receptors—and because it is occupying the receptors, it diminishes the action of a drug with high efficacy added simultaneously. Compounds with such a low efficacy that they possess properties intermediate between agonists and antagonists will be called “partial agonists.” (See p. 384.)
Ariëns and Groot (1954) have also observed substances with these intermediate properties, and they ascribe this to a low “intrinsic activity.” Ariëns and Groot, however, continue to assume that all normal agonists have the same “intrinsic activity” and their concept is more limited in application than hypothesis 3.
The above hypotheses account for the progressive variation in properties in a series of alkyltrimethylammonium salts.
The lower homologues have acetylcholine-like activity whereas the higher members have an atropine-like blocking action (Raventós, 1937a and b; Clark and Raventós, 1937). It was expected that the members of such a simple homologous series would display some progressive change in their affinity for the receptors, and consequently, if Clark was correct, the reciprocals of the concentrations of the agonists causing a 50% response (see equation 1a) would form part of the same progression as the affinity constants of the antagonists. The demonstration of a sharp discontinuity between the two sets of constants, such that the agonists are effective in lower concentration than the antagonists, would, however, constitute good evidence for hypothesis 1. Raventós showed that the acetylcholine-like activity of the lower homologues varied rather irregularly, but calculation from his data suggested that the expected discontinuity between agonist and antagonist activity did occur. The nature of the evidence did not allow a firm conclusion. It was therefore decided to re-examine the compounds, with the intention of obtaining accurate values for the affinity constants of the first 4 or 5 antagonists, and to compare these with the reciprocals of the concentrations of the agonists which cause a 50% contraction.
Methods
A guinea-pig (usually weighing 150–200 g.) was killed by a blow on the head and bled. The terminal 3–4 cm. (avoiding the patch of lymph tissue) of the ileum was suspended in Tyrode solution maintained at 37.0 ± 0.1° C. It was attached to an isotonic frontal writing lever giving a magnification of 4 and a load of 0.5 g. The bath was connected to coils of glass tubing so that the fluid in the bath could be changed by upward displacement and overflow, either by Tyrode alone or by Tyrode containing drugs at predetermined concentrations. The volume of the bath was about 2.5 ml. and that of the coils 10 or 20 ml., so that sufficient solution could be run through the organ bath to effect a complete exchange (verified by using strongly coloured solution) without exposing the muscle to air and without cooling (less than 0.1° C). Events in the bath were controlled by an automatic apparatus similar to that described by Schild (1947). Contractions were produced either by agonist solutions replacing the Tyrode or by additions from a tuberculin syringe at a signal from the apparatus. In addition to the uniselector controlling the cycle of operations a second uniselector could be used to perform an assay; 4 different agonist solutions being used in varying order to produce the contractions: up to 48 contractions could be used in the assay (12 groups of 4 arranged in 3 Latin squares). A similar arrangement has been used by Boura, Mongar, and Schild (1954).
Results
Slopes of Acetylcholine and Histamine Concentration-Effect Curves
These experiments were performed primarily to investigate the action of antagonists, but concentration-effect curves were obtained before the antagonist was applied and these are relevant here. As soon as the ileum was put in the bath a small concentration of agonist (usually 2.5 or 5.0 ng./ml. acetylcholine or 5 or 10 ng./ml. histamine) was applied to the muscle for 10 or 15 sec. and then washed away. This was repeated at intervals of 1½ min. until the responses became steady: this usually took about an hour. About 4 concentrations of agonist differing by a factor of 2 were then tested: each concentration was used for 3 or 4 successive contractions before being replaced by another. At least two such groups of contractions were obtained for each concentration and the order in which the concentrations were tested was varied. The maximum contraction was obtained at the end of the experiment, after the antagonist being tested had been washed from the bath but sometimes at a time when the muscle was still to some extent under the influence of the antagonist. A large dose of agonist (about 100 times that giving a 50% response) was, however, used to obtain the maximum contraction, and there appeared no reason to suppose that the response was different from that which would have been produced before the antagonist was tested. The contractions were measured to the nearest 0.5 mm., plotted against log concentration, and a curve fitted by eye. The concentrations producing 20, 50 and 80% contractions were read from this curve. The results from 13 experiments with acetylcholine have been analysed. In only 8 of these were responses less than 20% of the maximum obtained, so that in five experiments the dose ratio could only be calculated for the 80%/50% response ratio. All the results have been included in Table I, since a biased sample could result if only the experiments giving a wide range of responses were presented. (Only four concentrations, covering a 16-fold range, were usually tested so that 20% and 80% responses could not both be obtained in a preparation in which the dose ratio for these responses was more than 16; and would often not be obtained if the ratio was only slightly less than 16.) The experiments with histamine were done on ileum suspended in Locke solution containing 10−7 atropine. The results of 38 experiments have been examined; only 13 included both 20% and 80% responses, 10 did not include the 80% and 15 did not include the 20% response. The slopes varied considerably, particularly those for histamine. The geometric means and the standard deviations were calculated from the logarithms of the ratios. These means and the values of the ratios corresponding to one standard deviation above and below the mean (being the values between which two-thirds of the observations would be expected to lie) are shown in Table I. None of the acetylcholine slopes and only a small proportion of those for histamine were as shallow as required by equation 1. The variations in slope are probably genuine and not due to error, and this in itself would show that equation 1 does not represent the dose-effect curve. If, however, the variation is interpreted as random error, five of the six mean estimates of slope are significantly different from the values expected from equation 1. For the 50%/20% ratio for histamine P lies between 0.2 and 0.1: for the 80% /50% ratio for histamine P < 0.05, and for the other ratios P < 0.001.
Alkyltrimethylammonium Salts (Alkyl-TMA)
The action of the first six members of the series, tetramethylammonium (methyl-TMA), ethyl-TMA, propyl-TMA, butyl-TMA, amyl-TMA and hexyl-TMA, appeared to be fairly straightforward, and a series of (2 and 2) dose assays were made to compare their potencies. Ileum was set up as already described and assays started when the responses became regular. To facilitate detection of any difference of slope a dose ratio of 4 was at first used. However, the contractions produced by the high concentrations were observed to depress the subsequent response to a small concentration, thereby increasing both the variation and the apparent slope. Deviation from parallelism was not seen except with propyl-TMA, which sometimes had a steeper slope than amyl-TMA, and most of the assays were done with a dose ratio of 2. The effect of the first 3 members was reduced by the addition of hexamethonium to the Tyrode; 50 mg./l. and 100 mg./l. were tested and the latter concentration adopted as a routine. This concentration of hexamethonium produced a small continuous activity which was prevented by mepyramine and was presumably due to histamine liberation. Mepyramine 10 μg./l. was therefore also added to the Tyrode in all subsequent experiments. Amyl-TMA, the most active of the series, was used as the standard in each assay. After preliminary tests, 33 assays on 12 pieces of ileum (each from a different guinea-pig) were performed. Each assay consisted of 10 or 12 groups of 4 contractions. The results are summarized in Table II. The assays performed in the presence of 100 mg./l. hexamethonium gave very uniform results except for those of propyl-TMA, where the standard deviation of the population of assays (n = 6) was about 15% of the mean. With butyl-TMA the standard deviation was only about 1.7% of the mean. An experimental error of at least this size is to be expected so that there can be little if any variation due to differences between guinea-pigs.
Table II.
Comparison of Activity of Alkyl Trimethylammonium Ions on Guinea-Pig Ileum
Assays of five compounds against amyl-TMA. Col. A gives results obtained in the absence of hexamethonium; cols. B and C those obtained in the presence of 50 mg./l. and 100 mg./l. hexamethonium respectively, together with mepyramine maleate 10 μg./l., except in the one assay marked † in col. C. The numerals in cols. A, B, and C are for individual assays except in two cases, where the mean and standard deviation, based on the number of assays shown in parentheses, are given. The numerals in the last column are calculated from the means of the results in the preceding column and the mean of the observed values for amyl-TMA. In all assays, except where otherwise indicated, the ratio of high doses to low doses was 2
| Drug | Activity as Percentage of Amyl-TMA | Concn. Producing 50% of Maximum Contraction (M × 106) | ||
|---|---|---|---|---|
| A | B | C | ||
| Methyl-TMA | *2·08 | 1·56, 1·54, 1·38 | 1·48, 1·30, 1·25 | 43·5 |
| Ethyl-TMA | *1·50 | 1·41, 1·25 | 1·17, 1·13, 1·07 | 52·0 |
| Propyl-TMA | *1·15, *1·12 | (6) 0·299 ± 0·08 | 195 | |
| Butyl-TMA | *49·0, *44·9, *42·0 | *45·0, 44·5 | (5) † 43·8 ± 0·34 | 1·33 |
| Amyl-TMA | 100 | 100 | 100 | 0·582± 0·092 |
| Hexyl-TMA | — | — | 22·7, 24·3 | 2·48 |
Assays done with dose ratio of 4.
Includes one assay done with dose ratio of 4.
The change in relative activity caused by hexamethonium indicates that a nicotine type of action contributes to the response obtained with methyl-, ethyl-, and propyl-TMA. The fourfold change in activity with propyl-TMA suggests that in the absence of hexamethonium the contraction of the ileum is largely due to nicotinic rather than muscarinic activity.
The concentration of agonist required to produce a 50% response varies both from one piece of ileum to another and with one piece at different times. If the ileum is handled with great care during preparation, is not picked up with forceps, not subjected to a pressure of more than 1 or 2 cm. of water when the lumen is washed out, and not stimulated with high concentrations of agonist in the early insensitive period, the variation is not wide. Even with great care there remains a residual variation, and values for concentrations producing 50% effect can only be statistical means. The responses to amyl-TMA for that assay during which each ileum showed its greatest sensitivity were calculated as a percentage of its maximum; the concentration for 50% effect was obtained by interpolation or a short extrapolation. The maximum contraction was only obtained for 7 of the 9 pieces of ileum on which assays were done in the presence of 100 mg./l. hexamethonium. For these 7 pieces of ileum the concentration of amyl-TMA required for a 50% contraction was 5.8 ± 0.9 × 10⁻⁷m (mean ± SE, n = 7). The corresponding concentration for each of the other compounds was calculated from the ratios in column 3 of Table II and the results are shown in column 4 of that table.
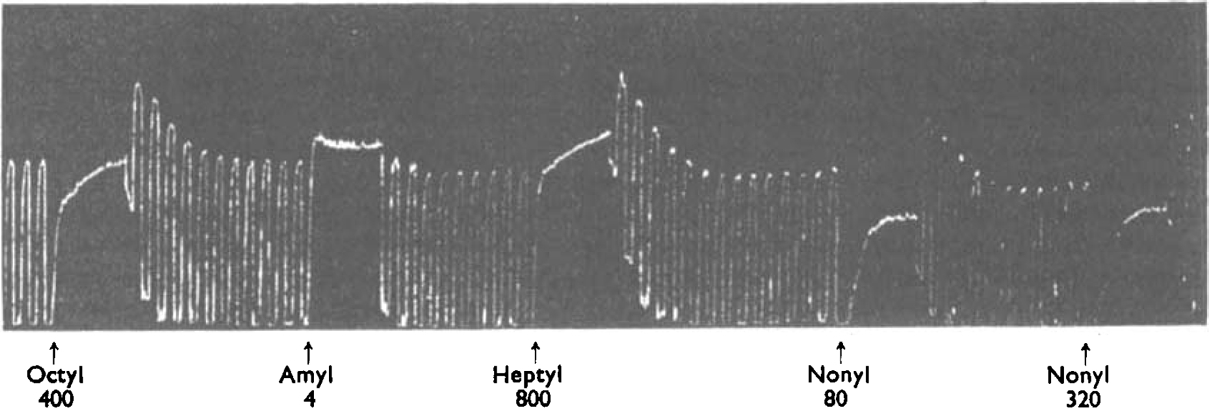
The transition from agonist to antagonist activity in the higher members of the series was not as simple as expected; some compounds showed intermediate effects. This should perhaps have been foreseen, since Raventós (1937) made passing reference to hexyl-TMA and octyl-TMA producing effects, on the frog heart and rat ileum respectively, which could not be increased by increasing the concentration. In the present experiments on guinea-pig ileum, heptyl-, octyl-, nonyl-, and decyl-TMA all produced contractions, but increasing the concentration failed to produce the maximum contraction. The largest contraction which could be obtained decreased as the length of the carbon chain increased, and decyl-TMA was only able to produce a contraction about 15% of the maximum produced by acetylcholine and by the alkyl TMA ions up to hexyl-TMA. The size of the largest contraction produced by any of these four partially active compounds varied from preparation to preparation and from time to time. This variation appeared to parallel the variation in sensitivity to normal agonists, the difference being, of course, that lowered sensitivity to a normally active compound did not reduce the size of the maximum contraction but only required an increased concentration to produce it.
In Fig. 1 the contractions have been expressed as a percentage of the maximum obtainable with a true agonist. All the observations were made on the same piece of ileum over a period of about 5 hours. During this time there were small changes in sensitivity, but the relative positions of the curves give a good idea of the differences between the substances. The highest two doses of decyl-TMA were sufficient to reduce the surface tension of water so that there was some frothing; this may be associated with the fact that these doses produced less effect than the smaller dose.
Fig. 1.
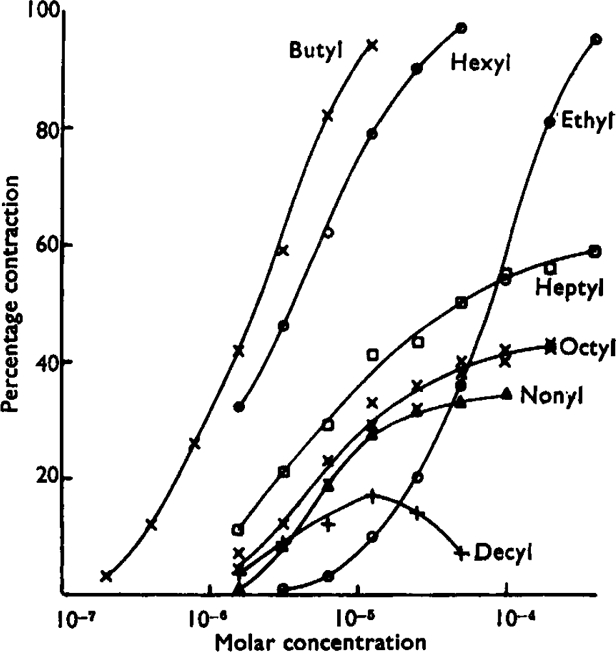
Concentration-effect curves for some alkyl-TMA ions on guinea-pig ileum. The contractions were produced by additions to the bath to give the final concentrations indicated; each concentration was left in contact with the ileum for about 15 sec. and then washed away. All the points for a given substance were obtained in consecutive contractions, starting with a low dose which was progressively doubled until the response range was covered. This was done twice with octyl-TMA and both sets of points are plotted.
The fact that these four compounds were neither true agonists nor true antagonists made impossible the comparison of potency of very closely related agonists and antagonists which had been envisaged. It was evident, however, that the actions of these compounds were consistent with, and therefore supported, the hypotheses under consideration. If different agonists have different efficacies then compounds with very small efficacies may be envisaged, and it is suggested that the observed actions of heptyl-, octyl-, nonyl-, and decyl-TMA are due to their having efficacies which are so low that, unlike the more familiar agonists, they must occupy a large proportion of the receptors in order to produce a contraction. Evidence in support of this explanation was obtained when one of the active members of the series was tested simultaneously with one of the partially active substances. Fig. 2 shows the effect of adding a dose of butyl-TMA which alone produced a near maximum contraction with a dose of octyl-TMA which alone produced a much smaller contraction. The two together produced Very little more effect than octyl-TMA alone, indicating that octyl-TMA was occupying the receptors to the exclusion of butyl-TMA. Even four times the concentration of butyl-TMA added with the octyl-TMA did not produce an effect as large as the single dose of butyl-TMA acting alone. The four substances heptyl- to decyl-TMA thus seem to possess a type of action which is a mixture of agonist and antagonist effects, and they will—as pointed out on p. 380—be referred to as partial agonists.
Fig. 2.
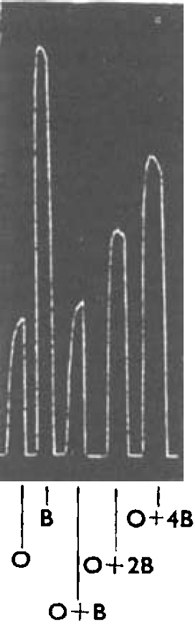
Guinea-pig ileum. Tyrone with hexamethonium iodide 100 mg./l. and mepyramine maleate 10 μg./l., at 37° C. Contractions produced by adding octyl-TMA and butyl-TMA to give the following concentrations in the bath. At O, 4 × 10⁻⁴m-octyl-TMA; at B, 1.6 × 10⁻⁵m-butyl-TMA; at O + B the same concentrations acting together; at O + 2B and O + 4B the same concentration of octyl-TMA together with 3.2 × 10⁻⁵m- and 6.4 × 10⁻⁵m-butyl-TMA respectively. Recording drum stopped simultaneously with wash-out.
More elaborate experiments of the type shown in Fig. 2 made it possible to estimate the proportion of the receptors which were occupied by given concentrations of partial agonists and hence to calculate their affinity constant.
To interpret these experiments the following theoretical relations of the response, R, the efficacy, e, and the proportion of receptors occupied, y, are advanced. Since R is not proportioned to y (hypothesis 2) it is useful to introduce the quantity S, which may be regarded as the stimulus given to the tissue, and which is defined as the product of e and y. We can write R = f(S) signifying that for any value of S the value of R is determined, but that we do not know how the two are related. We have by definition S = ey, therefore from the mass law, equation 1, we have
| 2 |
For an active agonist, where e is high and only a small proportion of the receptors are occupied, KA is small compared with 1 and equation 2 reduces to
| 2a |
The efficacy e can have any positive value; there will presumably be some practical limit, but no theoretical limit can be imposed. It is convenient to adopt the convention that S = 1 for a 50% response. When this is done a drug which occupies all the receptors to produce an effect which is only 50% of the true maximum has an efficacy e = 1, since S = ey.
Let A1, A2, and A3 be concentrations of an active agonist (with efficacy ea) and let P be the concentration of a partial agonist (efficacy ep) such that A1 produces the same contraction as P and that A2 produces the same contraction as P and A3 acting simultaneously. We have, for the two sizes of contraction, R1 = f(S1) and R = f(S2). If x is the proportion of receptors occupied by the partial agonist (which will be the same whether A3 is present or not since, according to hypothesis 1, an active agonist occupies a negligible proportion of the receptors to produce an effect) we have S1 = ea x and also, using equation 2a, S1 = ea Ka A1 so that
| 3 |
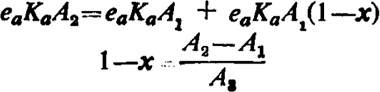
again S2 = eaKaA2 and, if values of S are assumed additive, S2 = epx+eaKaA3(1 – x) since the partial agonist occupies a significant proportion of the receptors. We therefore have
| 4 |
Combining equations 3 and 4
 |
5 |
Fig. 3 shows the first half of an experiment arranged to find values to insert in equation 5. Contractions of guinea-pig ileum were produced by four different solutions; 1, which contained 1.4 × 10⁻⁶m-butyl-TMA; 2, which contained 2.8 × −6m-butyl-TMA; 3, which contained 6.4 × 10⁻⁵ m-octyl-TMA; and 4, which contained both 6.4 × 10⁻⁵m-octyl-TMA and 5.0 × 10⁻⁶m-butyl-TMA. The concentrations of butyl-TMA were chosen so that the contractions produced by solution 1 were similar to those produced by 3, and those produced by 4 were similar to those produced by 2. Over small ranges the response to butyl-TMA (as with other agonists) may be regarded as linearly related to the logarithm of the concentration, and this relation was used to calculate from the measured responses that concentrations of 1.482 × 10⁻⁶m- and 2.462 × 10⁻⁶m-butyl-TMA would have produced contractions equal in height to those produced by solutions 3 and 4 respectively. Inserting these values in equation 5 indicates that for 6.4 × 10⁻⁵m-octyl-TMA the proportion of receptors occupied is 0.804 and equation 1 indicates that 1.56 × 10⁻⁵m would occupy 50% of the receptors or KOct = 6.4 × 10⁴.
Fig. 3.
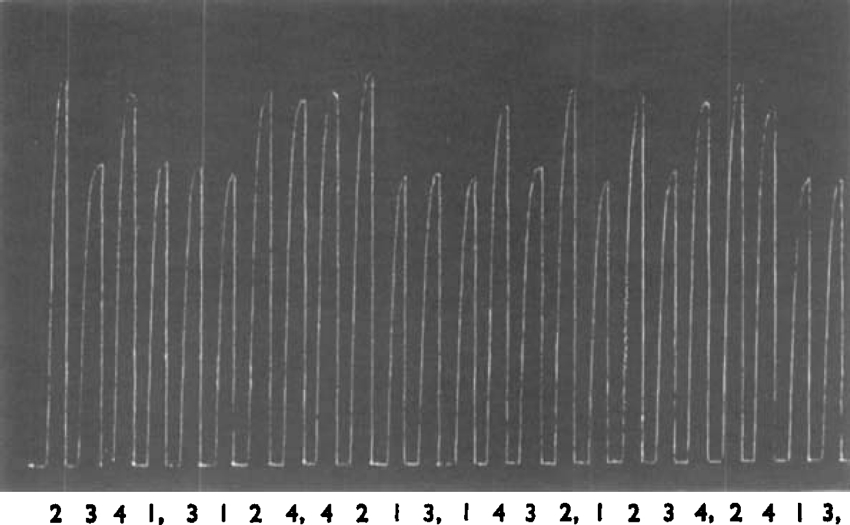
Guinea-pig ileum, conditions as in Fig. 2. Contractions produced by filling the bath for 15 sec. with solution containing: 1, 1.4 × 10⁻⁶m-butyl-TMA; 2, 2.8 × 10⁻⁶m-butyl-TMA: 3, 6.4 × 10⁻⁵m-octyl-TMA; 4, 6.4 × 10⁻⁵m-octyl-TMA + 5 × 10−60-butyl-TMA. The complete assay consisted of 48 contractions; the first 24 are shown.
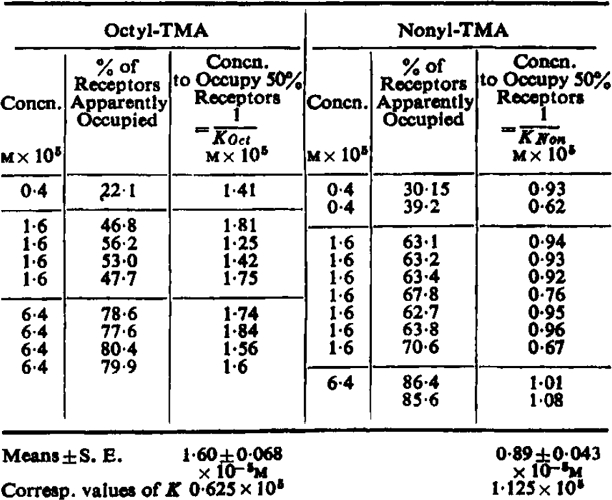
Experiments similar to that described above were done with different concentrations of heptyl-, octyl-, and nonyl-TMA. The range over which the concentration could reasonably be varied was not very wide. If the partial agonist occupied less than 20% of the receptors the experimental error became disproportionately great, while if much more than 80% were occupied the concentration A3 of butyl-TMA had to be large and the contractions persisted after washing and upset the assay. Within these limits the calculated values of x agreed well with the mass law relation (equation 1). This was clearest with octyl-TMA and nonyl-TMA, and the results of all the tests made with these substances are shown in Table III. These results suggest that equation 5 is valid.
Table III.
Results of Addition Experiments
 |
Most of the tests with heptyl-TMA were done while the procedure was being established and the results were more variable. Tests with low concentrations of heptyl-TMA gave slightly higher values for KHep than did tests with higher concentrations. Most of the tests were done with intermediate concentrations so that the total variation was not large. With most pieces of ileum the spontaneous activity became quite marked when only small contractions were induced, and only twice did it seem feasible to do assays of this type with decyl-TMA. These two experiments, however, gave the reasonably consistent values of 1.74 and 2.02 × 10⁻⁵ for KDec. The values for K for the four partial agonists (which are listed in Table V) increase steadily with the increase in chain length of the molecules. In Fig. 4 the mean values for K are plotted on a log scale together with the figures from Table II of the concentrations of the agonists which produce 50% of the maximum contraction. The straight line drawn through the affinity constants passes, when extrapolated, well below the points for 50% response for the agonists other than propyl-TMA. It would seem likely that the affinity constants for the true agonists also lie on or near this line. It is evident, however, that a straight line does not give an accurate estimate of the affinity constant of propyl-TMA, since the value indicated is little less than the reciprocal of the concentration which produced a 50% response; if the concentration at which 50% of the receptors are occupied is, in fact, only slightly greater than the concentration which produces 50% response, then the occupation of all the receptors would not produce a maximum response (see discussion). In fact this substance did produce the maximum contraction. The position is complicated by the possibility that part of the response of the ileum to propyl-TMA was due to a nicotine effect despite the presence of 100 mg./l. hexamethonium. With 500 mg./l. hexamethonium propyl-TMA still produced maximum contractions, but the slope of the log-concentration-effect curve was reduced: these were not good experiments, since the ileum did not behave well with this high concentration of hexamethonium. With the usual 100 mg./l. hexamethonium the nature of the contraction due to propyl-TMA was different from that of the other members of the series (and ACh); it reached its peak in a few seconds and then declined quite quickly—perhaps halfway to the base line in 15 sec. It was probably for this reason that propyl-TMA did not give additive effects with butyl-TMA. This lack of addition was at first misinterpreted as showing that quite small concentrations of propyl-TMA occupied an appreciable proportion of the receptors. With higher concentrations of propyl-TMA, however, the percentage of receptors apparently occupied did not increase in accordance with equation 1, and it became clear that the value of K for propyl-TMA was certainly less than that indicated by the straight line of Fig. 4.
Table V.
The Efficacy and Affinity of Alkyl-TMA Ions
The affinity constants of heptyl-, octyl-, nonyl-, and decyl-TMA are the mean experimental values; the others are read from the curved line in Fig. 4. The values of efficacy are related to the mean sensitivity of the pieces of ileum used to compare the activity of the first 6 members of the series
| Alkyl Group | Me | Et | Pr | Bu | Am | Hex | Hep | Oct | Non | Dec |
|---|---|---|---|---|---|---|---|---|---|---|
| Efficacy | 94 | 31 | 4·3 | 200 | 200 | 21 | 2·2 | 1·4 | 1·0 | 0·6 |
| Affinity × 10−3 | 0·24 | 0·63 | 1·6 | 3·8 | 8·5 | 19·0 | 41 | 63 | 110 | 190 |
Fig. 4.
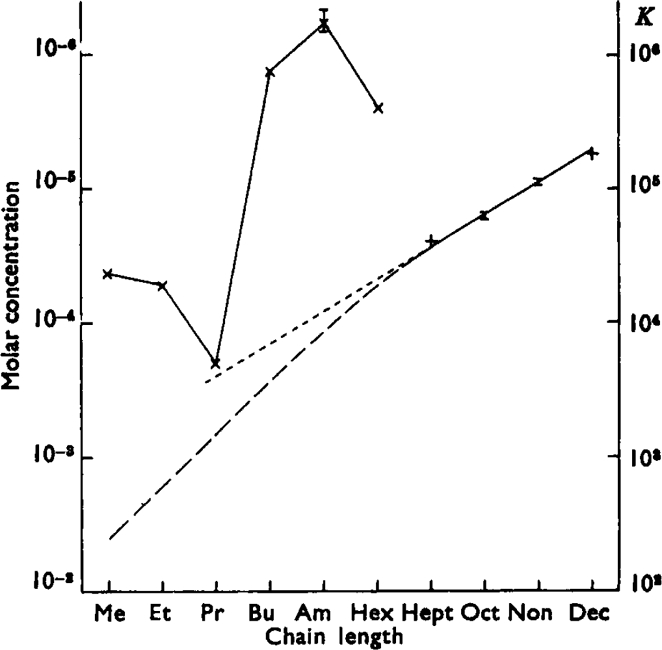
Relation between chain length and activity in the alkyl trimethylammonium series. The points plotted X–X for the first 6 members of the series are the concentrations which produce 50% of the maximum contraction (data from Table II). The points for the next 4 members are the estimates of the concentrations which occupy 50% of the receptors. Standard errors are shown in two instances. The ordinate on the left is concentration (log scale) and that on the right is the reciprocal concentration. On the right the points plotted for the partial agonists become affinity constants. If Clark's assumption is correct the points plotted for the agonists also represent affinity constants. The extrapolations are discussed in the text.
If the affinity constants of the short chain compounds increase in the regular way shown by the partial agonists, the surprisingly low muscarinic activity of propyl-TMA (Table II) must be due to a relatively low efficacy. This was confirmed in pieces of ileum in which the sensitivity became low in experiments prolonged for 2 or 3 days. It was observed that propyl-TMA lost its ability to produce the normal maximum contraction though this was still readily obtained with both ethyl- and butyl-TMA. Hexyl-TMA was also unable to produce maximum contractions in these tests. It is possible to estimate relative efficacies from the height of maximal contractions where these are less than the true maximum (see discussion), and it appeared that the efficacy of hexyl-TMA was 4–5 times that of propyl-TMA. The curved line in Fig. 4 extending from the estimated affinity constants of the partial agonist has been drawn so that the affinity constant indicated for propyl-TMA corresponds to an appropriate value for efficacy. It will be assumed that the affinity constants of all the compounds lie on this line.
The gap between this line and the points for 50% response supports the hypothesis that active compounds of this series, and by inference other similar substances, including acetylcholine, produce their effects when only a small fraction of the receptors are occupied.
An interesting effect was observed when the partial agonists acted on the ileum in the presence of atropine. The dose had, of course, to be increased to produce a contraction, but when sufficient was applied the contraction was much slower than usual and the partial agonist had to be left in the bath for about 100 sec. to allow the contraction to develop fully. This compares with the 5 or 10 sec. which is usual for the partial agonists in the absence of atropine and for normal agonists whether atropine is present or not. When such a slowly developing contraction was elicited during an interruption in a series of acetylcholine contractions, a sensitization of the ileum was observed when the acetylcholine contractions were resumed. The size of the contractions then declined again at a rate very similar to that of the decline when atropine was first applied. This similarity is evident in the experiment shown in Fig. 5, where the atropine produced a 10-fold reduction in sensitivity to acetylcholine. These effects were only seen with the partial agonists; when amyl-TMA was allowed to act for a similar period no sensitization occurred. However, when amyl-TMA was used instead of acetylcholine to produce the series of control contractions, octyl-TMA caused the usual increase in sensitivity, so that the effect is clearly not due to inhibition of cholinesterase activity.
Fig. 5.
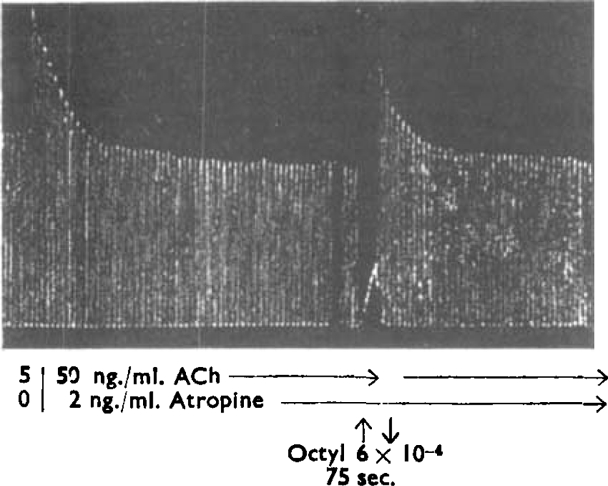
Guinea-pig ileum, conditions as in Fig. 2. Regular contractions produced by acetylcholine acting for 15 sec. at 1 min. intervals. The first 6 contractions were produced by ACh 5 ng./ml. After the 6th contraction the ACh was washed from the bath with Tyrode containing atropine 2 ng./ml. (in addition to hexamethonium and mepyramine) and this concentration was then maintained continuously: subsequent contractions were produced by ACh 50 ng./ml. At the vertical arrow octyl-TMA was added to give a concentration of 6 × 10⁻⁶m and left in the bath for 75 sec.: ACh was then applied 45 sec. later and at 1 min. intervals.
These experiments provide strong support for hypotheses 1 and 3. When atropine occupies some, or even most, of the receptors, plenty of others remain; if the concentration of agonist is increased to counter the reduction in the number of receptors available to the agonist, a contraction will occur without the agonist displacing the antagonist. The partial agonists, however, have such a low efficacy that a significant proportion of the receptors must be occupied if a contraction is to be produced; this can only occur when atropine vacates the receptors and the contraction is consequently slow. When the contraction is established most of the receptors will have been freed from atropine, so that when the partial agonist is removed acetylcholine produces nearly its usual effect until the atropine re-establishes itself.
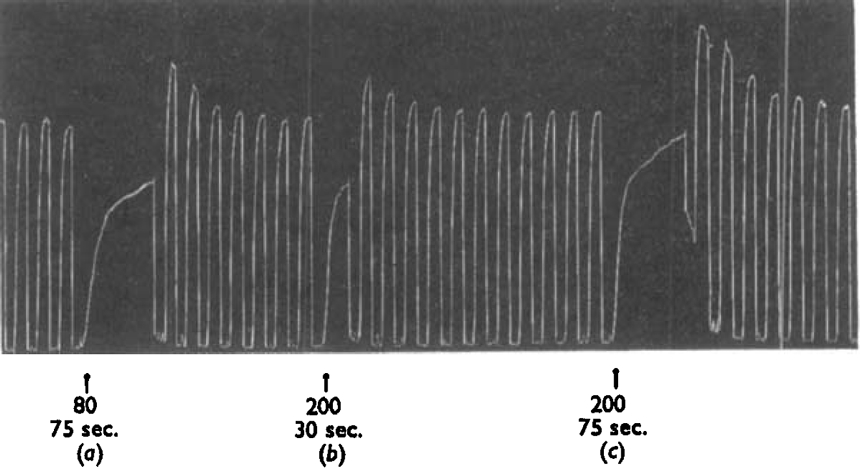
In the experiment shown in Figs. 6 and 7 the presence of atropine only reduced the sensitivity of the ileum to about a quarter, so that the atropine was occupying about 75% of the receptors; the free 25% allowed the partial agonists to produce a rapid initial contraction which then increased slowly as the atropine left the remaining receptors. When octyl-TMA was left in the bath only a little longer than was needed for the rapid phase of the contraction to occur, there was little sensitization; but when the same, or even a smaller, concentration was left in longer the sensitization was more marked (Fig. 6). The size of the rapid part of the contraction due to the 25% free receptors depended, as would be expected, on the efficacy of the partial agonist; it was smaller with octyl-TMA than with heptyl-TMA; with nonyl-TMA it was smaller still (Fig. 7).
Fig. 6.
Guinea-pig ileum, conditions as in Fig. 2. Atropine sulphate 1 ng./ml. present throughout; regular contractions produced by ACh 20 ng./ml. Octyl-TMA was added at the arrows to give the concentrations shown × 10−5m, and left in the bath for the time stated.
Fig. 7.
Same experiment as in Fig. 6. Atropine present throughout. Alkyl-TMA salts were added at the arrows to give concentrations shown × 10−6m. These concentrations acted for 105 sec.
The partial agonists with a longer chain did not show the de-atropinization effect so clearly: when used in the concentrations necessary to displace atropine they persisted in the tissue after washing and continued to occupy receptors. The sensitization then appeared as the partial agonist diffused out, and disappeared as the atropine re-established itself. This effect is just apparent with the higher concentration of nonyl-TMA in Fig. 7.
Discussion
So far as the main purpose of this paper is concerned, the evidence about concentration-effect relations is only of secondary interest, and will not be discussed further, except to repeat that there is little experimental justification for the idea that the equation 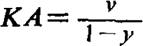 expresses a general relation between drug concentration and tissue response; and that consequently it is unnecessary to assume that the percentage of receptors occupied is equal to the percentage response. The view that such a relation does hold has never been explicitly propounded, but was implied in Clark's discussion of the mode of action of drugs. When clearly stated, the improbability of this relation becomes apparent; but, since the action of drugs is usually discussed within the framework of Clark's ideas, its widespread acceptance must be assumed. A clear statement of this view occurs in the paper by Raventós (1937b) in which, while discussing the fact that acetylcholine and methyl-TMA have additive inhibitory actions on the frog heart, he says: “If the two drugs occupy a common receptor then the full additive effect must mean that the gross difference in their activity is due to a difference in the ease with which they combine with the tissue. If the difference depended on the amount of drug required to be combined with the tissue in order to produce an effect, then the presence of the weaker drug would tend to antagonize the action of the stronger drug, since the weaker drug would reduce the number of free receptors available for the stronger drug without itself producing much action. … A number of the quaternary ammonium salts … were tested … and an additive effect was found in all such cases between these salts and acetylcholine.” The difficulty of allowing different efficacies at once disappears if it is assumed that the effects are produced when only a very small proportion of the receptors are occupied. Only with compounds of very low efficacy would an appreciable proportion of the receptors be occupied and the effect postulated by Raventós appear. It would seem that this does in fact occur with four of the alkyl-TMA salts when tested on guinea-pig ileum.
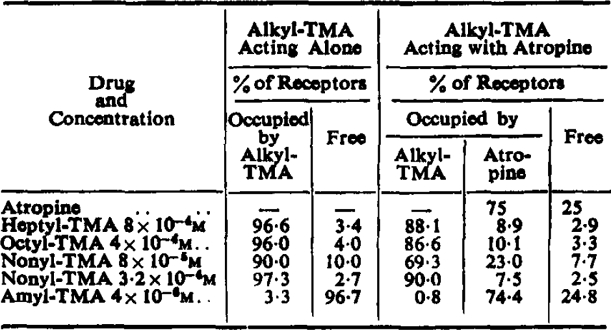
The surprising observation that the partial agonists oppose the action of atropine, as well as the action of true agonists, strongly supports the idea that the partial agonists, unlike normal agonists, occupy most of the receptors when producing a contraction. In the experiment shown in Fig. 7 atropine reduced the sensitivity to acetylcholine to about one quarter, and was therefore occupying about 75% of the receptors; the percentage occupied by the alkyl-TMA salts has been calculated from equation 1 using the affinity constants shown in Table V (see below). The results, shown in Table IV, are clearly of the right order to explain the de-atropinization seen in Fig. 7 and illustrate the difference between amyl-TMA and the partial agonists.
Table IV.
Calculated Percentage of Receptors Occupied by the Compounds Tested in the Experiment Shown in Fig. 7
 |
This displacement of atropine by the partial agonists would appear to be the effect that Clark (1937b) could not find with acetylcholine and atropine; he regarded the absence of this effect as evidence against the idea of competitive antagonism. If there is a large excess of receptors then acetylcholine can produce its effect—even though most of the receptors are occupied by atropine—without actually displacing the antagonist from the receptors. Since fewer receptors are available the concentration of acetylcholine has to be increased in order that the same number shall be occupied. Only with very high concentrations of atropine would the production of an effect by acetylcholine require the displacement of atropine—and then only from a very small fraction of the total number of receptors.
The idea that the activity of acetylcholine-like drugs is due to two separate properties—affinity for the receptors, and efficacy—thus seems to explain most of the observed facts; and, assuming its correctness, it becomes interesting to attempt to separate the contributions of the two factors to the total effect. No attempt has been made to obtain a theoretical relation between the stimulus S and the response R, but the empirical relation can be obtained experimentally since S, like y, is proportional to the concentration when y is small (equation 2a). In Fig. 8 values of S have been plotted against the responses to butyl-TMA from the experiment shown in Fig. 1. From equation 2, and Fig. 8, a set of log-concentration-effect curves for a series of hypothetical compounds with the same affinity, K = 103, but with efficacies varying from 1,000 to 0.5 have been calculated, and are plotted in Fig. 9, which shows how the maximal effects produced by partial agonists vary with their efficacy. The ratio of the efficacies of two partial agonists is the same as the ratio of the two concentrations of a true agonist which give contractions equal to the two partial agonist maxima. In systems where the log-concentration-effect curves for true agonists have low slopes, compounds with a wider range of efficacies will come into the class of partial agonists. In these respects “efficacy” differs from “intrinsic activity” which, as defined by Ariëns and Groot, is directly proportional to the size of the maximal response. It is evident that the shape of the curves in Fig. 9 varies little when e is greater than 10, and the curve shown for e = 100 is practically identical in slope and position with the curve which would result for K = 2 × 10² and e = 5 × 10², or for any other pair of values such that Ke = 105. Only in special circumstances, therefore, can the separate contributions of K and e be determined.
Fig. 8.
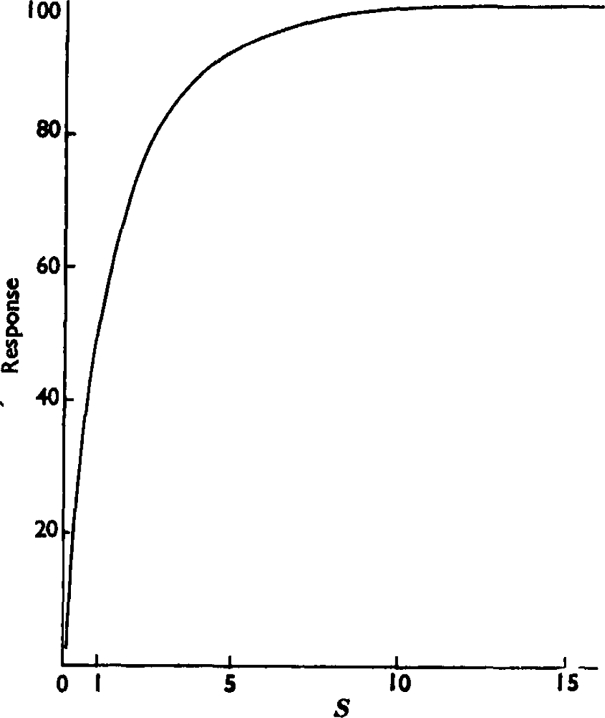
Curve relating the response R to the stimulus S (= ey) based on the log-concentration-effect curve of butyl-TMA in Fig. 1. Here the effect is plotted against concentration, but the concentration scale is replaced by the arbitrary scale of S. That is, it is assumed that y—the percentage of receptors occupied by butyl-TMA—is small so that y and consequently S are both proportional to concentration.
Fig. 9.
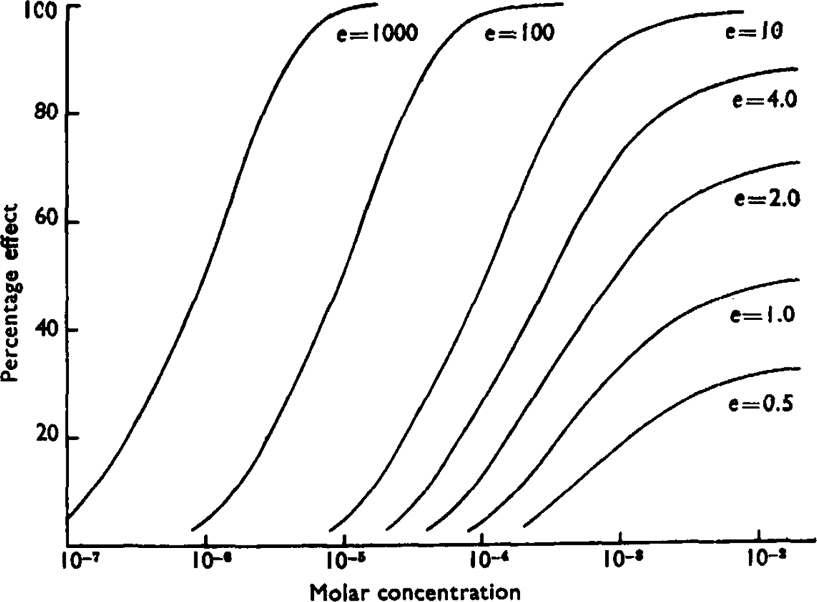
Set of log-concentration-effect curves for hypothetical substances. All have the same affinity constant, k = 102, and the efficacy varies as shown from 1,000 to 0.5.
The extrapolation in Fig. 4 is such a special circumstance, and it provides the basis for estimates of K and e which, though possibly not very accurate, are of considerable interest. The values for the efficacies of the agonists have been calculated from equation 2 using the values of K read from the curved line in Fig. 4 and the concentrations for a 50% response from Table II (so that S = 1). The efficacies of the partial agonists were obtained by applying equation 3 to the comparisons with butyl-TMA given by the addition experiments. Each experiment gave a value for the appropriate e. The affinity constants and the efficacies of the compounds in the series are listed in Table V.
Once it is accepted that the affinity of the alkyl-TMA ions for acetylcholine receptors varies in a regular way with chain length, it follows that the sharp peak of activity at amyl-TMA is due to high efficacy; this is apparent in Table V. The estimate of the efficacy of methyl-TMA is very dependent on the accuracy of the extrapolation in Fig. 4 and is consequently liable to error: the value obtained is comparable with that for amyl-TMA, and this suggests that most of the difference in the activity of these ions is due to the difference in affinity. The long-chain members of the series have a high affinity and a low efficacy.
These estimates of the affinity constants and of the efficacies of the alkyl TMA salts enable the concentration-effect curves to be reconstructed for comparison with the experimental curves shown in Fig. 1. Since the positions of the curves, and the size of the response to the partial agonists, depend on the sensitivity of the individual piece of ileum, it is necessary to adjust the values of efficacy to the individual case. The ileum on which Fig. 1 is based required 2 × 10⁻⁵m-butyl-TMA for a 50% response, compared with the mean value of 1.33 × 10⁻⁶m in Table II; the values of efficacy appropriate to Fig. 1 are consequently one-third less than those in Table V. From these adjusted efficacies, and the affinity constants in Table V, the curves shown in Fig. 10 have been calculated, using equation 2 to give S, and Fig. 8 to give R. Fig. 10 is a fairly good reproduction of Fig. 1, indicating that the various assumptions which have been made are not grossly at variance with the experimental evidence.
Fig. 10.
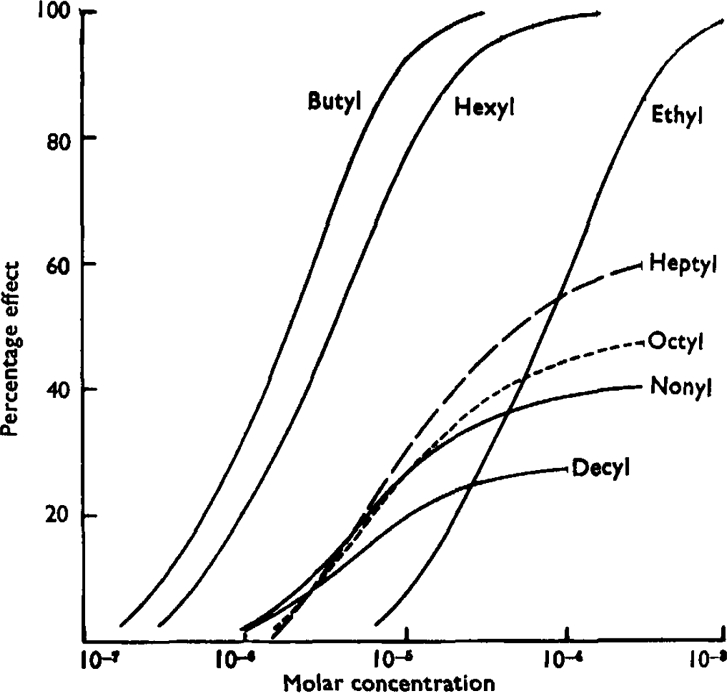
Log-concentration-effect curves for the alkyl TMA ions reconstructed from the constants in Table V, using equation 4 and the curve relating R and S shown in Fig. 8. The curve in Fig. 8 is the only link between these curves and the experiment on which Fig. 1 is based. Compare Fig. 10 with Fig. 1.
Action of Antagonists
It is interesting that some antagonists are effective in appreciably lower concentrations than the corresponding agonists (e.g., atropine and acetylcholine; mepyramine and histamine). It follows that such antagonists have higher affinities than the agonists. This difference becomes more marked if we now accept that the agonists cause appreciable responses when very few receptors are involved; and it may be that the incompatibility of high affinity and high efficacy is general, and is not particular to the alkyl-TMA ions.
If the new ideas expressed in this paper—particularly hypothesis 1—are accepted some modification of ideas about drug antagonism will be involved. It is usual to postulate two types of antagonism—competitive and non-competitive—the former being more usual. In competitive antagonism, agonist and antagonist, simultaneously present in solution, are each considered to compete for receptors to the exclusion of the other; and the response is determined by the concentrations of the two drugs and their relative affinity constants. Gaddum's equation (1937) relating these factors is derived from a consideration of the mass laws; its relevance is not affected by hypothesis 1, provided it is realized that the equation gives information about receptors and not about responses. Perhaps the most important point about the type of antagonism usually called competitive is that it is possible to obtain maximum responses with sufficient agonist, and that the slope of the log-concentration-effect curve is not changed in the presence of the antagonist. If, however, considerably more receptors exist than are needed to produce a maximum response, similar results will be possible with antagonists which block receptors irreversibly, or block at some site beyond the receptor but before the number of receptor paths has been appreciably reduced. Such antagonism would obey Gaddum's equation until sufficient paths were blocked to reduce the number of functioning receptors almost to the minimum required for the agonist to produce a maximum response.
There is evidence that the haloalkylamine type of compound blocks several kinds of receptors irreversibly—that is, the response is not restored when the antagonist is removed from the environment (Nickerson, 1949a; Furchgott, 1954), but the blocking action has nevertheless been supposed to be competitive at first, and to become noncompetitive only after more prolonged action. This has been discussed by Nickerson (1949b). The implication of a change in mode of action is avoided by the concept of spare receptors. As long as sufficient receptors remain free the antagonism is “surmountable”: it is only necessary to increase the concentration of agonist in the inverse proportion to which the available receptors have been reduced. When, however, the number of receptors is irreversibly reduced below the minimum required, maximum responses become impossible; eventually all the receptors are blocked and no contraction can be obtained: the antagonism is “unsurmountable.” The two phases of the action are thus seen as stages in a single continuous process in which an increasing proportion of receptors are irreversibly blocked.
This issue is confused because most experiments have involved injecting doses into animals; in such circumstances it is not always clear how long the drug remains in circulation and reversible competition remains possible. This difficulty is avoided in experiments with isolated tissue. Experiments (which will be reported in a subsequent paper) with SY-28 and histamine on guinea-pig ileum show that considerable irreversible block can be associated with a normal slope for the log-concentration-effect curve and a normal maximum contraction. Similar results have been obtained by Nickerson (unpublished). These experiments agree with the above interpretation. It is probable that the haloalkylamine antagonists act directly on the specific receptors (Furchgott, 1954); but it is a considerable modification of the established concept to describe such block, which persists after the disappearance of the antagonist, as competitive antagonism. If hypothesis 1 is correct it is also possible to envisage block occurring away from the receptors producing similar antagonistic effects. Such block whether reversible or not might appear to follow Gaddum's equation over a limited range, but would clearly not be competitive. The equation is strictly applicable only in equilibrium conditions. Equilibrium between receptors and an irreversible drug is only achieved when all the receptors are blocked: it is only the rate at which this condition is approached that is determined by the concentration of drug. Gaddum's equation, and some other expressions of the mass law, have nevertheless been applied in such situations by allowing an arbitrary time of action; sometimes doses injected into animals have been used in place of concentrations in the equation. Used in such ways the equation can carry little theoretical implication and, even when applied to an appropriate experiment, cannot prove that a pharmacological antagonism is competitive. It is consequently preferable to use the purely descriptive terms “surmountable” and “unsurmountable” (Gaddum, Hameed, Hathaway, and Stephens, 1955) to distinguish between the two commonly observed situations. Whether an effect is competitive or not will probably have to be decided on quite different evidence.
Antagonism which is surmountable but irreversible is difficult to explain without accepting hypothesis 1.
Structure-Action Relations
In considering the structural features of a molecule which determine its potency for some specific action, authors, working within the framework of Clark's ideas, have usually considered that these features exert their effects only by modifying the affinity of the molecule for the appropriate receptors. Only occasionally has some suggestion carried an implication of the concept of what has here been termed efficacy. The clear recognition of two separate entities “affinity” and “efficacy,” both of which might be altered by any one structural change, should clarify the consideration of many structure-action problems. One example may be mentioned. Holton and Ing (1949) showed a progressive and sharp decline of specific activity as the methyl groups on the nitrogen atom of acetylcholine were successively replaced by ethyl groups. The authors discuss this decline solely in terms of the structural requirements for fitting the acetylcholine receptor. In the closely analogous compounds prepared by Ford Moore and Ing (1945) which block the actions of acetylcholine (the efficacy is reduced to zero by a benzilyl group at the other end of the molecule), the effect of progressively replacing the methyl groups on the nitrogen atom by ethyl groups is not nearly so drastic. The first ethyl group indeed increases the blocking activity and the second and third reduce activity only slightly. Since the activity of blocking compounds must be considered solely in terms of affinity for the receptors, it would seem safe to assume that the trimethylammonium group confers high efficacy rather than high affinity on acetylcholine.
Throughout this paper, receptors have been discussed very nearly as if they existed in isolation. This has been deliberate. What a drug combines with to produce its effect is a subject for speculation. It is attractive to think of a part of some enzyme system at which a stimulant drug becomes a prosthetic group. This must have occurred to most people with interests in this field and has been expressed at least once (Welsh, 1948).
The approach to study of the action of drugs used in this paper is not universally popular among pharmacologists; some, indeed, despise discussion in terms of receptors, so that it is perhaps worth while to try to state my position clearly. The only basic assumption involved when discussing drug action in terms of receptors is that the drugs combine in some way with the tissue they affect. In order to develop a system of thought about drug action it is necessary, in the absence of intimate knowledge, to make additional assumptions. It is important, however, that such assumptions should be made explicitly so that they may be tested where possible; this, unfortunately, is not often done, with the result that mutually conflicting assumptions abound. In this paper one such additional assumption, which is widely—but apparently unconsciously—held, has been challenged, and several other assumptions have been made. Implicit and erroneous assumptions may be concealed in the ideas which have been expressed in this paper. If so, confusion may result and the conclusions drawn may be wrong. But, if the basic assumption is correct, it will be profitable to continue the argument.
Summary
The inadequacy of the experimental evidence in favour of the theory that the mass law relation between drug concentration and tissue receptors accounts for the slope of concentration-effect curves is pointed out.
A new theory is proposed which avoids the assumption that the percentage effect is equal to the percentage of receptors occupied by a drug. This theory allows a new factor, called efficacy, to be postulated which, together with affinity for the receptors, determines the potency of an agonist drug. This concept removes the absolute distinction between agonist and antagonist drugs, and the existence of an intermediate class of partial agonists is recognized.
Experimental evidence for this theory was obtained from an examination of the actions and interactions of the homologous series of alkyl trimethylammonium ions and atropine. Four members of the series acted as partial agonists.
The assumption that the percentage response is equal to the percentage of receptors occupied is hidden in much current discussion of drug action. If this assumption is wrong, as is now suggested, the conclusions to be drawn from a wide range of experimental observations will be modified. The concept of competitive antagonism, and ideas about the relation of chemical structure to pharmacological activity, are discussed.
Acknowledgments
The experimental work was possible only because Dr. R. B. Barlow undertook the synthesis of the alkyl trimethylammonium salts. I am very grateful.
Some of the material in this paper was discussed at meetings of the British Pharmacological Society in July, 1952, and January, 1954, and at the XIX International Physiological Congress (Stephenson, 1953).
References
- Ariëns EJ, de Groot WM. Arch. int. Pharmacodyn. 1954;99:193. [PubMed] [Google Scholar]
- Boura A, Mongar JL, Schild HO. Brit. J. Pharmacol. 1954;9:24. doi: 10.1111/j.1476-5381.1954.tb00811.x. [DOI] [PMC free article] [PubMed] [Google Scholar]
- Clark AJ. J. Physiol. 1926;61:530. doi: 10.1113/jphysiol.1926.sp002314. [DOI] [PMC free article] [PubMed] [Google Scholar]
- Clark AJ. J. Physiol. 1927;64:123. doi: 10.1113/jphysiol.1927.sp002424. [DOI] [PMC free article] [PubMed] [Google Scholar]
- Clark AJ. Handbuch der experimentellen Pharmakologie, Ergänzungswerk. Berlin: Springer; 1937a. Heffter. Bd. 4. [Google Scholar]
- Clark AJ. Handbuch der experimentellen Pharmakologie, Ergänzungswerk. 1937b:73. [Google Scholar]
- Clark AJ. Handbuch der experimentellen Pharmakologie, Ergänzungswerk. 1937c:193. [Google Scholar]
- Clark AJ, Raventós J. Quart. J. exp. Physiol. 1937;26:375. [Google Scholar]
- Ford Moore AH, Ing HR. J. chem. Soc. 1945:55. [PubMed] [Google Scholar]
- Furchgott RF. J. Pharmacol. 1954;111:265. [PubMed] [Google Scholar]
- Furchgott RF, Bhadrakom S. J. Pharmacol. 1953;108:129. [PubMed] [Google Scholar]
- Gaddum JH. J. Physiol. 1926;61:7P. doi: 10.1113/jphysiol.1926.sp002280. [DOI] [PMC free article] [PubMed] [Google Scholar]
- Gaddum JH. J. Physiol. 1937;89:144. [Google Scholar]
- Gaddum JH, Hameed KA, Hathway DE, Stephens FF. Quart. J. exp. Physiol. 1955;40:49. doi: 10.1113/expphysiol.1955.sp001097. [DOI] [PubMed] [Google Scholar]
- Holton P, Ing HR. Brit. J. Pharmacol. 1949;4:190. doi: 10.1111/j.1476-5381.1949.tb00535.x. [DOI] [PMC free article] [PubMed] [Google Scholar]
- Langley JN. J. Physiol. 1878;1:339. doi: 10.1113/jphysiol.1878.sp000028. [DOI] [PMC free article] [PubMed] [Google Scholar]
- Langley JN. J. Physiol. 1905;33:374. doi: 10.1113/jphysiol.1905.sp001128. [DOI] [PMC free article] [PubMed] [Google Scholar]
- Nickerson M. Pharmacol. Rev. 1949a;1:27. [Google Scholar]
- Nickerson M. Pharmacol. Rev. 1949b;1:39, 40. [Google Scholar]
- Raventós J. Quart. J. exp. Physiol. 1937a;26:361. [Google Scholar]
- Raventós J. Quart. J. exp. Physiol. 1937b;27:99. [Google Scholar]
- Reuse JJ. Brit. J. Pharmacol. 1948;3:174. doi: 10.1111/j.1476-5381.1948.tb00371.x. [DOI] [PMC free article] [PubMed] [Google Scholar]
- Schild HO. Brit. J. Pharmacol. 1947;2:189. doi: 10.1111/j.1476-5381.1947.tb00336.x. [DOI] [PMC free article] [PubMed] [Google Scholar]
- Stephenson RP. 1953. p. 801. Abstracts of Communications, XIX International Physiological Congress.
- Van Maanen EF. J. Pharmacol. 1950;99:255. [PubMed] [Google Scholar]
- Webb JL. Brit. J. Pharmacol. 1950;5:335. doi: 10.1111/j.1476-5381.1950.tb00584.x. [DOI] [PMC free article] [PubMed] [Google Scholar]
- Welsh JH. Bull. Johns Hopk. Hosp. 1948;83:568. [PubMed] [Google Scholar]