Abstract
Various applications of pAx measurements are discussed based on the hypothesis that drugs and drug antagonists compete for receptors according to the mass law. Examples are given illustrating the use of pAx measurements to identify agonists which act on the same receptors and to compare the receptors of different tissues. Tests of competitive and noncompetitive antagonism are considered in relation to the antagonisms acetylcholine-atropine, histamine-atropine and acetylcholine-cinchonidine. A new measure, pAh, is introduced to express the activity of unsurmountable antagonists.
Although drug receptors have not so far been identified by physical or chemical methods, they can be identified pharmacologically by means of antagonists. If two agonists act on the same receptors they can be expected to be antagonized by the same antagonist, and, if the antagonism is competitive, they can be expected to be antagonized by the same concentration of antagonist and to produce with it the same pAx (Schild, 1947a) or dose ratio (Gaddum, Hameed, Hathway, and Stephens, 1955); pAx values can thus be used to identify agonists which act on the same receptors. They can also be used to identify receptors in different tissues since tissues with similar receptors would be expected to give the same pAx with antagonists. Lastly, pAx measurements can be used to distinguish between competitive and noncompetitive antagonists.
In this paper, examples of various applications of pAx are given and the underlying assumptions and theoretical implications are discussed. Methods of measuring the activity of “unsurmountable” antagonists (Gaddum et al., 1955) are also considered. Some of these results have already been referred to in a review article (Schild, 1957).
Methods
In experiments on isolated tissues, automatic assay apparatus (Boura, Mongar, and Schild, 1954) was used. Drugs were administered either by automatic syringes, or by total displacement of the bath fluid by the drug solution. Unless otherwise indicated, pAx values were determined by the method of Schild (1947a).
For the experiments on guinea-pig lung, an air perfused preparation was used modified from that of Sollman and v. Oettingen (1928) but differing from it in that air instead of fluid was perfused through the bronchial tree (see also Arunlakshana and Schild, 1950). The air perfusion system, illustrated in Fig. 1, consisted of a constant pressure head and two consecutive air flow resistances between which the pressure was measured. The first of these resistances consisted of a length of thermometer tubing and the second of the variable resistance of the bronchial tree from which air was allowed to emerge through scarifications on the surface of the lung. The air pressure was recorded by a mercury manometer the excursions of which are amplified by a frontal writing lever. Connection between manometer and lever was provided by a thread attached to a brass-weighted ebonite float resting on the surface of the mercury. The pull of the lever was adjusted to keep the thread taut without lifting the float from the mercury; in this way small excursions of the mercury manometer are amplified 5 to 10 times. An air flow of about 1 cm./min. was maintained with a pressure head of 100 cm. of water.
Fig. 1.
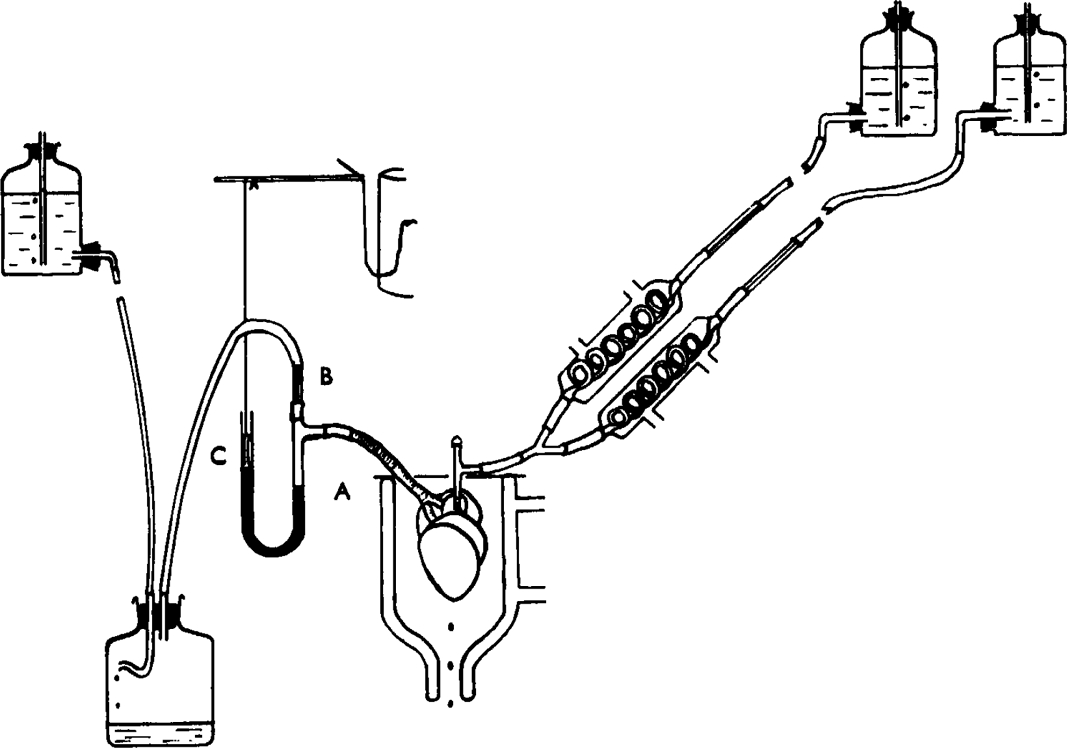
Apparatus for air perfusion of guinea-pig lung. The trachea was attached to side-arm A of the mercury manometer. Air at constant pressure passed through capillary resistance B and emerged through scarifications on surface of lung. C = weighted ebonite float attached to frontal writing lever. Prewarmed Tyrode solution flowed into pulmonary artery.
Guinea-pigs of 600 to 700 g. weight were used. The lungs were removed and immediately perfused with Tyrode solution at 37° through the pulmonary artery. The trachea was then joined to the air perfusion system and the surface of the lung gently scarified with the point of a fine needle. The preparation was placed in a water-jacketed moist chamber at 37°, and the protruding parts of the trachea were painted with liquid paraffin to prevent drying.
In newly set up preparations, the bronchial pressure record usually exhibited intermittent fluctuations presumably related to the rhythmic contractions of bronchi described by Einthoven (1892). The spontaneous movements generally subsided in the course of the experiment. Injections into the perfusion fluid of single doses of histamine and acetylcholine produced rapid and reversible rises of bronchial pressure lasting about 10 min. An approximately linear log dose/response relation was obtained over a fourfold range when the area of the time/response curve was used as the response metameter (Fig. 2). When drugs were administered at 15 min. intervals, the responses tended to increase for the first 3 to 4 administrations and then became reasonably stable.
Fig. 2.
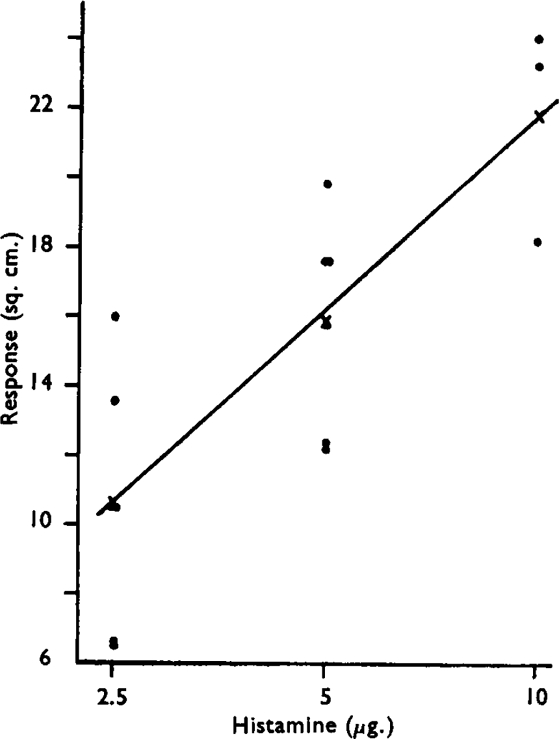
Dose/response curve for air-perfused guinea-pig lung. Ordinate represents area of curve above base-line following administration of histamine.
β-2-Pyridylethylamine was obtained through the courtesy of the Maltbie Chemical Co. The other drugs used are standard commercial preparations.
Theoretical Considerations
Tests of Competitive and Noncompetitive Antagonism
The mass law equations as applied to drug antagonism refer to events on receptors rather than to observable responses, and in applying these equations it is necessary to postulate some relation between receptor activation and response. It has sometimes been assumed that the response is a linear function of the number of activated receptors, but more usually the more limited assumption has been made that equal effects in the absence and presence of antagonist involve annual numbers of receptors. This limited assumption, which does not specify the relation between receptors and response, underlies the use of pAx (and the dose ratio) in testing for competitive and noncompetitive antagonism.
Use of pAx to Test for Competitive Antagonism
Consider the competitive equation
 |
where y is the fraction of activated receptors, A and B are concentrations of agonist and antagonist respectively, x is the dose ratio, and K1, K2, and n are constants. Since by definition pAx=-log B (Schild, 1949)
| (1) |
Thus when log (x − 1) is plotted against pAx a straight line results with slope (–n). This line intersects the pAx axis at a point corresponding to pA2. When n = 1
 |
The pA2 – pA10 difference can thus be used to test for a simple competitive antagonism, but for technical reasons, to be discussed later, it is better to employ a wider range of concentrations of antagonist and test for competitive antagonism by means of equation (1). It should be noted that both tests are independent of y and thus require no knowledge of the fraction of receptors activated.
Competitive Drug Antagonism and Parallel Log Dose/Effect Curves
It can be shown that competitive antagonists produce parallel log dose/effect curves and that parallel log dose/effect curves can be fitted by equations of competitive antagonism.
(1) Consider first a simple competitive antagonism. If two responses correspond to activated receptor fractions y1 and y2
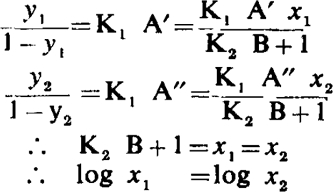 |
Hence y1 and y2 are equally displaced when plotted on a logarithmic dose scale, and consequently the dose/response curves without and with antagonist are parallel.
(2) Consider next a competitive antagonism with two affinity constants for the antagonist. The equilibrium equations are
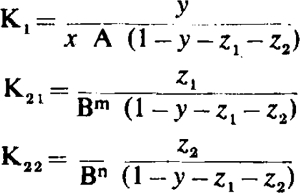 |
where z1 and z2 are the fractions of receptors occupied by antagonists corresponding to affinity constants K21 and K22, m and n are the number of molecules of antagonist per receptor, and the other terms retain their previous significance. Eliminating z1 and z2
 |
In the case of more than two affinity constants for the antagonist the following general equation obtains:
 |
The same argument can now be applied as in section (1) above to prove that the log dose/effect curves with and without antagonist are parallel.
(3) To prove the converse, namely that parallel log dose/effect curves can generally be fitted by an equation of competitive antagonism, it is necessary to show that a general function x = f (B) exists linking any horizontal displacement (log x) with concentration (B) of antagonist. But such a function must exist since x is a polynomial function of B and it is always possible to fit by means of a polynomial a series of experimental points.
To summarize, it is generally possible to fit an equation of competitive antagonism to a set of parallel log dose/effect curves although the equation may be complicated and involve several affinity constants. On the other hand, it is obvious that parallel log dose/effect curves are no proof of a competitive antagonism, indeed they may occur in neutralization antagonism as shown by Gaddum (1943).
The Use of pAx to Test for Noncompetitive Antagonism
Consider the equation of noncompetitive antagonism (Schild. 1954):
 |
In this type of antagonism the log dose/effect curves are not parallel but become progressively flatter and their maxima decline. Both the pAx values and the pAx differences now depend on y. The relation between (pA2 – pA10) and y in this type of antagonism is given by curve a in Fig. 3; it is seen that when y = 0.5, pA2 – pA10 = 0.39, but when y → 0, pA2 – pA10 → 0.95 as in competitive antagonism. For the calculation of K′2 from the above equation it is necessary to know the value of y, but when y is unknown K′2 may nevertheless be calculated from the following expression:
Fig. 3.
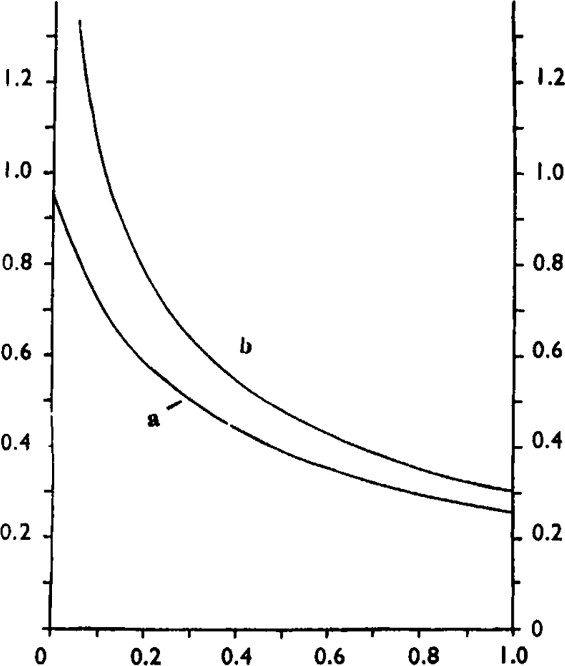
Abscissa: fraction of receptors occupied by agonist. Ordinate: theoretical values of (a) pA2 – pA10, (b) pA2–pAh for a noncompetitive antagonist.
 |
(2) |
where x1 and x2 are the drug ratios corresponding to antagonist concentrations B1 and B2.
The Use of pAh
One of us (Schild, 1957) has proposed that the activity of antagonists which reduce the attainable maximum of the dose/response curve be expressed in terms of pAh, which is defined as the negative logarithm of the molar concentration of antagonist which reduces the maximum to one half. This was intended as an experimental measure for use with all antagonists which reduce the maximum, independently of their mode of action. Only in a special case has pAh, theoretical significance, namely when the antagonism is noncompetitive and the response directly proportional to the fraction of receptors activated. In that case
In the case of a noncompetitive antagonism with a non-linear relation between activated receptors and response, the pA2 – pAh difference varies according to the fraction of receptors activated. The relation of pA2 – pAh and y for this case is shown in Fig. 3 (curve b).
Ariens and van Rossum (1957) have independently introduced a different nomenclature in which the logarithm of the affinity constant of a noncompetitive antagonist is designated as pD′3. The two nomenclatures need not conflict if pD′2 is used to denote an affinity constant and pAh to denote an empirical measurement.
Results
Antagonism of Pyridylethylamine and Antihistamines
β-2-Pyridylethylamine produces a variety of histamine-like effects (Walter, Hunt, and Fosbinder, 1941); it contracts the guinea-pig ileum, but is about 30 times less active in this respect than histamine. The object of the following experiments was to find out whether pyridylethylamine and histamine produce similar pAx values with antihistamines.
The pA2 of two different antihistamine drugs was measured on the guinea-pig ileum using both agonists as stimulants. Table I shows that the antihistamine drugs gave closely similar pA2 values with the two agonists. In another set of experiments, an indirect method of comparing pAx values was employed, in which the activity ratios of the two agonists were determined before and after administration of diphenhydramine. A typical experiment consisted of a 2 + 2 assay to determine the activity-ratio of histamine and pyridylethylamine, followed by a second assay with double doses of agonists in the presence of 1:300 × 10° diphenhydramine. In six such assays, no significant change in the activity ratio occurred after diphenhydramine (Table II). Fig. 4 represents the average responses in this series in terms of the maximal response. It is seen that the regression lines of the two agonists are equally displaced by the antagonist, confirming that histamine and pyridylethylamine give the same pAx values with diphenhydramine.
Table I.
The pA2 Values of Mepyramine and Diphenhtdramine with Histamine and Pyridylethylamine Using the Guinea-Pig Ileum
14 min. contact
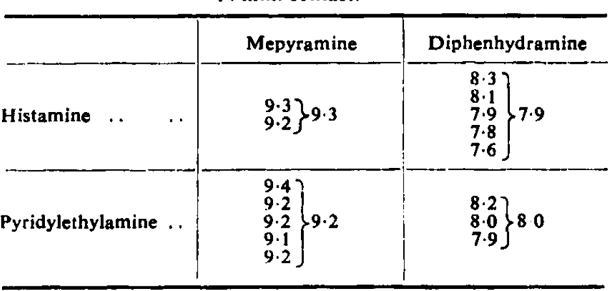 |
Table II.
Activity Ratio of Histamine and Pyridylethylamine as Measured in 2 + 2 Assays Before and After Addition of Diphenhydramine Using the Guinea-Pig Ileum
| No. of Expt. | Activity Ratio Before Diphenhydramine | Activity Ratio in Presence of Diphenhydramine (1: 300 × 104) |
|---|---|---|
| 1 | 48 | 57 |
| 2 | 39 | 43 |
| 3 | 28 | 31 |
| 4 | 46 | 46 |
| 5 | 40 | 41 |
| 6 | 65 | 65 |
Fig. 4.
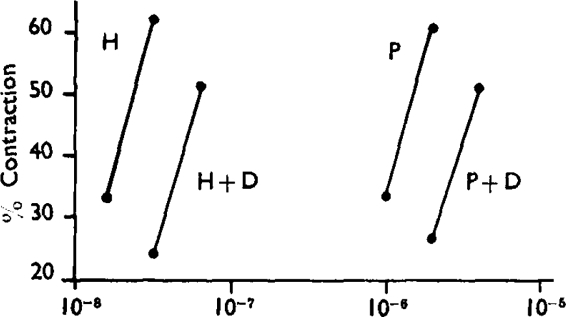
Guinea-pig ileum. Effects of histamine (H) and pyridylethylamine (P) in absence and presence of diphenhydramine (D) 1:300 × 106. Mean responses of six assays. Abscissa: concentration of agonist.
Measurements of pAx on Perfused Lung, Isolated Tracheal Chain, and Ileum
A set of measurements of pA2 and pA10 on the air perfused lung is shown in Fig. 5. Fig. 5a shows the effects of 2.5 μg. histamine and Figs. 5 b-c the effects of 5 and 25 μg. of histamine administered after various concentrations of pethidine had been added to the stock solutions. Each dose of histamine was repeated three times, and the mean area under the second and third response curve used for the calculation of pA2 and pA10 values. The results obtained were: pA2 = 6.09 and pA10 = 4.88.
Fig. 5.
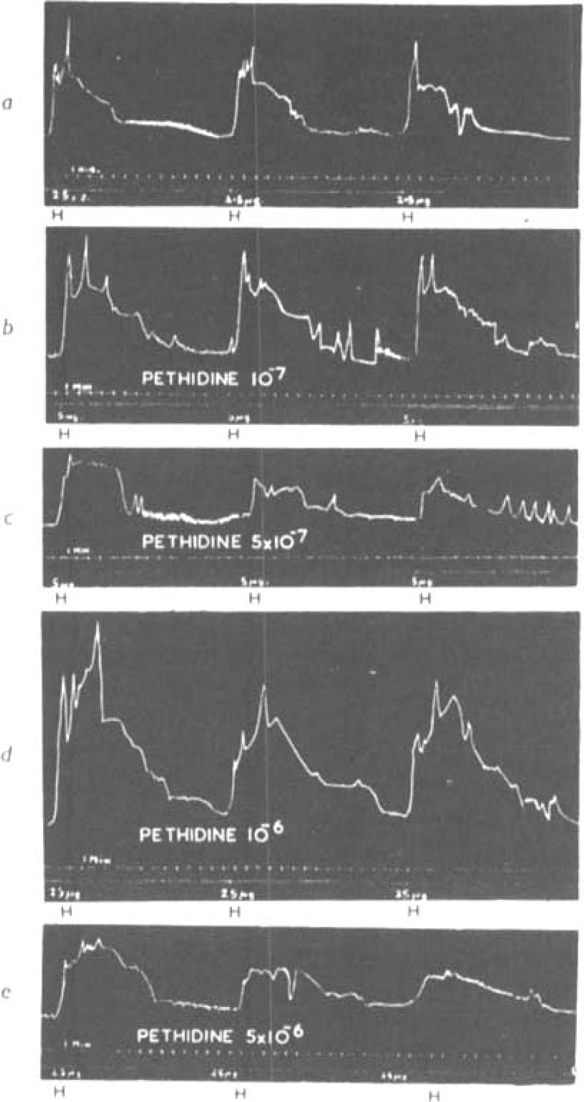
Air-perfused guinea-pig lung. Doses of histamine (H) injected into the perfusion fluid in absence and presence of pethidine hydrochloride (P). (a) 2·5 μg. H; (b) 5 μg. H with 10−7 P; (c) 5 μg. H with 5 × 10⁻⁷ P; (d) 25 μg. H with 10−7 P; (e) 25 μg. H with 5 × 10⁻⁶ P.
A series of similar experiments with mepyramine, diphenhydramine, pethidine, and atropine as histamine antagonists and atropine as acetylcholine antagonist are summarized in Table III, which also includes the results of earlier experiments on the guinea-pig ileum. It is seen that in spite of the difference in preparation and experimental procedure the two sets of experiments gave on the whole similar results; the differences were not statistically significant by the t-test.
Table III.
Comparison of pAx Values Obtained on the Guinea-Pig Ileum and the Air-Perfused Lung
The total number of individual determinations is given in parentheses with the standard deviation. The results on the ileum are from Schild (1947a)
| pA2 | pA10 | ||||
|---|---|---|---|---|---|
| Active Drug | Antagonist | Ileum 14 min. | Air-perfused Lung 30 min. | Ileum 14 min. | Air-perfused Lung 30 min. |
| Histamine | Mepyramine | 9.46 (5, 0.22) | 9.37 (3, 0.16) | 8.36 (1) | 8.38 (3, 0.28) |
| Diphenhydramine | 8.02 (9, 0.28) | 7.80 (4, 0.22) | 7.02 (4, 0.31) | 6.92 (3, 0.74) | |
| Pethidine | 6.13 (5, 0.46) | 6.15 (2, 0.08) | 5.00 (5, 0.21) | 5.06 (4, 0.23) | |
| Atropine | 5.64 (3.018) | 5.91 (4, 0.61) | 4.60 (3, 0.24) | 5.03 (3, 0.68) | |
| Acetylcholine | Atropine | 8.61 (11, 0.15) | 8.76 (2, 0.63) | 8.05 (3, 0.13) | 7.63 (6, 0.64) |
It was of interest to compare the effective concentrations of both agonist and antagonist in two tissues. Since in the perfused lung preparation the agonist was injected and its final concentration was undefined, we used the isolated guinea-pig tracheal chain (Castillo and de Beer, 1947) and ileum for this comparison. Table IV shows the effective doses of histamine, expressed in terms of log concentration giving a 50% response, and the pA2 values of diphenhydramine and mepyramine in the two preparations. It is seen that whilst the pA2 values are similar the effective concentrations of histamine in the two tissues vary. It follows that the drug ratios (agonist/antagonist, Gaddum et al., 1955) in the two tissues are also different.
Table IV.
Effective Concentrations of Histamine and Antagonists in Two Preparations
The number of experiments is given in brackets
| –Log ED50 Histamine | pA2 | ||
|---|---|---|---|
| Diphenhydramine | Mepyramine | ||
| Ileum | 7.7 (11) | 7.9 (5) | 9.3 (2) |
| Tracheal chain | 6.1 (4) | 7.8 (2) | 9.1 (2) |
Antagonism Acetylcholine-atropine
Previous estimates of pA2–pA10 for acetylcholine-atropine gave lower estimates than the theoretical value of 0.95 to be expected for a simple competitive antagonism at equilibrium. We have reinvestigated this antagonism employing a wider range of concentrations of atropine and as far as possible under equilibrium conditions.
In assessing the significance of the low pA2–pA10 values in earlier work (Schild, 1947a: 0.56; Marshall, 1955b: 0.73) two possible sources of error have to be taken into account. (1) Failure to attain equilibrium. This applies particularly to the measurements of Schild (1947a) which were taken after a fixed period of 14 min. contact with antagonist. (2) Paradoxical potentiating effects. Very low concentrations of atropine sometimes produce a potentiation instead of antagonism and this would interfere with pA2 measurements.
Fig. 6. illustrates an experiment in which a wide range of concentrations of atropine was employed. In this instance hexamethonium (10−6) was added to the bath fluid in order to prevent stimulation of the ganglia of Auerbach's plexus by high concentrations of acetylcholine. Before adding atropine the preparation was stabilized by administering about 100 doses of acetylcholine. Only the middle range of the response curve was utilized and each point in Fig. 6 represents the mean of several responses. The log dose/effect curves are parallel, though steeper than would be expected from simple proportionality between receptors and response. When plotted by using equation (1), the results can be fitted by a straight line with slope – n= 1.04 (Fig. 7).
Fig. 6.
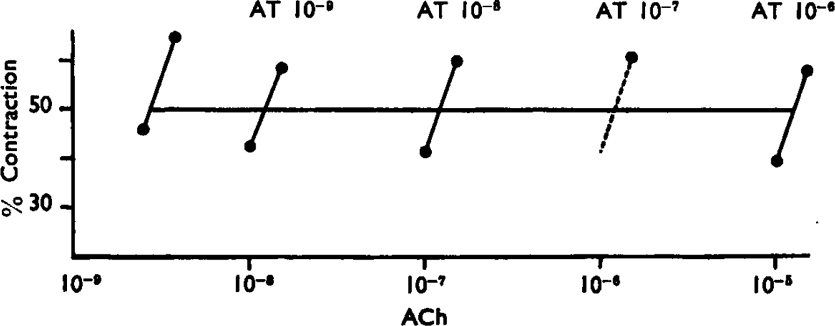
Guinea-pig Ileum. Effects of acetylcholine (ACh) in absence and presence of atropine (AT). Hexamethonium 10−6 was added to the Tyrode solution.
Fig. 7.
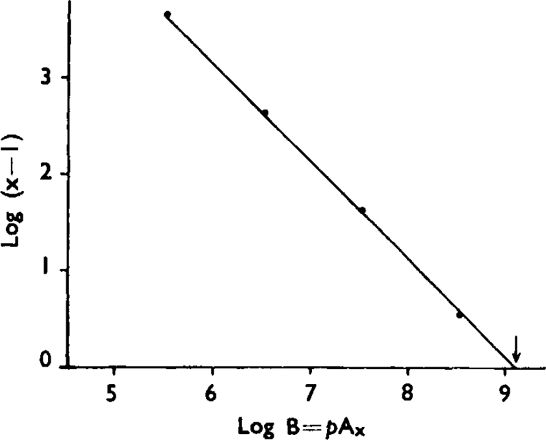
Results from Fig. 6 plotted by using equation (I) developed in the text — n = 1·04. The arrow indicates the pA2 value.
In a series of experiments with two or more doses of atropine, the following simplified procedure was adopted: a stable submaximal response was first produced with acetylcholine alone and reproduced afterwards with a larger dose of acetylcholine in the presence of atropine. For each response in the presence of atropine a value of K2 for n = 1 was calculated, and this is shown in Table V. Omitting one discrepant result (Expt. No. 8), Table V shows no significant change in the value of log K2 within each experiment (P > 0.7). It can be concluded that K2 is a constant and that the results are compatible with the hypothesis of a simple competitive antagonism with n = 1, in which case log K2 = pA2. The calculated average equilibrium value of pA2 is 9.0, which is somewhat higher than the earlier value of 8.61 obtained by the standard method after 14 min. contact with atropine.
Table V.
Values of Log  = Log K2 for Acetylcholine-Atropine on Ouinea-Pig Ileum
In Expt. Nos. 1 and 2 hexamethonium 10−6 was added to the Tyrode solution
| No. of Expt. | — Log Cone. Atropine Sulphate | Log K2 | |
|---|---|---|---|
| 1 | 9 | 9.06 | |
| 8 | 9.16 | ||
| 7 | 9.15 | ||
| 6 | 9.17 | 9.14 | |
| 2 | 9 | 9.07 | |
| 6 | 9.06 | 9.07 | |
| 3 | 9 | 9.0 | |
| 8 | 8.87 | ||
| 7 | 8.9 | 8.92 | |
| 4 | 9.1 | 8.81 | |
| 8.1 | 8.88 | 8.85 | |
| 5 | 9.1 | 9.1 | |
| 8.1 | 9.04 | 9.07 | |
| 6 | 9.3 | 8.83 | |
| 8.3 | 8.74 | 8.79 | |
| 7 | 9.5 | 9.03 | |
| 8.53 | 9.01 | 9.02 | |
| 8 | 1.00 | 9.53 | |
| 8.62 | 9.1 | 9.32 | |
| 9 | 9.28 | 8.81 | |
| 8.42 | 8.9 | 8.86 | |
| — | |||
| 9.0 | |||
Antagonism Histamine-atropine
Atropine is a weak histamine antagonist, being about 1,000 times less active against histamine than against acetylcholine (Schild, 1947a). Nevertheless the antagonism between histamine and atropine is probably not unspecific but competitive.
The log dose/effect curves of histamine with atropine are parallel over a considerable range (Fig. 8), though very high concentrations of atropine (10−4) tend to flatten the slope. Fig. 9 shows a plot of equation (1) which embodies the results of three separate experiments. The experimental points are fitted by a straight line with a slope (–n) of 0.92. The graphical pA2 value is 5.76 as against 5.64 in earlier work.
Fig. 8.
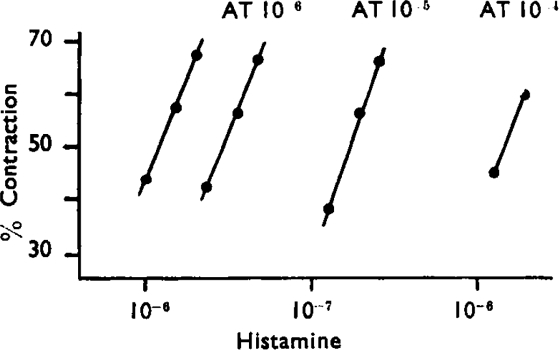
Guinea-pig ileum. Effects of histamine in absence and presence of atropine (AT).
Fig. 9.
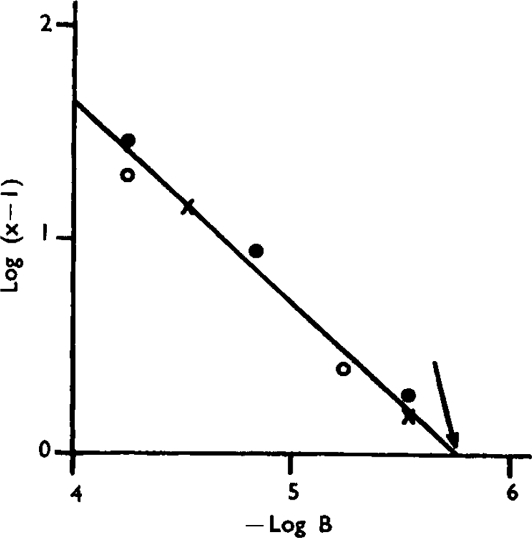
Plot of equation (1) for three separate experiments on guinea-pig ileum, with histamine as agonist and atropine as antagonist. The arrow indicates the pA2 value.
Atropine thus behaves as an imperfect competitive antagonist of histamine over a certain range presumably by virtue of a weak affinity for histamine receptors.
Antagonism Acetylcholine-cinchonidine
Fig. 10 shows log dose/effect curves of acetylcholine with cinchonidine obtained on the guinea-pig ileum. The slope of the curves becomes progressively flatter and their maxima decline; in the end all doses of acetylcholine become ineffective. Usually the flattening of the slope precedes the diminution of the maximum. Very high concentrations of cinchonidine also alter the character of the response to a brief contraction followed by relaxation. Similar curves can also be obtained with histamine as agonist.
Fig. 10.
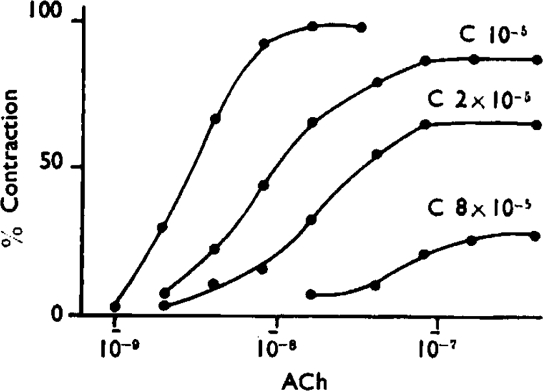
Guinea-pig ileum. Dose/response curves of acetylcholine (ACh) with cinchonidine (C). The left-hand curve was in the absence of cinchonidine.
Sometimes a parallel shift of the log dose/effect curves precedes the flattening of the slope, but we found it difficult to decide whether this was a true effect or an artifact due to persistent depression from an earlier large dose. In order to avoid this kind of artifact the measurements were generally so conducted that maximal effects were elicited only at the beginning; the preparation was then allowed to recover and the subsequent responses elicited in the middle range. Under these conditions cinchonidine regularly produced a flattening of the slope as shown in Fig. 11.
Fig. 11.
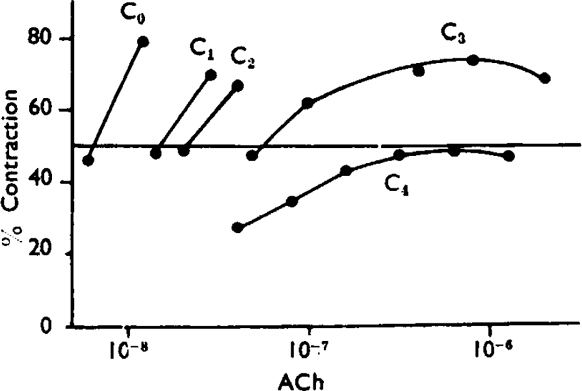
Guinea-pig ileum. Short dose/response curves of acetylcholine (ACh) with cinchonidine (C): C0 = no cinchonidine, C1 = 5 × 10⁻⁶, C2 = 10−5, C3 = 2 × 10⁻⁵, C4 = 4 × 10⁻⁵.
The pA2 was measured at the 50% response level from curves such as those shown in Fig. 11. The final value was obtained by interpolation or close extrapolation. The pAh was obtained by interpolation or close extrapolation from two curves whose maxima were reduced to near 50%. To identify the maximum, doses of acetylcholine were successively doubled and the maximum was considered to have been reached when a doubling of the dose produced either no increase or a decrease in response. Values of K′2 were calculated from equation (2) for each set of two consecutive responses in the presence of cinchonidine.
The results of these measurements are summarized in Table VI. It is seen that the pAh values are more consistent than the values of log K′2 which vary within and between experiments. The average pA2–pAh difference is 0.9, which in a noncompetitive antagonism corresponds to 14% receptor activation for a 50% response (Fig. 3b). However, in view of the atypical responses obtained in the presence of cinchonidine and the variability of K′2, it is doubtful that a true noncompetitive antagonism can be assumed, and it would seem more justified to regard pAh in this instance simply as an experimental measurement. The pAh can then be regarded as a measure of the antagonistic activity of cinchonidine and the pA2–pAh as a measure of the main effective range of the antagonist.
Table VI.
Acetylcholine-Cinchonidine. Guinea-Pig Ileum
| No. of Expt. | Log K′2 | pA2 | pAh | pA2-pAh | |
|---|---|---|---|---|---|
| 1 | 4.6 | ||||
| 4.9 | |||||
| 4.2 | 4.6 | 4.7 | 3.8 | 0.9 | |
| 2 | 5.5 | ||||
| 4.8 | 5.2 | 4.9 | 4.0 | 0.9 | |
| 3 | 5.0 | ||||
| 5.1 | |||||
| 5.1 | 5.1 | 5.1 | 3.9 | 1.1 | |
| 4 | 4.8 | ||||
| 5.0 | |||||
| 4.9 | 4.9 | 5.0 | 4.0 | 1.0 | |
| 5 | 3.9 | ||||
| 4.4 | 4.2 | 4.4 | 4.0 | 0.4 | |
| 6 | 5.1 | ||||
| 4.7 | |||||
| 4.7 | 4.8 | 5.0 | 4.0 | 1.0 | |
| 7 | 4.9 | ||||
| 4.8 | |||||
| 4.8 | 4.9 | 4.9 | 3.9 | 1.0 | |
| — | — | — | — | ||
| 4.8 | 4.9 | 4.0 | 0.9 | ||
Discussion
The various quantitative applications of pAx described in this paper are all based on the hypothesis which Gaddum (1937) formulated mathematically, that agonists and antagonists compete for receptors according to the mass law. This hypothesis, although no doubt oversimplified, accounts surprisingly well for a variety of experimental findings.
Use of pAx for the Classification of Drugs
Agonists which act on the same receptors can theoretically be expected to produce the same pAx with competitive antagonists. This is a consequence of the mass law and applies whatever the affinity of the agonist or its intrinsic activity (Ariens, 1954) or efficacy (Stephenson, 1956). If it could be verified experimentally that certain groups of agonists produce the same pAx (or dose ratio) with antagonists, the receptor theory would be strengthened and a precise method provided of classifying agonists according to the receptors on which they act (Schild, 1947b). By this criterion histamine and pyridylethylamine would be acting on the same receptors but not histamine and acetylcholine, because although they are both antagonized by atropine their pAx values are different.
Very few quantitative investigations of this kind are available and it is not known how far the principle of classifying agonists by their pAx values can be extended; it tends to break down, however, when applied to agonists with an indirect action. Thus atropine gives similar (though not identical) pAx values with acetylcholine and tetramethyl-ammonium (Clark and Raventos, 1937), but it need not follow that the two agonists act on the same primary receptors. The similarity of their pAx values may be due to tetramethylammonium causing a release of acetylcholine which is then antagonized by atropine.
Use of pAx for the Comparison of Receptors
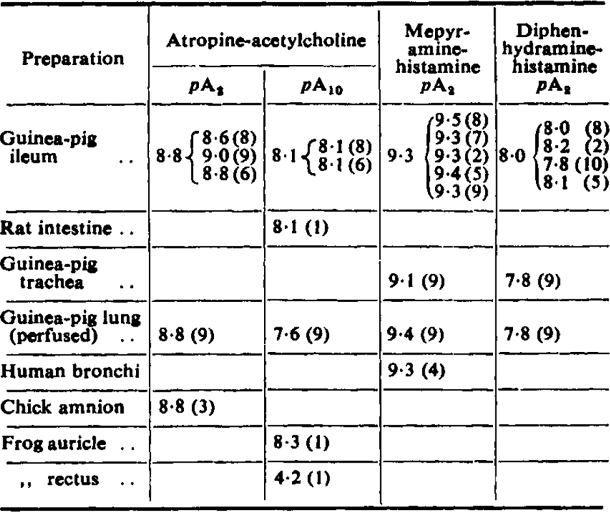
Table VII gives a summary of pAx values of atropine and antihistamines in different preparations. The values in different preparations are on the whole remarkably similar. Thus in the case of atropine similar pAx values are found in such varied preparations as frog heart, chick amnion, and mammalian intestine, the one exception being the frog rectus which presumably has different, nicotinic receptors. The finding that different tissues have receptors with similar affinities for antagonists is interesting since it gives support to the notion that receptors are definite chemical entities.
Table VII.
pAx Values in Different Preparations
(1) Clark and Raventos (1937). (2) De Jalon (after Reuse, 1948). (3) Evans and Schild (unpublished observations). (4) Hawkins and Schild (1951). (5) Marshall (1953a). (6) Marshall (1955b). (7) Reuse (1948). (8) Schild (1947a). (9) Present work. (10) Wilbrandt (1950)
 |
Criticism of Theory of Competitive Antagonism
Although atropine seems to behave as a competitive antagonist of acetylcholine over a wide range of concentrations, there is an old objection against the view that this is a competitive antagonism which was first raised by Clark (1926). It arises from the apparent slow dissociation of atropine from its receptors which makes it difficult to understand that acetylcholine can produce immediate large effects in fully atropinized preparations. One way of formulating this objection is as follows: the very notion of competitive antagonism implies an equilibrium, therefore if acetylcholine cannot get immediately at the receptors its observed effects do not represent an equilibrium and cannot be made the basis of a test for competitive antagonism. Several ways of resolving this difficulty can be proposed.
The antagonism is noncompetitive, and the apparent agreement with competitive antagonism arises from the fact that only few receptors are occupied by the agonist, in which case competitive and noncompetitive antagonists become indistinguishable. It is possible to calculate on this assumption the maximum fraction of receptors that could be occupied by acetylcholine for a given experimental result. This fraction turns out to be exceedingly small. For instance, in order to account in terms of noncompetitive antagonism for the results of experiments with a thousandfold range of atropine (Table V), only about 1/10,000th of receptors could have been occupied by acetylcholine.
The antagonism is competitive in the sense that acetylcholine and atropine act on the same site, but owing to the slow rate of dissociation of atropine from its receptors only the initially unoccupied receptors are immediately available to acetylcholine. Acetylcholine nevertheless can produce effects by combining with a very few “spare” receptors. This is the hypothesis of Stephenson (1956) which has an interesting consequence pointed out by Furchgott (1955). The antagonism would then be practically noncompetitive as regards immediate effects of acetylcholine in an atropinized preparation, since the receptors occupied by atropine would be as unavailable as if blocked by a noncompetitive antagonist. In the limiting case of a comparatively very slow rate of association and dissociation of atropine, the same mathematical consequences would follow as in noncompetitive antagonism and the fraction of receptors occupied by acetylcholine would be as small, or nearly as small, as in (a) above.
The antagonism is competitive and equilibria at the receptor level are rapidly established, but atropine lingers on in a hypothetical “biophase” (Ferguson, 1939; Fastier and Reid, 1948; Furchgott, 1955) which determines the rate of onset and disappearance of its action. The biophase presumably represents the immediate environment of the receptors and not the intracellular spaces, since del Castillo and Katz (1957) have shown that the effects of curare are delayed even when it is applied directly to the motor end plate by a micropipette.
Acetylcholine actually displaces atropine from receptors. This hypothesis has often been advocated, although it is incompatible with the mass law. Clark (1926) tested it experimentally by trying whether a large dose of acetylcholine would speed up the removal of atropine, but obtained no such effect.
In summary, if the antagonism is to be competitive it is necessary to postulate either a diffusion barrier for atropine as suggested by Furchgott (1955) or a very small fraction of receptors occupied by acetylcholine as suggested by Stephenson (1956) or some combination of the two effects. The issue thus hinges largely on the fraction of receptors occupied by acetylcholine.
Noncompetitive Antagonism
The fraction of receptors occupied by acetylcholine could in theory be determined with the aid of a noncompetitive antagonist. Unfortunately a reversible noncompetitive antagonist which obeys the mass law quantitatively does not seem to have been found so far and the following considerations suggest that such an antagonist may be difficult to find.
The antagonist could act in two ways: (1) By reversible inactivation of one kind of receptor; this would constitute a specific noncompetitive antagonism. But experience so far has shown that antagonists which inactivate receptors produce irreversible effects; they behave as “non-equilibrium” antagonists (Nickerson, 1957). (2) By reversible inactivation of a later reaction stage; this would constitute an unspecific noncompetitive antagonism. The effects of unspecific antagonists may, however, be too complicated to be formulated in terms of the mass law. Shanes (1958) has suggested that these antagonists may penetrate the cell membrane and interfere with ionic fluxes during excitation. They would then produce their effects by increasing the spreading tendency of the cell membrane and narrowing the pores through which ions pass. A similar mode of action was suggested by Skou (1954) for local anaesthetics.
References
- Ariëns EJ. Arch. int. Pharmacodyn. 1954;99:32. [PubMed] [Google Scholar]
- Ariëns EJ, van Rossum JM. Arch. int. Pharmacodyn. 1957;109:468. [PubMed] [Google Scholar]
- Arunlakshana O, Schild HO. J. Physiol. (Lond.) 1950;111:48P. [PubMed] [Google Scholar]
- Boura A, Mongar JL, Schild HO. Brit. J. Pharmacol. 1954;9:24. doi: 10.1111/j.1476-5381.1954.tb00811.x. [DOI] [PMC free article] [PubMed] [Google Scholar]
- Castillo JC, de Beer EJ. J. Pharmacol. exp. Ther. 1947;90:104. [PubMed] [Google Scholar]
- Clark AJ. J. Physiol. (Lond.) 1926;61:547. doi: 10.1113/jphysiol.1926.sp002315. [DOI] [PMC free article] [PubMed] [Google Scholar]
- Clark AJ, Raventos J. Quart. J. exp. Physiol. 1937;26:375. [Google Scholar]
- del Castillo J, Katz B. Proc. Roy. Soc. B. 1957;146:339. doi: 10.1098/rspb.1957.0015. [DOI] [PubMed] [Google Scholar]
- Einthoven W. Pflüg. Arch. ges. Physiol. 1892;51:367. [Google Scholar]
- Fastier FN, Reid CSW. Brit. J. Pharmacol. 1948;3:205. doi: 10.1111/j.1476-5381.1948.tb00376.x. [DOI] [PMC free article] [PubMed] [Google Scholar]
- Ferguson J. Proc. Roy. Soc. B. 1939;127:387. [Google Scholar]
- Furchgott RF. Pharmacol. Rev. 1955;7:183. [PubMed] [Google Scholar]
- Gaddum JH. J. Physiol. (Lond.) 1937;89:7P. [Google Scholar]
- Gaddum JH. Trans. Faraday Soc. 1943;39:323. [Google Scholar]
- Gaddum JH, Hameed KA, Hathway DE, Stephens FF. Quart. J. exp. Physiot. 1955;40:49. doi: 10.1113/expphysiol.1955.sp001097. [DOI] [PubMed] [Google Scholar]
- Hawkins DF, Schild HO. Brit. J. Pharmacol. 1951;6:682. doi: 10.1111/j.1476-5381.1951.tb00680.x. [DOI] [PMC free article] [PubMed] [Google Scholar]
- Marshall PB. Brit. J. Pharmacol. 1955a;10:270. doi: 10.1111/j.1476-5381.1955.tb00870.x. [DOI] [PMC free article] [PubMed] [Google Scholar]
- Marshall PB. Brit. J. Pharmacol. 1955b;10:354. doi: 10.1111/j.1476-5381.1955.tb00883.x. [DOI] [PMC free article] [PubMed] [Google Scholar]
- Nickerson M. Pharmacol. Rev. 1957;9:246. [PubMed] [Google Scholar]
- Reuse AJ. Brit. J. Pharmacol. 1948;3:174. doi: 10.1111/j.1476-5381.1948.tb00371.x. [DOI] [PMC free article] [PubMed] [Google Scholar]
- Schild HO. Brit. J. Pharmacol. 1947a;2:189. doi: 10.1111/j.1476-5381.1947.tb00336.x. [DOI] [PMC free article] [PubMed] [Google Scholar]
- Schild HO. Brit. J. Pharmacol. 1947b;2:251. doi: 10.1111/j.1476-5381.1947.tb00342.x. [DOI] [PMC free article] [PubMed] [Google Scholar]
- Schild HO. Brit. J. Pharmacol. 1949;4:277. doi: 10.1111/j.1476-5381.1949.tb00548.x. [DOI] [PMC free article] [PubMed] [Google Scholar]
- Schild HO. J. Physiol. (Lond.) 1954;124:33P. [PubMed] [Google Scholar]
- Schild HO. Pharmacol. Rev. 1957;9:242. [PubMed] [Google Scholar]
- Shanes AM. Pharmacol. Rev. 1958;10:59. [PubMed] [Google Scholar]
- Skou JC. Acta pharmacol. (Kbh.) 1954;10:325. doi: 10.1111/j.1600-0773.1954.tb01349.x. [DOI] [PubMed] [Google Scholar]
- Sollman Tv, Oettingen WF. Proc. Soc. exp. Biol. N.Y. 1928;25:692. [Google Scholar]
- Stephenson RP. Brit. J. Pharmacol. 1956;11:379. doi: 10.1111/j.1476-5381.1956.tb00006.x. [DOI] [PMC free article] [PubMed] [Google Scholar]
- Walter LA, Hunt WH, Fosbinder RJ. J. Amer. chem. Soc. 1941;63:2771. [Google Scholar]
- Wilbrandt W. Helv. physiol. pharmacol. Acta. 1950;8:399. [PubMed] [Google Scholar]


