

Abstract
Top-down control processes are thought to interact with bottom-up stimulus-driven task demands to facilitate the smooth execution of behaviour. Frontal and midline areas are believed to subserve these control processes but their distinct roles and the interactions between them remain to be fully elucidated. In this fMRI study, we utilised a GO/NO-GO task with cued and uncued inhibitory events to investigate the effect of cue-induced levels of top-down control on NO-GO trial response conflict. We found that on a within-subjects, trial-for-trial basis, high levels of top-down control, as indexed by left dorsolateral prefrontal activation prior to the NO-GO, resulted in lower levels of activation on the NO-GO trial in the pre-supplementary motor area. These results suggest that prefrontal and midline regions work together to implement cognitive control and reveal that intra-subject variability is reflected in these lateral and midline interactions.
Keywords: functional MRI, cognitive control, dorsolateral prefrontal cortex, presupplementary motor area, anterior cingulate cortex
Introduction
Botvinick, Carter, Cohen and colleagues have theorised that prefrontal cortex (PFC) and the anterior cingulate cortex (ACC) work together to implement cognitive control (Cohen et al., 2000; Botvinick et al., 2001). They maintain that ACC serves as a conflict monitor, detecting when two competing response pathways are simultaneously activated and feeding this information back to PFC in order to increase levels of top-down control or selective attention. Increasing top-down control leads to a decrease in conflict by focusing attention on relevant and away from irrelevant dimensions of a task.
Successful task performance relies upon monitoring behavior, comparing outcomes to internal goals and using these internal calculations to guide behaviour change when performance is deemed below par. Lateral PFC has been implicated in maintaining representations of task set or rules defining appropriate stimulus-response mappings used in decision-making or execution of behaviour (see Miller & D'Esposito, 2005) for a review). It is also thought to maintain internal goals and bias attentional resources toward relevant dimensions of a task (Cohen et al., 2000). Midline structures are thought to monitor performance for errors or the possibility that errors are likely to occur (Brown & Braver, 2005; Magno et al., 2006), as in the situation of high response-conflict. Rostral areas of ACC may be responsible for error processing whereas more dorsal, caudal parts of ACC extending into pre- supplementary motor area (SMA) may be concerned with the detection of response-conflict (Ullsperger & von Cramon, 2001; Garavan et al., 2003; Hester et al., 2004a). Hence it follows that lateral PFC and midline regions should interact during task performance (Cohen et al., 2000; Botvinick et al., 2001). Consequently, observing control-conflict inter-relationships between cortical areas would progress our understanding of both where and how control processes are instantiated in the brain.
Though hypothesised and central to models of cognitive control, prefrontal-midline interactions have not yet been empirically demonstrated on a within-subject, trial-for–trial basis. Although associations have been found between the PFC and ACC in response conflict resolution (MacDonald et al., 2000; Badre & Wagner, 2004; Fincham and& Anderson, 2006) studies have not examined how changing levels of conflict on a trial-by-trial basis affected the relationship between these regions. We utilized data from a previous GO/NO-GO study (Hester et al., 2004b), in which half of the NO-GO events were cued and half were uncued. By examining activity during the preparatory period between the cue and the NO-GO, we sought to identify the mechanisms involved in marshalling top-down attentional control to prepare for the inhibition and, critically, determine how this attentional control affected conflict-related levels of midline activity produced on the NO-GO trial. Being interested in the dynamic between PFC (Frith & Dolan, 1996; Brass & von Cramon., 2002; Garavan et al., 2002b) and midline areas (Carter et al., 1998; Botvinick et al., 1999; Ullsperger & von Cramon, 2001) associated with behavioural control, our functional analyses focused on cued correct inhibitions and the cue period prior to these correct events, which also enabled us to focus on conflict uncontaminated by any other error-specific processes (Garavan et al., 2003).
Materials and Methods
Subjects and Experimental Design
All participants provided written, informed consent, and were paid for their participation. The Institutional Review Board of the Nathan Kline Institute, where the MRI scans were acquired, approved all procedures. Fifteen right-handed participants (10 female, mean age 30, range: 23-40), were required to respond by button press to a series of alternating letters X and Y presented at 1 Hz. Each letter was on-screen for 900 msec followed by a 100 msec blank screen. Participants were required to inhibit their response when the alternating sequence was broken (i.e., when two Xs or two Ys were presented in succession; participants would respond to all stimuli bar the fifth in the sequence X Y X Y Y X) (Garavan et al., 2002b). A cue (a letter with a strikethrough, for example, X̵ or Y̵) was presented from 2 to 7 letters (seconds) in advance of half of the NO-GO trials (e.g., participants would respond to all letters bar the last but including the cue letter in the following sequence X Y X̵ Y X Y X X). Prior to scanning, participants were informed of the relationship between the cue and an impending NO-GO stimulus. For any given cue, participants did not know the duration of the period between the cue and the coming NO-GO trial. In total, the task comprised of 40 cued NO-GO, 40 uncued NO-GO and 1096 GO trials, with the cued and uncued NO-GO stimuli pseudo-randomly interspersed throughout the GO trials, .
Imaging Parameters
Scanning was performed on a 1.5 T Siemens VISION scanner in which foam padding was used to restrict head movements. Contiguous high resolution, T1-weighted MPRAGE slices were acquired for each participant (slice thickness = 1 mm, field of view = 256 mm) to enable subsequent anatomical localization and spatial normalisation. Functional images were single-shot, T2* weighted, echo planar imaging sequences. Contiguous 5 mm sagittal slices were acquired for each participant covering the entire brain (TR = 2000 msec, TE = 50 msec, 64 mm × 64 mm matrix size, field of view = 256 mm). Stimuli were presented using an IFIS-SA stimulus-delivery system (MRI Devices Corp., Waukesha, Wisconsin), which was equipped with a 640 × 480 LCD screen, which was mounted on the head coil and was directly in the participants’ line of vision. E-prime (Psychology Software Tools Inc.) presented and recorded participants’ responses.
Image Analyses
All analyses were conducted using AFNI software (Cox, 1996) (http://afni.nimh.nih.gov/afni). Images were time-shifted using Fourier interpolation to correct for differences in slice acquisition time, motion corrected using 3-D volume registration (least squares alignment of three translational and three rotational parameters) and edge-detected by removing any activation outside the brain. The first five and last two volumes were excluded from further analysis. As no participant displayed significant residual motion, data from all fifteen participants were included. A mixed regression analysis was employed whereby cue period activation was calculated in a block-design manner as a percentage change score relative to tonic, task-related activity and four separate impulse response functions were calculated for event-related activity associated with cued and uncued inhibitions and commission errors. Although we were specifically interested in activation for correct inhibitions and the cue periods that preceded them, the inclusion of the additional event-related regressors served to account for the variance associated with these events. Varying the duration of the cue periods (from 2 to 7 seconds) enabled us to separate cue-period activation from the event-related NO-GO activation. Two separate cue-period regressors were identified, one for cue periods that preceded successful inhibitions and one for cue periods that preceded commission errors. Here, we will discuss activations associated only with correct inhibitions and the cue periods that preceded them.
Assessment of Prefrontal and Midline Interactions
The intra-individual analyses were restricted to the cue periods prior to correct inhibitions and the correct inhibitions themselves. As described below, the initial regression analysis identified bilateral activation in dorsolateral PFC during the cue period prior to an inhibition (see Figure 1 and Hester, 2004b). These activated areas provided functionally-defined regions for subsequent analyses. For each participant, we categorized activation in the left dorsolateral PFC region during the cue period as either high or low based on a split-half comparison of the mean activity levels for all cue periods prior to a correct inhibition for that participant. Trials during which there was greater activation during the cue period in left dorsolateral PFC were categorized as high control cue periods whereas trials which displayed lower activation during the cue were classified as low control cue periods. Based on this ranking the subsequent event-related successful inhibitions were then categorized as high or low control events. That is, successful inhibitions (STOPS) that followed cue periods with relatively high activation in left dorsolateral PFC were denoted high control STOPS. Conversely, the STOPS that followed cue periods with relatively low activation in left dorsolateral PFC were denoted low control STOPS.
Figure 1.

Areas activated during cue periods prior to a correct response. Activated areas include pre-SMA (A, Talairach: x = 2, y = 10, z = 46), right (B, 41, 14, 27) and left (C, -28, -7, 48) dorsolateral PFC as well as left parietal, occipital and right temporal areas.
Although the relationship between fMRI activation and prefrontal efficiency is not unambiguous (e.g., does greater activation reflect more control or more inefficient control) greater activation has consistently been associated with better performance for response preparation (Sakai & Passingham, 2003; Hester et al., 2004b; Fassbender et al., 2006). When subjects are given the opportunity to prepare an up-coming response, activation is usually noted in task-appropriate areas (Fassbender et al., 2006). In addition, when subsequent correct responses are examined, activation to cued correct responses is usually greater than un-cued correct responses (Hester et al., 2004b). Moreover, trials exhibiting the greatest degree of post-error behavioural adjustment were also associated with increased activity in dorsolateral PFC (Garavan et al., 2002b). Overall therefore, more activation in PFC might be taken as indicative of greater preparedness for an up-coming response, or greater levels of attentional control.
A new multiple regression analysis calculated event-related activity associated with the separate high control and low control STOP regressors. This analysis included all the same regressors as the initial general linear model (GLM) with the single change being that the previous event-related regressor for successful cued STOPs was separated into two new regressors, one for low control STOPs and one for high control STOPs (see Figure 2).
Figure 2.

Method of defining high and low control STOP events. A. represents the regressor for cued successful STOPs during the initial analysis. As shown in B., activations during the cue period in left dorsolateral PFC were divided into low activations, or low control cue periods (represented by the green curve) and high activations, or high control cue periods (represented by the blue curve). Successful STOPs from the original regressor (A) were then classified as high or low control STOPs based upon the cue period immediately preceding them, as shown in B. Therefore, the blue arrows represent STOPs that were preceded by high control cue periods and are high control STOPs, whereas the green arrows represent STOPs that were preceded by low control cue periods and are low control STOPs.
A non-linear regression program determined the best-fitting gamma-variate function for the impulse response functions (Cohen, 1997; Murphy & Garavan, 2005). The area under the curve of this gamma-variate function was expressed as a percentage of the area under the baseline, with the baseline representing the ongoing tonic or GO-trial task-related activity. Percentage area under the curve (event-related activation) and percentage change score (cue-period activation) maps were then warped into standard Talairach space (Talairach & Tournoux, 1988) and spatially blurred using a 3 mm isotropic root mean square Gaussian blur. Statistical t-tests against the null hypothesis of no percentage activation change were performed separately for each of the event-related (successful STOP) and block periods (cue period prior to successful STOP) of interest, with a voxel-wise threshold of p ≤ 0.001 (t = 4.14) and a clustersize criterion of 142 μl, which resulted in a 5% probability (corrected) of an activation cluster exceeding the imposed threshold by chance. This produced separate activation maps for the high and low control STOPS. These thresholded activation maps were then combined such that a voxel was included if it was significant in either map (i.e., a union of the two significant activation maps), resulting in one STOP activation map. Mean activation was then calculated for each of the resulting functionally defined regions. Finally, to assess the specific importance of left dorsolateral PFC in this type of attentional control, identical analyses were performed based on cue-period activation in the right dorsolateral PFC.
Results
Performance
Cues improved performance (20% NO-GO commission errors with cues, 40% without cues; t(14)=4.155, p<0.001) and slowed reaction time during the cue period when measured relative to comparable periods prior to uncued NO-GO trials (370 ms vs. 340 ms; t(14)=4.155, p<0.001).
Cue and STOP-related Activation
A number of areas, including pre-SMA (activation was superior to the cingulate gyrus and anterior to the anterior commissure (Picard & Strick, 1996), left and right dorsolateral PFC (see Figure 1 for areas and their coordinates), were activated during the cue periods preceding STOPS. The event-related analyses revealed activation in a number of areas including bilateral activation of middle frontal gyrus, inferior parietal lobule, middle temporal gyrus, thalamus and right insula for cued and uncued STOPs. Although there was substantial overlap between activation maps for cued and uncued STOPs, pairwise t-tests revealed a general pattern wherein cues increased STOP-related activity (see Hester et al., 2004b).
Intra-Individual Analysis
The high and low control STOP analysis, based on the left dorsolateral PFC categorization of cue periods, revealed two midline activations, one in the pre-SMA extending into SMA and one in the SMA proper (Figure 2Ai). There was significantly lower activation in the pre-SMA for high relative to low control STOPS (t(15)= 2.28, p<0.04), the expected pattern if higher levels of control lead to reduced levels of response conflict (Botvinick et al., 2001). Activation in the SMA region did not differ between high and low control STOPs. The comparable analysis based on the right dorsolateral PFC cue-period categorization revealed an activated region in ACC (Figure 2Bi) but this activation did not differ between high and low control STOPS.
Although there was no above threshold activation in the ACC for the left hemisphere split, we were interested in examining any possible relationship between ACC and PFC due to the importance given to the ACC by previous findings and theory (Botvinick et al., 1999; Botvinick et al., 2001). Thus, the voxelwise threshold for the STOP activation map was lowered to p < 0.005, revealing two ACC regions (Figure 2Aii). These ACC regions did not differ between low and high control STOPS. To test for regional dissociations we combined the two left hemisphere categorization maps (the original map revealing regions in pre-SMA and SMA and the lower threshold map revealing two ACC regions). A 2 (high vs. low control) × 2 (pre-SMA vs. ACC) ANOVA was performed for each of the two ACC regions. As shown in Figure 4A, both Region and Region × Control interactions were significant for both ANOVAs (Figure 4A Rostral ACC: Region F(1, 14) = 18.98, p < 0.001; Region × Control F(1, 14) = 4.95, p < 0.04. Figure 4A Caudal ACC: Region F(1, 14) = 7.48, p < 0.02; Region × Control F(1, 14) = 8.5, p < 0.01). Newman-Keuls post-hoc tests revealed that for the first comparison the high-low control effect was present in only the pre-SMA (pre-SMA low vs pre-SMA high, p < 0.006) and for both comparisons pre-SMA activation in the low control condition was greater than ACC activation in both the low and high control conditions (Rostral ACC: pre-SMA low vs ACC low, p < 0.002; pre-SMA low vs ACC high, p < 0.004; Caudal ACC: pre-SMA low vs ACC low, p < 0.007; pre-SMA low vs ACC high, p < 0.04).
Figure 4.

A: Mean activation in pre-SMA, rostral ACC and dorsal ACC for high and low control events as defined by the left dorsolateral PFC. B: Mean activation in ACC and rostral SMA and caudal SMA for high and low control events defined by the right dorsolateral PFC.
Lowering the threshold for the right hemisphere split map revealed two additional midline areas, both in SMA, (Figure 2Bii). High control STOPS produced significantly greater activation in the more caudal region only (t(15)=-2.84, p<0.01). As above, we combined the two right hemisphere categorization maps. A 2 (high vs. low control) × 2 (ACC vs. SMA) ANOVA was performed for each of the two SMA regions (Figure 3B). In the more rostral SMA region, there was a main effect of region with the SMA being more active than the ACC (Figure 3B: F(1,14)=8.97, p<0.01) but there was no interaction. Conversely, only the Region × Control interaction was significant for the more caudal SMA region (Figure 3B: F(1, 14)=11.29, p<0.005) driven by greater activity in the SMA for high relative to low control STOPS as mentioned above.
Figure 3.

Correct inhibition activations from the left dorsolateral PFC split (A (i): pre-SMA (0, 1, 58), SMA (1, -11, 59) and (ii): rostral ACC (-2, 30, 28), caudal ACC (1, 13, 26)) and from the right dorsolateral PFC split (B (i): ACC (-2, 31, 26) and (ii): rostral SMA (1, -3, 60), caudal SMA (1, -18, 65)). Areas in which activation differed significantly between high and low control conditions are displayed in green.
Discussion
These results support the theory that lateral PFC and midline regions work in concert in implementing cognitive control. Using a GO/NO-GO task we demonstrate that increased activity in lateral PFC results in a decrease in conflict-related activity in pre-SMA on a trial-for-trial, within-subjects basis. The results show that trials that were preceded by cue periods of relatively high left prefrontal activation, indicative of high levels of control, displayed lower amounts of conflict-related activation than those that were preceded by low control periods. Moreover, these interactions were observed for the pre-SMA and not the ACC (Botvinick et al., 1999; Cohen et al., 2000), consistent with a conflict-error distinction between these two areas (Ullsperger & von Cramon, 2001; Hester et al., 2004a).
It is interesting to note that this study did not find any support for the involvement of ACC in cognitive control during conflict trials in this task. Our original manuscript utilizing this same data set (Hester et al, 2004b), demonstrated robust error-related activity in ACC to errors (see Figure 5). Here, we found no evidence for a conflict role of the ACC, even at a more liberal threshold. Although pre-SMA rather than ACC involvement in response-conflict has been a consistent finding from our previous studies (Garavan et al., 2002a; Garavan et al., 2002b; Garavan et al., 2003; Fassbender et al., 2004; Hester et al., 2004a), a review of medial PFC involvement in performance monitoring neither supported nor negated an anatomical dissociation between error detection and conflict monitoring (Ridderinkhof et al., 2004). One interesting observation made in this review was that activations associated with pre-response conflict tended to be located more often in dorsal/caudal ACC extending into Brodmann areas 8 and even 6. It may be that studies which involve strong prepotent response tendencies that invoke large degrees of response conflict, such as the GO/NOGO tasks often utilized in our studies, may result in stronger activity in motor-related areas such as the pre-SMA. Response conflict on GO/NO-GO tasks between the prepotent GO responses and the unpredictable requirement to withhold responding upon presentation of the NO-GO stimulus has been suggested in a number of studies in humans (Braver et al., 2001; Jones et al., 2002; Garavan et al., 2003; Nieuwenhuis et al., 2003) and primates (Stuphorn et al., 2000). More cognitive or “higher-order” conflicts related to negative feedback or post-response conflict, which involve recognition that an incorrect response has just been made, may not trigger such a strong response in motor-related areas.
Figure 5.
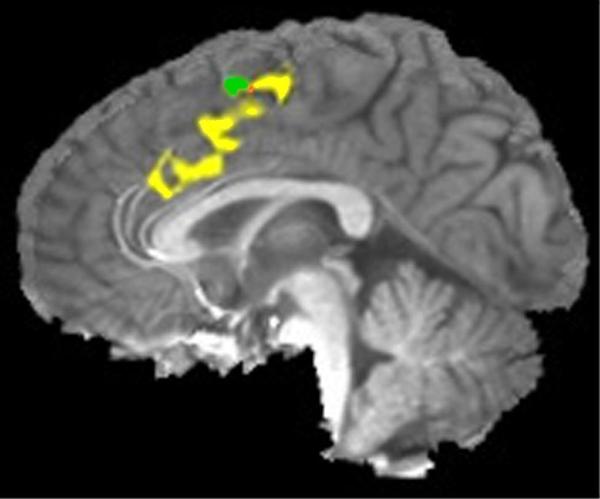
An area activated during errors in this task (from Hester et al, 2004b), including ACC extending into dorsal ACC, is represented in yellow. Pre-SMA, implicated in response-conflict monitoring in this study, is displayed in green. Orange represents the small area of overlap in pre-SMA between the two clusters. We found no evidence for any conflict-related activity in ACC, even at a liberal threshold.
The maintenance of task goals and rules in working memory is an important aspect of task execution and problem solving. Dorsolateral PFC has been implicated in these working memory processes and, more specifically, a number of studies have suggested that the maintenance of representations or task set is subserved by left lateral PFC (Frith & Dolan, 1996; MacDonald et al., 2000; Ruchsow et al., 2002; Garavan et al., 2002b). Similarly, Ruchsow et al. (2002) noted left prefrontal activation associated with negative feedback and suggested that it may have reflected an adjustment of rules or strategy following an error. While an association between left lateral PFC and task-set maintenance has been previously reported, the left lateral PFC region that we observed in this task was quite caudal extending into the premotor area suggesting that this activity may code for the upcoming motor inhibition (Pochon et al., 2001; Schubotz & von Cramon., 2002a). Schubotz and von Cramon (2002a; 2002b) have suggested that lateral premotor cortex is involved not only in the execution of complex motor schemes but also in planning to carry them out. Brass and von Cramon (2002; 2004) also found a very posterior portion of left dorsolateral PFC, the inferior frontal junction, to be involved in task preparation.
It is worth noting that our results reveal only that an increase in activity in lateral PFC was followed by in a decrease in subsequent conflict-related activity. PFC could feasibly have exerted an indirect influence on pre-SMA resulting in decreased levels of conflict. It is possible that some other prefrontal operation during the cue period resulted in this reduced conflict-related activity. A recent study suggests that dorsolateral and medial PFC are involved in dynamic adjustments in speed-accuracy trade-offs (van, Veen et al 2008) and these dynamic adjustments are likely to be related to the interactions reported here. However, we believe that adjustments in speed or accuracy do not adequately account for the pattern of results in the present study. Van Veen and colleagues suggest that dorsolateral PFC increases baseline activity in medial PFC under conditions where speed is stressed over accuracy whereas increased activity in dorsolateral PFC was associated with slower responding and increased accuracy in our paradigm (Hester et al, 2004b). Furthermore, whereas van Veen et al report an increase in sustained levels of activity in a broad network of regions including bilateral dorsolateral PFC and the medial wall of PFC when speed is emphasized, our data suggest a dissociable effect of top-down control on medial PFC; We find that left, but not right lateral PFC correlates with activity in the pre-SMA but not the ACC. Given the lateral PFC's involvement in task set maintenance, task and motor preparation and response correction, we argue that our results are supportive of the hypothesis that PFC and midline regions work together to implement cognitive control.
In contrast to the inverse relationship between left dorsolateral PFC and pre-SMA, greater cue-period right dorsolateral PFC activation was associated with greater SMA activity. Previously, we have observed SMA involvement on both GO and NO-GO trials whereas pre-SMA activity was restricted to inhibitions (Garavan, 1999). Perhaps, whereas greater left prefrontal control reduces pre-SMA conflict-related activity, greater preparation in right PFC, which previous data suggest is central to response inhibition (Kawashima et al., 1996; Garavan et al., 1999; de Zubicaray et al., 2000), yields increased motor inhibition-related activity in the SMA. This pattern of results suggests quite distinct functional roles for the pre-SMA and SMA proper.
Conclusion
These results demonstrate that it is possible to observe the interactions of distinct cortical areas, performing different functions in an interactive, dynamic way in the service of smooth behavioural control. The results illuminate how top-down, attentional resources that implement cognitive control might reduce bottom-up, stimulus driven conflict.
Acknowledgements
This research was supported by USPHS grants DA14100, GCRC M01 RR00058, NIMH grants MH63434, MH65350 and the Irish Research Council for the Humanities and Social Sciences.
Abbreviations
- ACC
anterior cingulate cortex
- PFC
prefrontal cortex
- SMA
supplementary motor area
Reference List
- Badre D, Wagner A. Selection, integration, and conflict monitoring: Assessing the nature and generality of prefrontal cognitive control mechanisms. Neuron. 2004;41:473–487. doi: 10.1016/s0896-6273(03)00851-1. [DOI] [PubMed] [Google Scholar]
- Botvinick M, Nystrom LE, Fissell K, Carter CS, Cohen JD. Conflict monitoring versus selection-for-action in anterior cingulate cortex. Nature. 1999;402:179–81. doi: 10.1038/46035. [DOI] [PubMed] [Google Scholar]
- Botvinick MM, Braver TS, Barch DM, Carter CS, Cohen JD. Conflict monitoring and cognitive control. Psychol Rev. 2001;108:624–52. doi: 10.1037/0033-295x.108.3.624. [DOI] [PubMed] [Google Scholar]
- Brass M, von Cramon DY. The role of the frontal cortex in task preparation. Cereb Cortex. 2002;12:908–14. doi: 10.1093/cercor/12.9.908. [DOI] [PubMed] [Google Scholar]
- Brass M, von Cramon DY. Decomposing components of task preparation with functional magnetic resonance imaging. Journal of Cognitive Neuroscience. 2004;16:609–620. doi: 10.1162/089892904323057335. [DOI] [PubMed] [Google Scholar]
- Braver TS, Barch DM, Gray JR, Molfese DL, Snyder A. Anterior cingulate cortex and response conflict: effects of frequency, inhibition and errors. Cereb Cortex. 2001;11:825–36. doi: 10.1093/cercor/11.9.825. [DOI] [PubMed] [Google Scholar]
- Brown JW, Braver TS. Learned predictions of error likelihood in the anterior cingulate cortex. Science. 2005;307:1118–1121. doi: 10.1126/science.1105783. [DOI] [PubMed] [Google Scholar]
- Carter CS, Braver TS, Barch DM, Botvinick MM, Noll D, Cohen JD. Anterior cingulate cortex, error detection, and the online monitoring of performance. Science. 1998;280:747–9. doi: 10.1126/science.280.5364.747. [DOI] [PubMed] [Google Scholar]
- Cohen JD, Botvinick M, Carter CS. Anterior cingulate and prefrontal cortex: who's in control? Nat Neurosci. 2000;3:421–3. doi: 10.1038/74783. [DOI] [PubMed] [Google Scholar]
- Cohen MS. Parametric analysis of fMRI data using linear systems methods. Neuroimage. 1997;6:93–103. doi: 10.1006/nimg.1997.0278. [DOI] [PubMed] [Google Scholar]
- Cox RW. AFNI: software for analysis and visualization of functional magnetic resonance neuroimages. Comput Biomed Res. 1996;29:162–73. doi: 10.1006/cbmr.1996.0014. [DOI] [PubMed] [Google Scholar]
- de Zubicaray GI, Andrew C, Zelaya FO, Williams SC, Dumanoir C. Motor response suppression and the prepotent tendency to respond: a parametric fMRI study. Neuropsychologia. 2000;38:1280–91. doi: 10.1016/s0028-3932(00)00033-6. [DOI] [PubMed] [Google Scholar]
- Fassbender C, Foxe JJ, Garavan H. Mapping the functional anatomy of task preparation: priming task-appropriate brain networks. Hum Brain Mapp. 2006;27:819–827. doi: 10.1002/hbm.20223. [DOI] [PMC free article] [PubMed] [Google Scholar]
- Fassbender C, Murphy K, Foxe JJ, Wylie GR, Javitt DC, Robertson IH, Garavan H. A topography of executive functions and their interactions revealed by functional magnetic resonance imaging. Brain Res.Cogn Brain Res. 2004;20:132–143. doi: 10.1016/j.cogbrainres.2004.02.007. [DOI] [PubMed] [Google Scholar]
- Fincham JM, Anderson JR. Distinct roles of the anterior cingulate and prefrontal cortex in the acquisition and performance of a cognitive skill. Proc.Natl.Acad.Sci.U.S.A. 2006;103:12941–12946. doi: 10.1073/pnas.0605493103. [DOI] [PMC free article] [PubMed] [Google Scholar]
- Frith C, Dolan R. The role of the prefrontal cortex in higher cognitive functions. Brain Res Cogn Brain Res. 1996;5:175–81. doi: 10.1016/s0926-6410(96)00054-7. [DOI] [PubMed] [Google Scholar]
- Garavan H, Ross TJ, Kaufman J, Stein EA. Neuroanatomical dissociation of response conflict from error detection using Event-Related fMRI; Japan. 2002a. p. S1071. [Google Scholar]
- Garavan H, Ross TJ, Kaufman J, Stein EA. A midline dissociation between error-processing and response-conflict monitoring. Neuroimage. 2003;20:1132–9. doi: 10.1016/S1053-8119(03)00334-3. [DOI] [PubMed] [Google Scholar]
- Garavan H, Ross TJ, Murphy K, Roche RA, Stein EA. Dissociable executive functions in the dynamic control of behavior: inhibition, error detection, and correction. Neuroimage. 2002b;17:1820–9. doi: 10.1006/nimg.2002.1326. [DOI] [PubMed] [Google Scholar]
- Garavan H, Ross TJ, Stein EA. Right hemispheric dominance of inhibitory control: an event-related functional MRI study. Proc Natl Acad Sci U S A. 1999;96:8301–8306. doi: 10.1073/pnas.96.14.8301. [DOI] [PMC free article] [PubMed] [Google Scholar]
- Hester R, Fassbender C, Garavan H. Individual differences in error processing: a review and reanalysis of three event-related fMRI studies using the GO/NOGO task. Cereb.Cortex. 2004a;14:986–994. doi: 10.1093/cercor/bhh059. [DOI] [PubMed] [Google Scholar]
- Hester R, Murphy K, Foxe JJ, Foxe DM, Javitt DC, Garavan H. Predicting success: Patterns of cortical activation and deactivation prior to response inhibition. Journal of Cognitive Neuroscience. 2004b;16:776–785. doi: 10.1162/089892904970726. [DOI] [PubMed] [Google Scholar]
- Jones AD, Cho RY, Nystrom LE, Cohen JD, Braver TS. A computational model of anterior cingulate function in speeded response tasks: effects of frequency, sequence, and conflict. Cogn Affect Behav Neurosci. 2002;2:300–17. doi: 10.3758/cabn.2.4.300. [DOI] [PubMed] [Google Scholar]
- Kawashima R, Satoh K, Itoh H, Ono S, Furumoto S, Gotoh R, Koyama M, Yoshioka S, Takahashi T, Takahashi K, Yanagisawa T, Fukuda H. Functional anatomy of GO/NO-GO discrimination and response selection--a PET study in man. Brain Res. 1996;728:79–89. [PubMed] [Google Scholar]
- MacDonald AW, Cohen JD, Stenger VA, Carter CS. Dissociating the role of the dorsolateral prefrontal and anterior cingulate cortex in cognitive control. Science. 2000;288:1835–8. doi: 10.1126/science.288.5472.1835. [DOI] [PubMed] [Google Scholar]
- Magno E, Foxe JJ, Molholm S, Robertson IH, Garavan H. The anterior cingulate and error avoidance. J.Neurosci. 2006;26:4769–4773. doi: 10.1523/JNEUROSCI.0369-06.2006. [DOI] [PMC free article] [PubMed] [Google Scholar]
- Miller BT, D'Esposito M. Searching for “the top” in top-down control. Neuron. 2005;48:535–538. doi: 10.1016/j.neuron.2005.11.002. [DOI] [PubMed] [Google Scholar]
- Murphy K, Garavan H. Deriving the optimal number of events for an event-related fMRI study based on the spatial extent of activation. Neuroimage. 2005;27:771–777. doi: 10.1016/j.neuroimage.2005.05.007. [DOI] [PubMed] [Google Scholar]
- Nieuwenhuis S, Yeung N, van den Wildenberg W, Ridderinkhof KR. Electrophysiological correlates of anterior cingulate function in a go/no-go task: effects of response conflict and trial type frequency. Cogn Affect Behav Neurosci. 2003;3:17–26. doi: 10.3758/cabn.3.1.17. [DOI] [PubMed] [Google Scholar]
- Picard N, Strick PL. Motor areas of the medial wall: a review of their location and functional activation. Cereb Cortex. 1996;6:342–53. doi: 10.1093/cercor/6.3.342. [DOI] [PubMed] [Google Scholar]
- Pochon JB, Levy R, Poline JB, Crozier S, Lehericy S, Pillon B, Deweer B, Le Bihan D, Dubois B. The role of dorsolateral prefrontal cortex in the preparation of forthcoming actions: an fMRI study. Cereb Cortex. 2001;11:260–6. doi: 10.1093/cercor/11.3.260. [DOI] [PubMed] [Google Scholar]
- Ridderinkhof KR, Ullsperger M, Crone EA, Nieuwenhuis S. The role of the medial frontal cortex in cognitive control. Science. 2004;306:443–447. doi: 10.1126/science.1100301. [DOI] [PubMed] [Google Scholar]
- Ruchsow M, Grothe J, Spitzer M, Kiefer M. Human anterior cingulate cortex is activated by negative feedback: evidence from event-related potentials in a guessing task. Neurosci Lett. 2002;325:203–6. doi: 10.1016/s0304-3940(02)00288-4. [DOI] [PubMed] [Google Scholar]
- Sakai K, Passingham RE. Prefrontal interactions reflect future task operations. Nat Neurosci. 2003;6:75–81. doi: 10.1038/nn987. [DOI] [PubMed] [Google Scholar]
- Schubotz RI, von Cramon DY. A blueprint for target motion: fMRI reveals perceived sequential complexity to modulate premotor cortex. Neuroimage. 2002a;16:920–35. doi: 10.1006/nimg.2002.1183. [DOI] [PubMed] [Google Scholar]
- Schubotz RI, von Cramon DY. Predicting perceptual events activates corresponding motor schemes in lateral premotor cortex: an fMRI study. Neuroimage. 2002b;15:787–96. doi: 10.1006/nimg.2001.1043. [DOI] [PubMed] [Google Scholar]
- Stuphorn V, Taylor TL, Schall JD. Performance monitoring by the supplementary eye field. Nature. 2000;408:857–60. doi: 10.1038/35048576. [DOI] [PubMed] [Google Scholar]
- Talairach J, Tournoux P. Co-planar Stereotaxic Atlas of the Human Brain. Thieme; New York: 1988. [Google Scholar]
- Ullsperger M, von Cramon DY. Subprocesses of performance monitoring: a dissociation of error processing and response competition revealed by event-related fMRI and ERPs. Neuroimage. 2001;14:1387–401. doi: 10.1006/nimg.2001.0935. [DOI] [PubMed] [Google Scholar]
- van,Veen V, Krug MK, Carter CS. The Neural and Computational Basis of Controlled Speed-Accuracy Tradeoff during Task Performance. J.Cogn Neurosci. 2008 doi: 10.1162/jocn.2008.20146. [DOI] [PubMed] [Google Scholar]