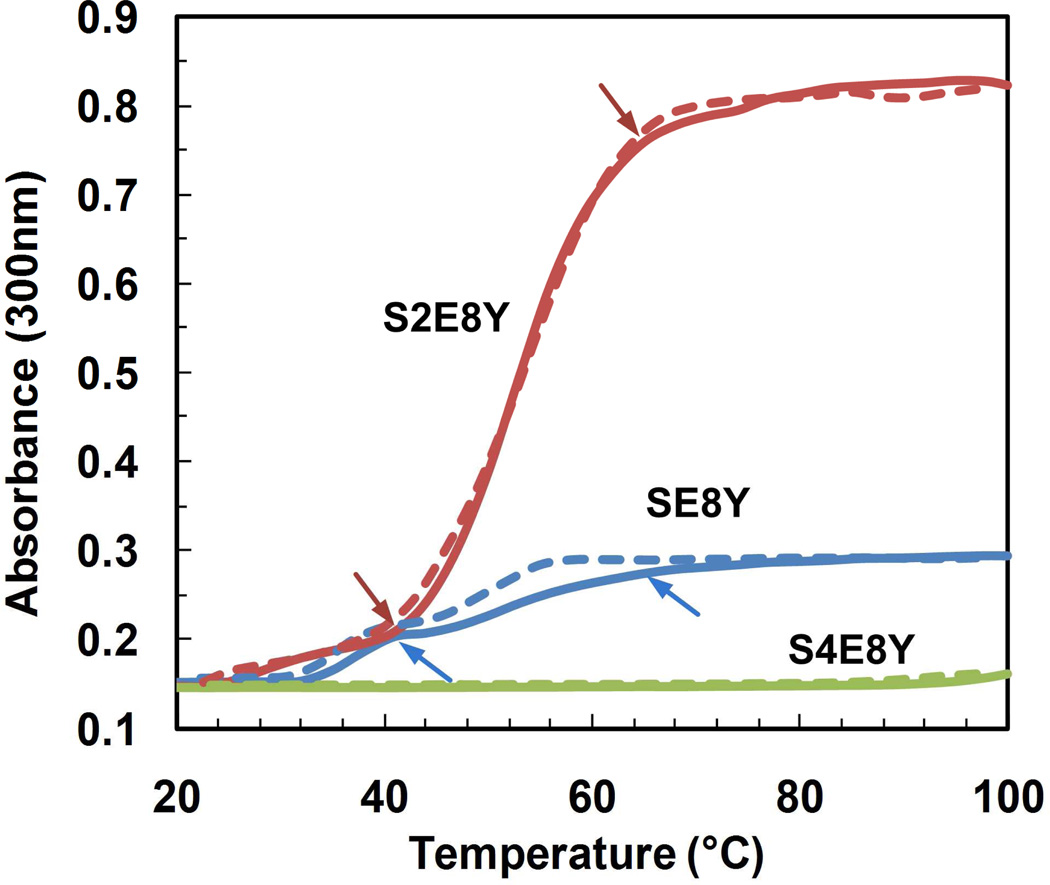
Figure 3.
Turbidity profiles of the silk-elastin-like protein solutions at 0.5 mg/mL as a function of temperature. Turbidity profiles were obtained by monitoring optical density at 300 nm as the aqueous solutions were heated (solid lines) and cooled (dash lines) at a rate of 3°C/min. Arrows indicate the locations of the transition.

