

Abstract
A recently introduced technique for pathogen recognition called BARDOT (BActeria Rapid Detection using Optical scattering Technology) belongs to the broad class of optical sensors and relies on forward-scatter phenotyping (FSP). The specificity of FSP derives from the morphological information that bacterial material encodes on a coherent optical wavefront passing through the colony. The system collects elastically scattered light patterns that, given a constant environment, are unique to each bacterial species and serovar. The notable similarity between FSP technology and spectroscopies is their reliance on statistical machine learning to perform recognition. Currently used methods utilize traditional supervised techniques which assume completeness of training libraries. However, this restrictive assumption is known to be false for most experimental conditions, resulting in unsatisfactory levels of accuracy, poor specificity, and consequently limited overall performance for biodetection and classification tasks. The presented work demonstrates application of the BARDOT system to classify bacteria belonging to the Salmonella class in a nonexhaustive framework, that is, without full knowledge about all the possible classes that can be encountered. Our study uses a Bayesian approach to learning with a nonexhaustive training dataset to allow for the automated detection of unknown bacterial classes.
1 Introduction
Recently a number of new label-free biosensors have been reported in the literature [1, 2, 3]. These tools are label-free in the sense that they do not employ fluorescence labels, but use alternative detection modalities such as surface plasmon resonance, amperometric and potentiometric measurements, or electrochemical impedance spectroscopy. However, these biosensors still utilize traditional biological recognition elements: enzymes, antibodies, and nucleic acids. The only well researched and broadly utilized techniques capable of true reagentless fingerprinting of bacteria are vibrational spectroscopic methods (Raman and IR) [4, 5, 6, 7, 8], autofluorescence-based observations [9, 10], MALDI-TOF-based systems [11, 12, 13], and light-scatter analysis [14, 15, 16, 17].
Light scatter–based methods provide an interesting alternative to vibrational spectroscopies because they not only allow for a true label-free and reagentless measurement capability, but also rely on quantitative description of optical properties of the microorganisms rather than on their chemical composition. The BARDOT (BActeria Rapid Detection using Optical scattering Technology) system developed at Purdue University is a new optical sensor for detection and identification of colonies of multiple pathogens that has shown great promise for distinguishing bacterial cultures at the genus, species, and strain level for Listeria, Staphylococcus, Salmonella, Vibrio, and E. coli [18, 19, 20]. The BARDOT method uses the unique patterns formed by laser light scattering from bacterial colonies to detect and classify pathogens (See Figure 1).
Figure 1.
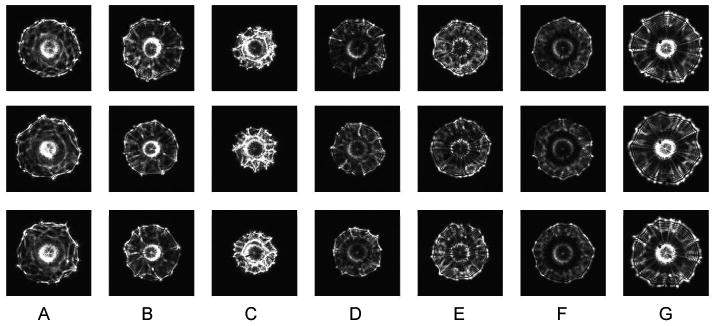
Examples of scatter patterns formed by scattering of a laser beam from colonies formed by different Salmonella serotypes: (A) Agona, (B) Cholerasuis, (C) Indiana, (D) Kentucky, (E) Schottmuelleri, (F) Tennessee, (G) Typhimurium (Copenhagen).
In some aspects the approach to detection and classification performed by BARDOT is conceptually similar to procedures used in spectroscopic techniques. BARDOT relies on pattern recognition and machine learning to evaluate colonies, and on the basis of this information to recognize organisms belonging to specific classes. Spectroscopic systems use chemometrics, which is fundamentally a specialized machine-learning toolkit optimized for classification of spectral datasets representing various classes of bacteria.
One presumable yet mostly unrealized advantage of reagentless, label-free classification technologies based on phenotypic recognition of bacteria is the fact that they can potentially recognize and classify bacterial species or strains for which there are no available antibodies or genetic markers. In order to achieve that, the classifier would have to be retrained with a new set of “fingerprints” describing the new emerging pathogens. However, reliance on machine learning and multivariate statistical analysis is also a weak point of BARDOT-, IR-, or Raman-based technologies. These systems use knowledge automatically discovered from pre-tested and pre-labeled samples through a supervised learning, which is de facto a process of developing predictive models using a library of known samples. Therefore, the predictive performance of these classifiers depends to a great extent on the quality of the training libraries. Unfortunately, the quality of training libraries for any label-free biodetection system is potentially limited in a number of ways.
The most important limitation of standard training libraries is that only the most prevalent classes of bacteria are available, as it is impractical to assume the presence of all the classes in all tested samples. Additionally, the presence of background bacterial flora makes the task of dynamic learning and class expansion really unattainable. The sheer number of pathogenic classes would not allow for a practical and manageable training. Additionally, bacteria are characterized by a high mutation rate, which can influence their pathogenicity. More specifically, a bacterial serovar may go through a mutation to form a new pathogenic serovar. New emerging pathogens may also be rapidly introduced to a geographical area. Therefore, any training library representing a set of bacterial classes is inherently nonexhaustive, and collecting a fully exhaustive library would impossible. However, classifying pathogenic bacteria from an unknown class as nonpathogenic would have disastrous consequences.
The outlined problem could be alleviated if the analysis strategy employed by phenotypic recognition systems like BARDOT allowed for novelty detection (i.e., automated detection of unknown serotypes) simultaneously with the process of classification. If a novelty detection procedure were successfully implemented, BARDOT methodology would be capable of raising an alarm when a new serotype was detected in tested samples.
In [21], we defined the nonexhaustive learning problem and proposed for the first time a Bayesian approach based on maximum likelihood evaluation of real and simulated classes for new samples. In this method, all classes (known and unknown) were assumed to have Gaussian distributions with a common covariance matrix. A prior was defined over the mean vectors of the classes and its parameters were estimated using samples of the known classes. A large number of samples was generated from the prior to simulate the space of all classes. A new instance was classified using a maximum likelihood classifier and was considered a novelty if it was classified into one of the simulated classes. This attempt, although it looked promising, also had certain limitations. First, the common covariance assumption was quite restrictive. Second, the Gaussian prior defined for the mean vectors required a very large number of classes to be available in the training dataset to avoid numerical problems in estimating the parameters of the prior. Third, as the dimensionality increased, the number of simulated classes necessary to achieve higher specificities increased exponentially.
In this report, we use our new Bayesian approach based on Wishart priors for detecting samples of Salmonella belonging to unknown serotypes (i.e., serotypes not present in the training library). The utilized algorithm creates new classes on the fly and evaluates maximum likelihood with the updated set of classes, gradually improving detection accuracy for future samples. Our approach is tested with over 400 samples representing seven common serotypes of Salmonella. We demonstrate that novelty detection paired with automated classification is an attainable goal, and that label-free phenotypic methods such as laser scattering not only can be used to classify biological samples into previously known categories, but may also play a role as a autonomous detection system. We believe that the presented approach is applicable not just to BARDOT methodology, but that with minimal modification it can also be utilized to enhance other label-free biosensors such as IR or Raman spectroscopy.
2 Materials and Methods
2.1 Sample Preparation
The Salmonella enterica samples representing Agona, Cholerasuis, Indiana, Kentucky, Schottmuelleri, Tennessee, and Typhimurium (var. Copenhagen) serotypes were obtained from Dr. Bhunia's culture collection (Department of Food Science, Purdue University). Rappaport-Vassiliadis R10 (RV) broth and xylose lysine deoxycholate (XLD) agar were purchased from the Accumedia division of Neogen Corporation (Lansing, MI). RV broth is a nutrient broth selective for Salmonella. The XLD agar is also selective for Salmonella and inhibits growth of most other microorganisms. The Salmonella samples were cultured in RV broth for 12-18 hours at 37 °C. Cultures were then decimally diluted in 20 mM phosphate buffered saline. Dilutions were spread plated on XLD agar. The agar plates were incubated at 37 °C until the desired colony size of 1.3±0.2 mm was reached. In most cases, this took about 12 hours for all the tested Salmonella serotypes. Agar plates containing over 30 colonies of the appropriate size were analyzed with the BARDOT instrument.
2.2 Light-scattering instrumentation
The current implementation of BARDOT consists of three major components: colony counter/locator, forward-scattering measurement device, and 2-D motorized stage. The colony locator/counter is composed of a red laser equipped with a single-line projector (Lasiris 501L-635-5mW, Stocker Yale, Inc. Salem, NH), and a line-scanner (Hamamatsu 512 pixel, 25 μm pitch, and 2.5 mm length). The line scanner optics employs two cylindrical lenses (f=198 mm) and produces a laser line of 101.6 × 0.5 mm. The laser-line scan generates a 2-D transmission map of the agar plate that is subsequently processed to identify centers of all the colonies. The forward-scattering measurement device is composed of a laser diode module (Lasiris 501L-635-1mW) and a monochromatic CCD image sensor (Silicon Imaging SI1280 FM-CL, Silicon Imaging Inc., Costa Mesa, CA) with 1280 × 1024 resolution and 6.7 × 6.7-μm pixel size. Motion control is provided by a three-axis stepping motor (Velmex NEMA 17, Velmex, Bloomfield, NY). The controller and the pulse encoder (E2-400-197 IHT, US Digital, Vancouver, WA) communicate with an external CPU via an NI PCI-6602 board (National Instruments, Austin, TX).
2.3 Pattern preprocessing and feature extraction
The scatter patterns acquired using the sensor technology were represented as greyscale bitmaps. Over 430 randomly selected scatter patterns representing colonies belonging to tested samples were further processed to obtain numerical representation of the patterns.
The current implementation uses only a very simple normalization procedure to correct the signal intensity of the scatter images, but does not correct any spatial distortion introduced during the measurement process by improper laser positioning or off-axis illumination. After normalization the bitmaps were rescaled and squares of 300×300 pixels representing centers of the bitmaps were subjected to further analysis.
Two groups of features were used in this study: invariant orthogonal moments and Haralick texture features [22, 23, 24, 25]. Our current implementation of the classification system employs pseudo-Zernike moments (PZMs) [26, 27, 28], which were computed using pseudo-Zernike polynomials. The pseudo-Zernike polynomials are a set of orthogonal polynomials which have properties similar to those of Zernike polynomials. However, it has been shown that pseudo-Zernike moments are less sensitive to image noise than are conventional Zernike moments [29].
The 2-D pseudo-Zernike moment, Zpq, of order p with repetition q is defined using polar coordinates (r,θ) inside the unit circle as
| (1) |
where is the complex conjugate of the pseudo-Zernike polynomial Vpq(r, θ), which is given by Vpq(r, θ) = Rpq(r)ejqθ, where , , −1 < x,y < 1.
Here Rpq(r) is the real-valued radial polynomial defined as:
| (2) |
The pseudo-Zernike polynomials satisfy the following orthogonality property:
| (3) |
where δnm is the Kronecker symbol.
To compute the pseudo-Zernike moments of a given image, the center of the image is taken as the origin and pixel coordinates are mapped to the range of the unit circle. Rotational invariance is obtained by using the magnitudes of the pseudo-Zernike moments as features. The details of pseudo-Zernike moment computation can be found in our published reports [18, 20].
Another set of features was computed using gray-level co-occurrence matrices (GLCMs). The GLCMs are routinely employed to quantify the number of occurrences at various distances and angles of pixel intensity values with respect to each other [23, 24]. The GLCMs were used to extract 14 low- and high-frequency (depending on the pixel-to-pixel distance used in the co-occurrence matrix) texture properties (so-called Haralick texture features). We used the mean and the range of 12 of these 14 features.
Formally, the Haralick features can be described as follows: let image I have Nx pixels in the horizontal direction and Ny pixels in the vertical direction. Suppose also that there are Ng distinct gray-tone levels in the quantized (digital) image. Let Lx = 1,2,…,Nx be the horizontal spatial domain, Ly = 1,2,…,Ny be the vertical spatial domain, and G = 1,2,…,Ng be the set of Ng distinct gray levels (tones). The texture-context information in image I is contained in the overall or “average” spatial relationship that the gray tones in image I have with one another. More specifically, this texture-context information is adequately specified by the matrix of relative frequencies Pij with which two neighboring pixels separated by a distance d occur on the image, one with gray level i and the other with gray level j. Excluding the borders, a pixel has eight nearest-neighbor pixels (north, south, east, west, northwest, northeast, southwest, southeast). For angles quantized to 45° intervals, the un-normalized frequencies are defined by
| (4) |
where # denotes the number of elements in the set where the intensity level of a pixel pair changes from i to j, the location of the first pixel is (x1,y1) and that of the second pixel is (x2,y2), d is the distance between the pixel pair, and θ is the angle between the two pixels. A symmetric co-occurrence matrix can be computed by the expression P(i, j, d, θ)′ = (P(i, j, d, θ) + P(i, j, d, θ)T)/2. The probability estimates are obtained by dividing each entry in P(i, j, d, θ) by the sum of all possible intensity changes with the distance d and direction.
Note that only the distinct gray levels are used to build the P matrices. If the gray levels are in the range [0, 255] and all are used in the image, then P will be a 256-by-256 matrix [23, 24].
3 Results
3.1 Automated classification of Salmonella samples assuming exhaustiveness of the training library
One hundred and ninety features were extracted from every collected forward-scatter pattern. Examples of the Salmonella scatter patterns are shown in Figure 1. The extracted features were used directly for exploratory analysis of the acquired results. Figure 2 show principal component analysis (PCA), independent component analysis (ICA), and kernel PCA mapping of the data. Some clusters of data points are clearly identifiable on these plots. One of the obvious clusters corresponds to the Salmonella Indiana population, whereas the other well defined cluster contains colonies belonging to Salmonella Agona. The other serotypes are much more difficult to differentiate. This demonstrates a requirement for a supervised machine-learning approach, and shows that the unsupervised exploratory analysis can visualize easily discernible differences between some patterns only, whereas the remaining patterns cannot be easily separated.
Figure 2.
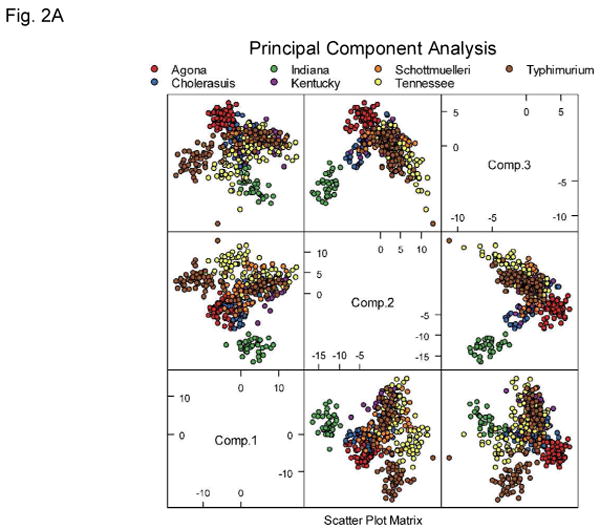
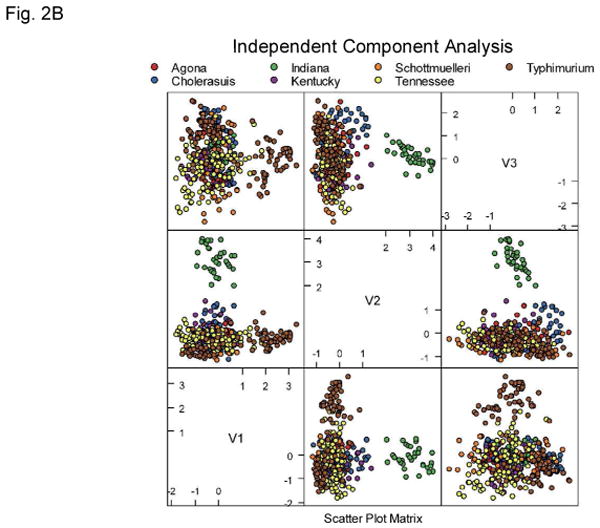
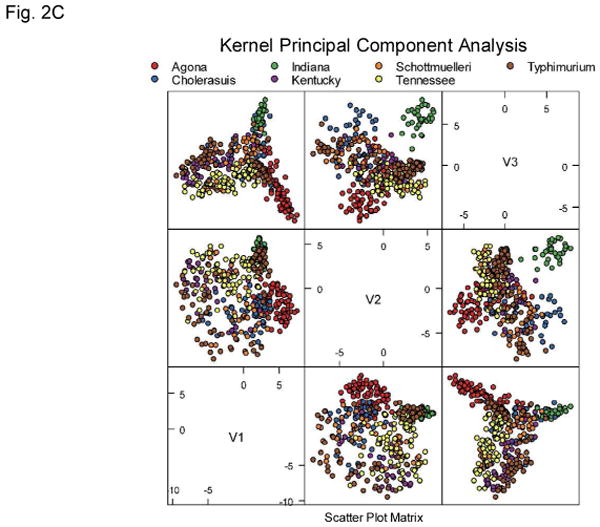
Principal component analysis (A), independent component analysis (B), and kernel principal component analysis (C) plots showing tested Salmonella dataset. Although the Agona and Indiana serotypes can be easily differentiated the remaining data points do not form distinguishable clusters.
In the next step, the experimental data were used to construct and cross-validate a supervised training system. The classifier operated in a single-instance fashion, meaning that it classified a single colony (rather than a plate or a sample) at a time. Three classifiers were evaluated: LDA, linear support vector machine (SVM), and an SVM with a Gaussian kernel. Ten-× cross-validation was used to assess the quality of the classifiers. The following measures of classification success for the best of the tested classifiers are reported in Table 1: sensitivity (true positive rate), specificity (1- false positive rate), accuracy, and AUC (area under the receiver operating characteristic curves for a binary classifier which classifies a given class as “positive” and all other classes as “negative”) [30]. The classifiers were trained assuming that every tested colony represents an independent instance. The implementation of the traditional supervised learning system was realized using R language for statistical computing. The e1071 package operating within the R environment and allowing access to the libsvm library was used for SVM-based classification [31, 32].
Table 1.
Number of training instances, sensitivity, specificity, accuracy, AUC, and standard deviation of AUC values for 10× cross-validation of the RBF-SVM classifier, computed for every classified serotype.
| Classified serotype | No. of training instances | Sensitivity | Specificity | Accuracy | AUC | AUC sd |
|---|---|---|---|---|---|---|
| Salmonella Agona | 76 | 0.9868 | 0.9972 | 0.9951 | 0.9997 | 0.000958 |
| Salmonella Cholerasuis | 49 | 0.8775 | 0.9843 | 0.9715 | 0.9950 | 0.008322 |
| Salmonella Indiana | 33 | 0.9697 | 1 | 0.9976 | 1 | 0 |
| Salmonella Kentucky | 41 | 0.8780 | 0.9872 | 0.9761 | 0.9793 | 0.046659 |
| Salmonella Schottmuelleri | 48 | 0.9167 | 0.9948 | 0.9855 | 0.9933 | 0.015494 |
| Salmonella Tennessee | 94 | 1 | 0.9881 | 0.9903 | 0.9994 | 0.001241 |
| Salmonella Typhimurium (Copenhagen) | 90 | 0.9444 | 0.9883 | 0.9785 | 0.9959 | 0.007536 |
All results so far were computed assuming full exhaustiveness of the available training libraries. In the next step this assumption is explicitly rejected, and the presented technique operates within a nonexhaustive framework.
3.2 Machine-learning approach to real-time detection of unknown serotypes
The presented system works in a multi-class setting and incorporates sequential evaluation of new samples in order to perform supervised classification and novelty detection. The main contribution of this work is the special family of conjugate priors defined over class distributions. This allows us to employ the prior information obtained from known classes to make inferences about unknown classes as well. Our approach extends the concept of novelty detection to set the stage for new class discovery. By identifying new classes of informational value and dynamically updating itself with these classes, the training dataset becomes more representative of the sample population. This results in a classifier with improved predictive performance for future samples. In this study, we evaluate our approach using a dataset consisting of seven strains of Salmonella. Extensive testing of the proposed approach on 28-class bacterial-detection and 26-class letter-recognition datasets were provided in [33], where the proposed approach was also compared against state of the art involving nonadaptive density-based approaches and support vector domain description, as well as a recently introduced Bayesian approach based on simulated classes.
3.2.1 Maximum likelihood detection
Our implementation of the outlined framework utilizes a density-based approach that uses class-conditional likelihoods of samples to detect unknown serotypes. Briefly, if the maximum of the class-conditional likelihoods is above a designated threshold, then the sample belongs to one of the classes in the training library (i.e., known serotypes) and is assigned the corresponding class label; otherwise the sample is identified as belonging to an unrepresented serotype, hence a novelty.
More formally, let Ω, Δ, and Γ denote the set of all, known, and unknown bacteria classes (in this case Salmonella serotypes), respectively, with Ω = Δ∪Γ; A, K, and M are their corresponding cardinalities with A = K + M. The decision that minimizes the Bayes risk under the 0/1 loss-function assumption assigns a new sample z to the class with the highest posterior probability:
| (5) |
where i = {1,…,A} and θi is the parameter of the conditional distribution associated with the class ωi. The classifier obtained by evaluating this decision rule is known as a maximum a posteriori classifier (MAP).
Using Bayes' rule the above decision rule can be rewritten as follows:
| (6) |
where fi(z∣θi) is the likelihood of z, π(θi) is the prior, and p(z) is the evidence. The evidence p(z) is the same for all classes, and hence can be removed from the above formulation. When all classes are assumed a priori likely, π(θi) can be dropped from (6) as well. This leaves us with the maximum likelihood (ML) decision function for classifying z:
| (7) |
where z is considered a novelty if ωi*∈Γ, and a sample of a known class if ωi∈Δ.
Since the set of classes is nonexhaustive fi(z∣θi) cannot be computed for all classes, and as a result the decision function in (7) cannot be evaluated explicitly. We can express (7) in terms of ωi* and rewrite it by separating fi(z∣θi) of known and unknown classes as
| (8) |
where ψ = max{i:ωi∈Δ} {fi (z∣θi)} and γ = max{i:ωi∈Γ} {fi (z∣θi)}.
Since no data are available for unknown classes, γ cannot be explicitly estimated. In our experiments we consider γ as a tuning parameter to optimize sensitivity at a desired specificity or vice versa. In other words, γ is the parameter allowing us to adjust for the required compromise between sensitivity and specificity of the classification system.
To summarize, if the conditional likelihood of a known class for a sample z is less than γ, then z is considered to be a sample from an unknown class (a serotype not present in the training library); otherwise z is a sample from one of the known classes (serotypes represented in the library) and thus can be assigned a known class label.
The most common and effective way to treat data of unknown nature is to assume Gaussian distributions for all classes: ωi ∼ N(μi, Σi), θi = {μi, Σi}.
With this assumption in place, (8) becomes
| (9) |
where gi(z) = log(|Σi|) + (z −μi)T Σi−1 (z − μi) is the negative log-likelihood of class ωi given z and |Σi| is the determinant of Σi For {i:ωi∈Δ}, μi and Σi can be estimated from class-conditional data available in the training set.
When dealing with datasets containing limited numbers of training samples and high dimensionality, the covariance estimator plays an important role in the modeling of the class-conditional distributions. The sample covariance can be obtained using the following formula:
| (10) |
where ni is the number of samples in class ωi, eni is a vector of ones of size ni, and μi are the mean vectors estimated as
| (11) |
Here for notational simplicity all samples belonging to class ωi are denoted in the matrix form as Xi = [xi1…xini].
3.2.2 Bayesian approach to covariance estimation
When the number of samples available for a given class is less than d + 1, where d is the dimensionality, the sample covariance becomes ill conditioned, i.e., the inverse does not exist. In practice, a robust sample covariance requires many more samples than d + 1 because the number of parameters to estimate in a covariance matrix increases as the square of the dimensionality. This phenomenon is known as the curse of dimensionality [34].
Although the research in covariance estimators using a limited number of samples with high dimensionality has a long history with relatively well-established techniques, two main approaches dominate the field. These are regularized discriminant analysis (RDA) [35] and empirical Bayes estimators [36]. RDA considers the mixture of sample and pooled covariance and an identity matrix as an estimator, with their weights empirically estimated by cross-validation. On the other hand, the Bayesian approach defines a pair of conjugate prior distributions over the sample and true covariance matrices, and uses the mean of the resulting posterior distribution as an estimator. In RDA, multiple samples from each class are required to estimate the mixing weights by cross-validation, and thus to estimate the covariance matrix, whereas in the Bayesian approach, the covariance estimator is a function of the parameters of the prior distribution, which are estimated using samples of the known classes.
Creating a new class for each detected novelty and defining the class by its mean and covariance matrix form the core component of the proposed approach. The Bayesian approach assumes a common prior for all classes (known and unknown) and estimates the covariance matrix using the posterior mean. In that regard, the use of the Bayesian approach makes intuitive sense in the nonexhaustive setting, mainly because we assume that there is a common pattern among the class distributions of all classes and that it can be captured with known classes only, provided that a sufficiently large number of them are available for training. Toward achieving this end, we use a special family of conjugate priors to estimate the covariance matrices of the class-conditional distributions.
The assumption of Gaussianity, i.e., ωi ∼N(μi, Σi), implies that the sample covariance matrices Si, i = {1,…,K}, where K is the number of known classes, are mutually independent with fiSi ∼ W(Σi, fi). Here fi=ni− 1 and W(Σi, fi) denotes the Wishart distribution with fi degrees of freedom and a parameter matrix Σi. The inverted Wishart distribution is conjugate to the Wishart distribution and thus provides a convenient prior for Σi.
We assume that Σi is distributed according to an inverted Wishart distribution with m degrees of freedom as
| (12) |
The scaling constant (m−d −1) before Ψ is chosen to satisfy E {Σi} = Ψ. Under this setting, the posterior distribution of Σi given {S1,…,SK}, is obtained as described in [37]:
| (13) |
The mean of this posterior distribution is
| (14) |
Under squared-error loss, the posterior mean is the Bayes estimator of Σi. The estimator is a weighted average of Si and Ψ; it shifts toward Si for large fi and approaches Ψ for large m. For a class with just one sample, the estimator returns Ψ, which implies that no matter what the dimensionality is, a nonsingular covariance estimate can be obtained using this estimator, provided that Ψ is nonsingular. The estimator is a function of Ψ and m, which are the parameters of the inverted Wishart prior for Σi. The closed-form estimates for Ψ and m do not exist. The study in [36] suggests estimating Ψ by the unbiased and consistent estimate Sp, i.e., the pooled covariance, and maximizing the marginal likelihood of Si for m > d +1 numerically to estimate m. In this study we set Ψ to Sp but estimate m to maximize the classification accuracy for the known classes by cross-validating over the training samples. Here, Sp is the pooled covariance matrix defined by
| (15) |
where N is the total number of samples available in the training dataset.
So far, we have presented our framework for detecting novelties in real time based on maximum likelihood (ML) evaluation of samples using known classes. Our approach employs a pair of conjugate Wishart priors to estimate the covariance matrices of known classes and detects novelties by thresholding the maximum likelihood evaluated with known classes. However, novelties (samples belonging to unknown serotypes) originate from classes of informational value that were not known at the time of training. Pooling novelties showing similar characteristics into individual clusters may potentially recover some of these classes, and as more classes of informational value are introduced, the training library becomes more representative. This helps improve the predictive performance of the system not only for detecting novelties but also for classifying future samples of newly discovered classes. Our algorithm, referred as BayesNoDe, combines the ability to perform novelty detection with new class discovery.
As formulated in (9), a new sample z∈ ℜd is detected as a novelty if min{i:ωi∈Δ} gi(z) > γ. In other words, if the negative log-likelihoods of known classes given z are all greater than the designated threshold γ, then the sample is considered a novelty, i.e., belongs to an a serotype not represented in the training library.
When a sample is detected as a novelty, a new class is generated and defined by the parameters (μ, Σ), where μ is the mean vector of this class and Σ is the covariance matrix, both of which are not known. With just one sample, since S is not defined and f = 0, the posterior mean in (14) is equivalent to Ψ and thus the Bayesian estimator for Σ becomes Σ̂ = Ψ. The mean vector μ is estimated by μ̂ = z, i.e., the sample itself, which follows from (11).
Subsequently, the set of known classes (serotypes) is augmented with this new class. Therefore, for the next sample available, the decision function in (9) is evaluated for classes known initially as well as for newly created classes. If the sample is detected as a novelty, the above procedure is repeated to generate another class. Otherwise, if the sample is classified into one of the existing classes, then the system looks for a class that minimizes the negative log-likelihood. If the sample is assigned to a previously discovered class, then the class parameters μ and Σ are updated using equations (11) and (14) for that class. Since there is more than one sample available now, Σ̂ becomes a mixture of the sample covariance and Ψ. If, on the other hand, the sample is assigned to a class known initially, then no class update is necessary.
4 Experimental demonstration of the detection/classification procedure
A total of 7 serotypes of Salmonella were considered in this study. Table I shows the list of 7 strains considered in this study together with the number of samples collected for each one using the BARDOT system. In our experiments we treated each strain as a separate class and used the number of samples listed in Table I from each class for training.
Scatter patterns of the bacteria were characterized by a total of 38 features involving moment invariants and Haralick texture descriptors. The features were selected by the procedure described for the exhaustive statistical machine-learning procedure. Details of the feature extraction process and its robustness when performed for other bacterial species are described in our previous publications [20]. Since the training dataset is nonexhaustive, the goal is to design a classifier that accurately detects samples of known classes as known and those of unknown classes as novelty. In this framework, classifiers can be more properly evaluated using receiver operating characteristic (ROC) curves. Here sensitivity is defined as the number of samples from known classes classified as known divided by the total number of samples from known classes. Specificity is defined as the number of samples from unknown classes detected as novelty, divided by the total number of samples from unknown classes. Multiple sensitivity and specificity values are obtained to plot the ROC curves. Different operating points are obtained by varying the threshold γ designated in (9).
To evaluate our approach the 431 colonies were randomly split into two sets, as train and test, with 80% of the samples being the training set and the remaining 20% being the test. Stratified sampling was used to make sure that each subclass was represented in both sets. This process was repeated ten times to obtain ten different pairs of train-test sets. Then, one serotype out of the seven available was randomly selected and all the samples belonging to this serotype were removed from the training datasets. Consequently this serotype became unknown for the trained classifier. The novelty detection algorithm was trained with the resulting nonexhaustive datasets and tested on the corresponding test sets. For each data split, the area under the ROC curve (i.e., the AUC value) was computed. The AUC values averaged over the ten different train-test splits were recorded along with the standard deviation. In order to account for any possible bias introduced by removing a serotype, the above process was repeated 6 more times, each time removing a different one of the seven serotypes available for this study. Each repetition involved re-running the same in silico experiment with a different nonexhaustive subset of the original data. AUC values achieved by our algorithm are included in Table 2 for all 7 experiments. As described earlier, these values represent the average of the ten runs each executed with a different train-test split. The values in the third column of the table indicate standard deviations. Figure 3 shows the corresponding ROC curves.
Table 2.
AUC values averaged over 10 iterations for all 7 experiments run with the Salmonella dataset. A single serotype is selected and considered unknown during each of the 7 experiments.
| Removed serotype | AUC | AUC sd |
|---|---|---|
| Salmonella Agona | 1.0 | 0.00 |
| Salmonella Cholerasuis | 0.85 | 0.02 |
| Salmonella Indiana | 1.0 | 0.00 |
| Salmonella Kentucky | 0.88 | 0.03 |
| Salmonella Schottmuelleri | 0.94 | 0.02 |
| Salmonella Tennessee | 0.99 | 0.01 |
| Salmonella Typhimurium (Copenhagen) | 0.97 | 0.01 |
Figure 3.
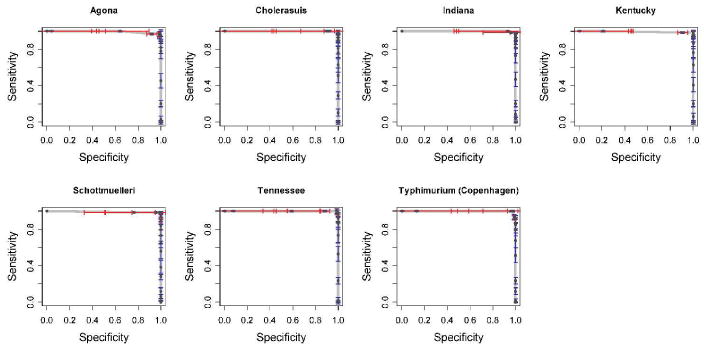
ROC curves computed for a BayesNoDe classifier tested with non-exhaustive Salmonella datasets. The seven curves represent seven incomplete datasets with a single serotype removed from each.
5 Discussion
The results presented in this report, as well as our previous publications, demonstrate that the label-free BARDOT technique paired with supervised learning systems indeed performs very well when libraries are assumed to be exhaustive, the number of bacterial classes is relatively small, and samples are assumed to be pure (no mixed cultures). This classification success expressed using standard measures such as sensitivity, specificity and AUC is comparable to the best results reported for other far more complex phenotypic detection systems based on Raman spectroscopy, IR spectroscopy, or MALDI-TOF [38, 39, 40, 8, 41].
It is important to note here that all phenotypic methods (elastic light scattering, vibrational spectroscopy, protein profiling, etc.) ultimately rely on the ability either to enrich the sample or to isolate a pure cell population in order to quantitatively describe the phenotypes. Specifically, the BARDOT phenotypic detection and classification technique cannot be employed for nonculturable microorganisms, as it relies on the ability to observe colonies. However, provided that the organisms of interest can be cultured and that the assumptions of library exhaustiveness are fulfilled, a traditional supervised learning system such as SVM can quite easily and successfully classify the scatter fingerprints
At this point a fundamental question should be asked: how likely is a biodetection system to encounter a new pathogenic class that the system is not trained to recognize? And consequently, how important is it to pursue effective solutions to this problem for either BARDOT or any other biodetection method using machine learning for identification of samples.
Unfortunately, the probability of encountering a new class cannot be universally estimated. Depending on the particular biodetection application, the occurrence of new, unknown, or unexpected pathogens can vary greatly. Effectively this problem becomes an issue of risk management. For instance, in the case of identification of Listeria monocytogenes the classification difficulty is relatively mild. Only thirteen serovars are recognized, most cases of human listeriosis are caused by serovars 4b, 1/2a, and 1/2b, and almost all large outbreaks in humans are due to serovar 4b [42]. Since the number of serovars is low, a traditional machine-learning system assuming an exhaustive library can be employed quite successfully. However, listeriosis is a serious disease and has a very high mortality rate. It disproportionately affects persons with impaired immune systems or persons of certain ethnic groups. Therefore an argument could be made that a system accounting for nonexhaustiveness would still perform better in case a new subclass emerges owing to a mutation [43, 44].
The constraints for risk assessment would be very different for Salmonella. Although Salmonella has over 2300 identified serotypes, the ten most common serotypes (Typhimurium, Enteritidis, and Newport being the top three) together account for over 70% of all cases of salmonellosis reported in 2002. No known biodetection methods for rapid Salmonella subtyping are capable of routine identification of all subtypes. If a BARDOT system equipped with standard supervised learning tools were employed for Salmonella subtyping and tuned for recognition of the most common serotypes, the probability of encountering a less common yet dangerous Salmonella would still be highly significant, considering the history of Salmonella outbreaks. Emergence of a new (i.e., previously unidentified) Salmonella serotype may dramatically affect public health – as in the case of the highly antibiotic-resistant and previously unknown serotype Newport, which was first identified through the National Antimicrobial Resistance Monitoring System surveillance in 1998 [45, 46]. The Newport serotype is responsible for 10% of infections in the US. The most common Newport variant, Newport-MDRAmpC, accounts for over 20% of tested isolates. This highly dangerous microorganism is resistant to chloramphenicol, streptomycin, sulfamethoxazole/sulfisoxazole, tetracycline, amoxicillin-clavulanic acid, ampicillin, cefoxitin, ceftiofur, and cephalothin [46, 47]!
The reported results obtained using classification with a non-exhaustive training library show that detecting unknown or emerging pathogens using a phenotypic label-free detection system such as BARDOT is indeed feasible. To test this notion we constructed a set of in silico experiments in which a know class of bacteria was hidden from the classification system during the training. These experiments simulate the condition of nonexhaustiveness. A “true” nonexhaustiveness cannot be tested in laboratory settings because it would require access to an unknown and uncharacterized serotype, and simultaneously, a full knowledge of this serotype in order to verify whether an unknown can be found. This obviously constitutes a logical conundrum. However, removing known serotypes from a training library and subsequently using a detection system to identify these organisms faithfully simulates an encounter with an emerging class of pathogens. The removal and subsequent detection/classification was tested for all seven available classes. The results summarized in Table 2 and illustrated in Figure 3 show that our classification system was indeed able to find hidden classes despite the fact that the classifier has not been previously exposed to their characteristic features. The best result was obtained for serotype Agona. All the colonies belonging to this serotype were correctly identified as belonging to a new emerging class, when classifier encountered Agona samples in the test dataset. The worst, yet still an impressive result (AUC = 0.85), was obtained for serotype Cholerasuis. The important aspect of the presented approach is that it is not based on any particular property of BARDOT-related features and therefore it can potentially be applied to other label-free measurement techniques, such as various forms of vibrational spectroscopy.
Despite the demonstrated ability to find unknown serotypes with the help of a Bayesian classification/detection algorithm, phenotypic methods cannot compete with approaches based on analysis of genetic information as far as thorough characterization of emerging phenotypes is concerned. However, there are many practical setting in which phenotypic approach may excel, and analysis of samples derived from food matrices is one of them. Usually 95-99.9% of tested samples are negative for the presence of food-borne pathogens. Therefore, the use of expensive detection kits to determine that a sample is negative can be considered uneconomical and unnecessary. A phenotypic method such as BARDOT can be employed as an inexpensive tool that would allow pre-screening of large numbers of samples. If a sample is found positive, the colony(ies) can be picked up and verified by PCR or other complex confirmatory tests.
Acknowledgments
The project was supported by Grant Number 5R21AI085531-02 from the National Institute of Allergy and Infectious Diseases (NIAID). The content is solely the responsibility of the authors and does not necessarily represent the official views of the National Institute of Allergy and Infectious Diseases or the National Institutes of Health.
A part of this research was supported through a cooperative agreement with the Agricultural Research Service of the US Department of Agriculture project number 1935-42000-035 and the Center for Food Safety and Engineering at Purdue University.
References
- 1.Lazcka O, Campo FJD, Munoz FX. Pathogen detection: a perspective of traditional methods and biosensors. Biosensors & Bioelectronics. 2007;22:1205–1217. doi: 10.1016/j.bios.2006.06.036. [DOI] [PubMed] [Google Scholar]
- 2.Bhunia AK. Biosensors and bio-based methods for the separation and detection of foodborne pathogens. Advances in Food and Nutrition Research. 2008;54:1–44. doi: 10.1016/S1043-4526(07)00001-0. [DOI] [PubMed] [Google Scholar]
- 3.Zourob M, Elwary S, Turner A. Principles of Bacterial Detection: Biosensors, Recognition Receptors and Microsystems. Springer; New York: 2008. [Google Scholar]
- 4.Helm D, Labischinski H, Schallehn G, Naumann D. Classification and identification of bacteria by Fourier-transform infrared spectroscopy. Journal of General Microbiology. 1991;137:69–79. doi: 10.1099/00221287-137-1-69. [DOI] [PubMed] [Google Scholar]
- 5.Naumann D, Helm D, Labischinski H. Microbiological characterizations by FT-IR spectroscopy. Nature. 1991;351:81–82. doi: 10.1038/351081a0. [DOI] [PubMed] [Google Scholar]
- 6.Rösch P, Schmitt M, Kiefer W, Popp J. The identification of microorganisms by micro-Raman spectroscopy. Journal of Molecular Structure. 2003:661-662–363–369. [Google Scholar]
- 7.Harz M, Rösch P, Popp J. Vibrational spectroscopy - a powerful tool for the rapid identification of microbial cells at the single-cell level. Cytometry Part A. 2009;75A:104–113. doi: 10.1002/cyto.a.20682. [DOI] [PubMed] [Google Scholar]
- 8.Willemse-Erix DFM, Scholtes-Timmerman MJ, Jachtenberg J, van Leeuwen WB, Horst-Kreft D, Schut TCB, Deurenberg RH, Puppels GJ, van Belkum A, Vos MC, Maquelin K. Optical fingerprinting in bacterial epidemiology: Raman spectroscopy as a real-time typing method. Journal of Clinical Microbiology. 2009;47:652–659. doi: 10.1128/JCM.01900-08. [DOI] [PMC free article] [PubMed] [Google Scholar]
- 9.Estes C, Duncan A, Wade B, Lloyd C, Ellis W, Powers L. Reagentless detection of microorganisms by intrinsic fluorescence. Biosensors and Bioelectronics. 2003;18:511–519. doi: 10.1016/s0956-5663(03)00008-3. [DOI] [PubMed] [Google Scholar]
- 10.Ammor MS, Delgado S, Alvarez-Martin P, Margolles A, Mayo B. Reagentless identification of human bifidobacteria by intrinsic fluorescence. Journal of Microbiological Methods. 2007;69:100–106. doi: 10.1016/j.mimet.2006.12.005. [DOI] [PubMed] [Google Scholar]
- 11.Lay JO. MALDI-TOF mass spectrometry of bacteria. Mass Spectrometry Reviews. 2001;20:172–194. doi: 10.1002/mas.10003. [DOI] [PubMed] [Google Scholar]
- 12.Dare D. Advanced Techniques in Diagnostic Microbiology. Springer; 2006. Rapid bacterial characterization and identification by MALDI-TOF mass spectrometry; pp. 117–133. [Google Scholar]
- 13.Seng P, Drancourt M, Gouriet F, Scola BL, Fournier P, Rolain JM, Raoult D. Ongoing revolution in bacteriology: Routine identification of bacteria by Matrix-Assisted laser desorption ionization Time-of-Flight mass spectrometry. Clinical Infectious Diseases. 2009;49:543–551. doi: 10.1086/600885. [DOI] [PubMed] [Google Scholar]
- 14.Wyatt PJ. Identification of bacteria by differential light scattering. Nature. 1969;221:1257–8. doi: 10.1038/2211257a0. [DOI] [PubMed] [Google Scholar]
- 15.Wyatt PJ, Phillips DT. Structure of single bacteria from light scattering. Journal of Theoretical Biology. 1972;37:493–501. doi: 10.1016/0022-5193(72)90087-2. [DOI] [PubMed] [Google Scholar]
- 16.Steen HB. Light scattering measurement in an arc lamp-based flow cytometer. Cytometry. 1990;11:223–30. doi: 10.1002/cyto.990110202. [DOI] [PubMed] [Google Scholar]
- 17.Rajwa B, Venkatapathi M, Ragheb K, Banada PP, Hirleman ED, Lary T, Robinson JP. Automated classification of bacterial particles in flow by multiangle scatter measurement and support vector machine classifier. Cytometry Part A: The Journal of the International Society for Analytical Cytology. 2008;73:369–79. doi: 10.1002/cyto.a.20515. [DOI] [PubMed] [Google Scholar]
- 18.Bayraktar B, Banada PP, Hirleman ED, Bhunia AK, Robinson JP, Rajwa B. Feature extraction from light-scatter patterns of Listeria colonies for identification and classification. Journal of Biomedical Optics. 2006;11:34006. doi: 10.1117/1.2203987. [DOI] [PubMed] [Google Scholar]
- 19.Banada PP, Guo S, Bayraktar B, Bae E, Rajwa B, Robinson JP, Hirleman ED, Bhunia AK. Optical forward-scattering for detection of Listeria monocytogenes and other Listeria species. Biosensors & Bioelectronics. 2007;22:1664–71. doi: 10.1016/j.bios.2006.07.028. [DOI] [PubMed] [Google Scholar]
- 20.Banada PP, Huff K, Bae E, Rajwa B, Aroonnual A, Bayraktar B, Adil A, Robinson JP, Hirleman ED, Bhunia AK. Label-free detection of multiple bacterial pathogens using light-scattering sensor. Biosensors & Bioelectronics. 2009;24:1685–92. doi: 10.1016/j.bios.2008.08.053. [DOI] [PubMed] [Google Scholar]
- 21.Dundar MM, Hirleman ED, Bhunia AK, Robinson JP, Rajwa B. Learning with a non-exhaustive training dataset A case study: detection of bacteria cultures using optical-scattering technology. Proceedings of the 15th ACM SIGKDD International Conference on Knowledge Discovery and Data Mining; Paris, France. 2009. pp. 279–288. [Google Scholar]
- 22.Hu M. Visual pattern recognition by moment invariants. Information Theory, IRE Transactions on. 1962;8:179–187. [Google Scholar]
- 23.Haralick RM, Shanmugam K, Dinstein I. Textural features for image classification. Systems, Man and Cybernetics, IEEE Transactions on. 1973;3:610–621. [Google Scholar]
- 24.Haralick R. Statistical and structural approaches to texture. Proceedings of the IEEE. 1979;67:786–804. [Google Scholar]
- 25.Teague MR. Image analysis via the general theory of moments. Journal of the Optical Society of America. 1980;70:920–930. [Google Scholar]
- 26.Khotanzad A, Hong Y. Invariant image recognition by Zernike moments. Pattern Analysis and Machine Intelligence, IEEE Transactions on. 1990;12:489–497. [Google Scholar]
- 27.Khotanzad A, Hong YH. Rotation invariant image recognition using features selected via a systematic method. Pattern Recognition. 1990;23:1089–1101. [Google Scholar]
- 28.Mukundan R, Ramakrishnan KR. Fast computation of Legendre and Zernike moments. Pattern Recognition. 1995;28:1433–1442. [Google Scholar]
- 29.Xia T, Zhu H, Shu H, Haigron P, Luo L. Image description with generalized pseudo-Zernike moments. Journal of the Optical Society of America A. 2007;24:50–59. doi: 10.1364/josaa.24.000050. [DOI] [PMC free article] [PubMed] [Google Scholar]
- 30.Duda RO, Hart PE, Stork DG. Pattern Classification. 2. Wiley-Interscience; 2000. [Google Scholar]
- 31.Chang CC, Lin CJ. LIBSVM: a library for support vector machines. 2001 Software available at http://www.csie.ntu.edu.tw/∼cjlin/libsvm.
- 32.R Development Core Team R. A Language and Environment for Statistical Computing. R Foundation for Statistical Computing; Vienna, Austria: 2010. [Google Scholar]
- 33.Akova F, Dundar M, Davisson VJ, Hirleman ED, Bhunia AK, Robinson JP, Rajwa B. A machine-learning approach to detecting unmatched bacterial serovars. to appear in the Statistical Analysis and Data Mining Journal. doi: 10.1002/sam.10085. In press. [DOI] [PMC free article] [PubMed] [Google Scholar]
- 34.Bellman RE. Dynamic Programming. Princeton University Press; 1957. [Google Scholar]
- 35.Friedman JH. Regularized discriminant analysis. Journal of The American Statistical Association. 1989;84:165–175. [Google Scholar]
- 36.Greene T, Rayens W. Partially pooled covariance matrix estimation in discriminant analysis. Commun Statist Theory Meth. 1989;18:3679–3702. [Google Scholar]
- 37.Anderson TW. An Introduction to Multivariate Statistical Analysis. 3rd. Wiley-Interscience; 2003. [Google Scholar]
- 38.Rebuffo CA, Schmitt J, Wenning M, von Stetten F, Scherer S. Reliable and rapid identification of Listeria monocytogenes and Listeria species by artificial neural network-based Fourier transform infrared spectroscopy. Applied and Environmental Microbiology. 2006;72:994–1000. doi: 10.1128/AEM.72.2.994-1000.2006. [DOI] [PMC free article] [PubMed] [Google Scholar]
- 39.Hsieh S, Tseng C, Lee Y, Kuo A, Sun C, Lin Y, Chen J. Highly efficient classification and identification of human pathogenic bacteria by MALDI-TOF MS. Molecular & Cellular Proteomics. 2008;7:448–456. doi: 10.1074/mcp.M700339-MCP200. [DOI] [PubMed] [Google Scholar]
- 40.Parisi D, Magliulo M, Nanni P, Casale M, Forina M, Roda A. Analysis and classification of bacteria by matrix-assisted laser desorption/ionization time-of-flight mass spectrometry and a chemometric approach. Analytical and Bioanalytical Chemistry. 2008;391:2127–2134. doi: 10.1007/s00216-008-2161-2. [DOI] [PubMed] [Google Scholar]
- 41.Preisner O, Guiomar R, Machado J, Menezes JC, Lopes JA. Application of fourier transform infrared spectroscopy and chemometrics for differentiation of salmonella enterica serovar enteritidis phage types. Appl Environ Microbiol. 2010;76:3538–3544. doi: 10.1128/AEM.01589-09. [DOI] [PMC free article] [PubMed] [Google Scholar]
- 42.Adams M, Motarjemi Y. Emerging foodborne pathogens. CRC Press; 2006. [Google Scholar]
- 43.Foundation IR, Institute RS. Achieving continuous improvement in reductions in foodborne listeriosis–a risk-based approach. Journal of Food Protection. 2005;68:1932–1994. doi: 10.4315/0362-028x-68.9.1932. [DOI] [PubMed] [Google Scholar]
- 44.Swaminathan B, Gerner-Smidt P. The epidemiology of human listeriosis. Microbes and Infection. 2007;9:1236–1243. doi: 10.1016/j.micinf.2007.05.011. [DOI] [PubMed] [Google Scholar]
- 45.CDC. Outbreak of multidrug-resistant Salmonella Newport–United States, January-April 2002. MMWR Morbidity and Mortality Weekly Report. 2002;51:545–548. [PubMed] [Google Scholar]
- 46.Gupta A, Fontana J, Crowe C, Bolstorff B, Stout A, Duyne SV, Hoekstra MP, Whichard JM, Barrett TJ, Angulo FJ. Emergence of multidrug-resistant salmonella enterica serotype Newport infections resistant to expanded-spectrum cephalosporins in the United States. The Journal of Infectious Diseases. 2003;188:1707–1716. doi: 10.1086/379668. [DOI] [PubMed] [Google Scholar]
- 47.Karon AE, Archer JR, Sotir MJ, Monson TA, Kazmierczak JJ. Human multidrug-resistant Salmonella Newport infections, Wisconsin, 2003-2005. Emerging Infectious Diseases. 2007;13:1777–1780. doi: 10.3201/eid1311.061138. [DOI] [PMC free article] [PubMed] [Google Scholar]