

Non-technical summary
Synaptically activated changes in dendritic [Ca2+]i affect many important physiological processes including synaptic plasticity and gene expression. The location, magnitude and time course of these changes can determine which mechanisms are affected. Therefore, it is important to understand the processes that control and modulate these changes. One important source is Ca2+ entering through voltage-gated Ca2+ channels opened by action potentials backpropagating over the dendrites (bAPs). Here we examine how [Ca2+]i changes, caused by regenerative Ca2+ release from internal stores (Ca2+ waves) or by regenerative Ca2+ entry through NMDA receptors (NMDA spikes), affect subsequent bAP-evoked [Ca2+]i changes. These large [Ca2+]i increases suppressed the bAP signals in the regions where the preceding [Ca2+]i increases were largest. The suppression was proportional to the magnitude of the large [Ca2+]i change and was insensitive to kinase and phosphatase inhibitors, consistent with suppression due to Ca2+-dependent inhibition of Ca2+ channels.
Abstract
Abstract
Postsynaptic [Ca2+]i changes contribute to several kinds of plasticity in pyramidal neurons. We examined the effects of synaptically activated Ca2+ waves and NMDA spikes on subsequent Ca2+ signalling in CA1 pyramidal cell dendrites in hippocampal slices. Tetanic synaptic stimulation evoked a localized Ca2+ wave in the primary apical dendrites. The [Ca2+]i increase from a backpropagating action potential (bAP) or subthreshold depolarization was reduced if it was generated immediately after the wave. The suppression had a recovery time of 30–60 s. The suppression only occurred where the wave was generated and was not due to a change in bAP amplitude or shape. The suppression also could be generated by Ca2+ waves evoked by uncaging IP3, showing that other signalling pathways activated by the synaptic tetanus were not required. The suppression was proportional to the amplitude of the [Ca2+]i change of the Ca2+ wave and was not blocked by a spectrum of kinase or phosphatase inhibitors, consistent with suppression due to Ca2+-dependent inactivation of Ca2+ channels. The waves also reduced the frequency and amplitude of spontaneous, localized Ca2+ release events in the dendrites by a different mechanism, probably by depleting the stores at the site of wave generation. The same synaptic tetanus often evoked NMDA spike-mediated [Ca2+]i increases in the oblique dendrites where Ca2+ waves do not propagate. These NMDA spikes suppressed the [Ca2+]i increase caused by bAPs in those regions. [Ca2+]i increases by Ca2+ entry through voltage-gated Ca2+ channels also suppressed the [Ca2+]i increases from subsequent bAPs in regions where the voltage-gated [Ca2+]i increases were largest, showing that all ways of raising [Ca2+]i could cause suppression.
Introduction
Synaptically activated [Ca2+]i changes evoke several kinds of plasticity in pyramidal neurons. These include changes in synaptic strength (Malenka & Nicoll, 1999) and changes in electrical properties of the neuron (Frick et al. 2004; Kim et al. 2007). Important considerations in determining which kinds of plasticity are generated are the location, magnitude and source of the [Ca2+]i changes in the cell. Synaptic plasticity primarily results from Ca2+ entry into spines through NMDA receptors and the [Ca2+]i increase is usually localized to the spine head (Sabatini et al. 2001). This source of Ca2+ is also responsible for some forms of electrical plasticity (Fan et al. 2005). Ca2+ entry through voltage-gated Ca2+ channels (VGCCs) can evoke LTP under some conditions (Grover & Teyler, 1990) and can cause plasticity of spine Ca2+ channels (Yasuda et al. 2003).
A third source of [Ca2+]i increase in the dendrites is Ca2+ release from intracellular stores, often in the form of large-amplitude Ca2+ waves (Nakamura et al. 1999; Power & Sah, 2007; Hagenston et al. 2008) or small localized Ca2+ release events (IP3 receptor-mediated release (‘puffs’) or ryanodine receptor-mediated release (‘sparks’); Manita & Ross, 2009). Ca2+ waves primarily occur on the main apical dendrites (Nakamura et al. 2002), but sometimes are found near dendritic spines (Holbro et al. 2009). There is evidence that Ca2+ release from stores participates in some forms of LTP and LTD (Reyes & Stanton, 1996; Taufiq et al. 2005; Dudman et al. 2007). More directly, Fernández de Sevilla et al. (2008) showed that Ca2+ waves induce a form of NMDA receptor-independent form of LTP. Holbro et al. (2009) showed that localized Ca2+ release in some spines and nearby dendrites causes LTD.
A fourth source of dendritic [Ca2+]i increase are NMDA spikes (Schiller et al. 2000; Major et al. 2008). These large, spatially restricted [Ca2+]i increases result from the regenerative activation of NMDA receptors and dendritic Ca2+ channels and have been shown to affect LTP in certain regions of pyramidal cell basal dendrites (Gordon et al. 2006).
The effects of Ca2+ release and NMDA spikes on the electrical and channel properties in dendrites are just beginning to be examined. Topolnik et al. (2009) found that local activation of mGluR5 receptors in hippocampal interneurons induced long-lasting potentiation of action potential-evoked Ca2+ transients, which required intracellular Ca2+ release and PKC activation. Brager & Johnston (2007) found that dendritic h-channels were down-regulated following a stimulus protocol that was pharmacologically identified to release Ca2+ from intracellular stores.
In our current experiments we examined the effects of large-amplitude [Ca2+]i changes during Ca2+ waves and NMDA spikes on the backpropagating action potential (bAP)-evoked and subthreshold depolarization-evoked [Ca2+]i changes that immediately followed the wave or spike. The amplitude of these [Ca2+]i increases was locally suppressed for ∼30–60 s. The frequency and amplitude of localized Ca2+ release events were also suppressed by Ca2+ waves, but this suppression primarily occurred through a different mechanism. Since bAP-evoked [Ca2+]i changes themselves contribute to various forms of plasticity, these results suggest an additional way that these plastic changes can be locally modulated. The experiments also revealed a complexity in the interactions of Ca2+ signalling mechanisms that is essentially invisible to electrical recordings.
Methods
Whole-cell recording and stimulation
Transverse hippocampal slices (300 μm thick) from 5- to 6-week-old Sprague–Dawley rats were prepared as previously described (Nakamura et al. 2002). A few experiments examined younger animals (2–4 weeks old) with the same results. Animals were anaesthetized with isoflurane and decapitated using procedures approved by the Institutional Animal Care and Use Committee of New York Medical College. Just before decapitation the heart was perfused with ice-cold artificial cerebrospinal fluid (ACSF) composed of (mm): 80 NaCl, 2.5 KCl, 0.29 CaCl2, 7 MgCl2, 1.25 NaH2PO4, 25 NaHCO3, 75 sucrose, 10.1 glucose, 1.3 ascorbate and 3 pyruvate. Slices were cut in the same solution. They were incubated for at least 1 h in solution consisting of (mm): 124 NaCl, 2.5 KCl, 2 CaCl2, 2 MgCl2, 1.25 NaH2PO4, 26 NaHCO3, 10.1 glucose, 1.3 ascorbate and 3 pyruvate, bubbled with a mixture of 95% O2–5% CO2, making the final pH 7.4. Normal ACSF, composed of (mm): 124 NaCl, 2.5 KCl, 2 CaCl2, 2 MgCl2, 1.25 NaH2PO4, 26 NaHCO3 and 10.1 glucose, was used for recording.
Submerged slices were placed in a chamber mounted on a stage rigidly bolted to an air table and were viewed with a 40× or 60× water-immersion lens in an Olympus BX50WI microscope mounted on an X–Y translation stage. Somatic whole-cell recordings were made using patch pipettes pulled from 1.5 mm outer diameter thick-walled glass tubing (1511-M, Friedrich and Dimmock, Millville, NJ, USA). Tight seals on CA1 pyramidal cell somata were made with the ‘blow and seal’ technique using video-enhanced DIC optics to visualize the cells (Sakmann & Stuart, 1995). For most experiments the pipette solution contained (mm): 145 potassium gluconate, 4 NaCl, 4 Mg-ATP, 0.3 Na-GTP, 14 sodium phosphocreatine and 10 Hepes, pH adjusted to 7.3 with KOH. Final osmolarity was 297 mosmol l−1. This solution was supplemented with low-affinity Ca2+ indicators, either 50 μm OGB-1 or 200 μm Oregon Green Bapta-5N (Molecular Probes, Eugene, OR, USA). Synaptic stimulation was evoked with 200 μs pulses with glass electrodes placed on the slice about 5–30 μm to the side of the main apical dendritic shaft and at varying distances from the soma. These electrodes were low-resistance patch pipettes (less than 10 MΩ) filled with ACSF. We controlled the amplitude of the synaptic response to be below the threshold for action potential (AP) generation, either by regulating the stimulation current or hyperpolarizing the cell body with the patch electrode on the soma. Temperature in the chamber was maintained between 31 and 33°C, except when temperature was specifically varied. Caged IP3 (d-myo-inositol 1,4,5-trisphosphate, p4(5)-1-(2-nitrophenyl)ethyl ester; Walker et al. 1987) was purchased from EMD Biosciences (La Jolla, CA, USA). All other chemicals were obtained from Fisher Scientific (Piscataway, NJ, USA), Sigma Chemical Co. (St Louis, MO, USA) or Tocris Bioscience (Ellisville, MO, USA). Stock solutions were prepared (nifedipine, 100 mm in DMSO; nimodipine, 10 mm in EtOH; AM251, 2 mm in DMSO; staurosporine, 1 mm in DMSO; KN-62, 4 mm in DMSO; thapsigargin, 5 mm in DMSO; H-7 and W-7, 10 mm in H2O), frozen and diluted to final concentration in ACSF just before use. For experiments using nifedipine or nimodipine care was taken to minimize exposure to light except in the experimental chamber at the time of the test.
Dynamic [Ca2+]i measurements
Time-dependent [Ca2+]i measurements from different regions of the pyramidal neuron were made as previously described (Lasser-Ross et al. 1991; Manita & Ross, 2009). Briefly, a RedShirtImaging (Atlanta, GA, USA) NeuroCCD-SMQ cooled CCD camera was mounted on the camera port of the microscope and their Neuroplex software controlled readout parameters and synchronization with electrical recordings. A custom program was used to analyse and display the data. We measured fluorescence changes of OGB-1 and OGB-5N with excitation at 494 ± 10 nm and emission at 536 ± 20 nm. [Ca2+]i changes are expressed as ΔF/F where F is the fluorescence intensity when the cell is at rest and ΔF is the change in fluorescence during activity. Corrections were made for indicator bleaching during trials by subtracting the signal measured under the same conditions when the cell was not stimulated. We did not correct for tissue autofluorescence.
To examine the spatial distribution of postsynaptic [Ca2+]i changes we selected pyramidal neurons that were in the plane of the slice and close to the surface. In these neurons, we could examine [Ca2+]i increases over a range of 110 μm with the 60× lens and 165 μm with the 40× lens. Increases in different parts of the cell are displayed using either selected regions of interest (ROIs) or a pseudo ‘line scan’ display (Nakamura et al. 2000).
Photolysis of caged IP3
Caged IP3 (200–400 μm) was included in the patch pipette, and was allowed to diffuse throughout the cell after membrane rupture. Pulsed UV light centred at 365 nm from a light-emitting diode (UVILED, Rapp Optoelectronics) was focused through the objective via a 200 μm diameter quartz fibre optic light guide making a spot of about 10–15 μm in diameter on the slice with the 60× objective lens. UV light intensity was regulated by changing the fraction of time the UV light was on during a high-frequency pulse train (Manita & Ross, 2010).
Results
Suppression by Ca2+ waves
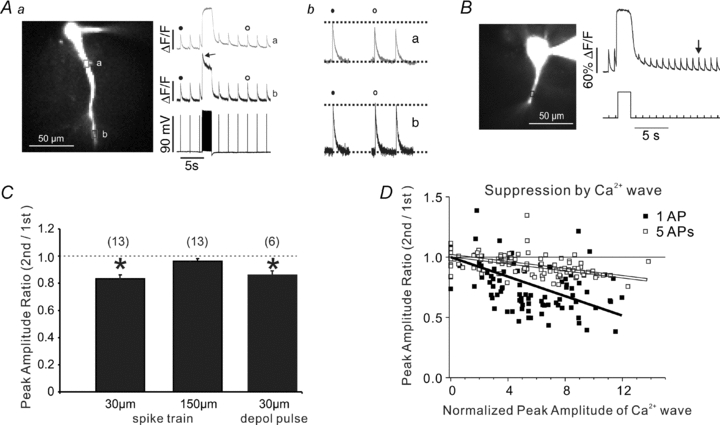
The basic protocol examining the effects of Ca2+ waves on bAP-evoked [Ca2+]i changes is shown in Fig. 1. A pair of bAPs was evoked with brief intrasomatic pulses. These bAPs generated transient [Ca2+]i increases at all dendritic locations in the field of view (∼110 μm in most experiments). These changes are shown both as a signal from a single ROI and as a pseudo line scan display. In the first experiment a Ca2+ wave was generated in the dendrites with tetanic synaptic stimulation (100 Hz for 1 s; Nakamura et al. 1999) in the interval between the two bAPs. In this case, the amplitude of the second bAP-evoked [Ca2+]i increase, measured at a site where the Ca2+ wave was generated, was less than the signal from the first bAP. In the next trial (‘no priming’) the same tetanus did not evoke a Ca2+ wave and there was no reduction in the bAP [Ca2+]i increase. The failure to generate a Ca2+ wave in this trial was probably due to the emptying of the Ca2+ stores by the Ca2+ wave in the first trial (Miller et al. 1996; Hong & Ross, 2007). Consistent with this interpretation, when the cell was primed with a train of bAPs (1 Hz for 1 min) the same synaptic tetanus generated a Ca2+ wave and suppressed the amplitude of the second bAP signal. The failure to suppress the bAP signal when the Ca2+ wave was not generated suggests that the Ca2+ wave was responsible for the suppression and not other pathways activated by the synaptic tetanus (e.g. mGluRs, PLCβ, PKC, diacylglycerol).
Figure 1. Ca2+ waves suppress the amplitude of bAP-evoked dendritic [Ca2+]i changes.
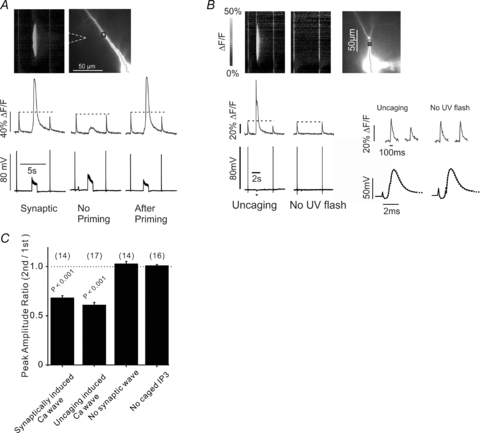
A, the image (top, right) shows a pyramidal neuron filled with 50 μm OGB-1 from the patch electrode on the soma; the position of the stimulating electrode is indicated with dotted lines. The greyscale image (top, left) shows the spatial profile of the [Ca2+]i changes along the chain of pixels on the cell image. Two bAPs, 6 s apart, were evoked by 1 ms intrasomatic pulses; between the bAPs a synaptic tetanus (100 Hz for 1 s) evoked a Ca2+ wave. The traces (middle) show the [Ca2+]i changes from the bAPs and Ca2+ wave at the black ROI in the top right image. The amplitude of the 2nd bAP signal was smaller than the 1st. Note that the Ca2+ wave is localized in the dendrites while the bAP signals are detected over the full dendritic field. When the experiment was repeated (‘no priming’) with the same intensity tetanus no Ca2+ wave was generated and the amplitudes of the bAP signals were the same. The experiment was repeated after priming the stores with a train of bAPs at 1 Hz for 1 min. This time a Ca2+ wave again was generated and the bAP signal was suppressed. Membrane potential changes (bottom) were recorded from soma. B, a similar experiment except a 500 ms duration, 15 μm diameter, uncaging flash (grey circle in the top right image) was directed at the dendrites 2 s after the first bAP. The patch pipette contained 200 μm caged IP3. A large Ca2+ wave was generated and the amplitude of the second bAP-evoked [Ca2+]i change was reduced. When there was no uncaging pulse the bAP fluorescence amplitudes were the same. There is a brief uncaging artifact at the time of the UV pulse. The bAP-evoked [Ca2+]i changes on the dendrite and electrical recordings on the soma are shown in greater detail at the bottom right. Each pair of electrical recordings shows the first AP (continuous line) and the second AP (dashed line). In both cases the APs were identical. C, summary histogram showing the effects of different stimulation protocols on the bAP-evoked [Ca2+]i changes. Uncaging evoked or synaptically evoked Ca2+ waves strongly reduced the 2nd [Ca2+]i change. Synaptic stimulation that did not evoke a Ca2+ wave did not suppress the bAP signal. Application of the UV flash in cells without caged IP3 did not suppress the bAP signal. The numbers in parentheses above the bars indicate the number of experiments.
To further test this conclusion we generated a Ca2+ wave by uncaging IP3 in the dendrites (Manita & Ross, 2010). This approach bypasses the molecular components of the Ca2+ release process before the IP3 receptor. This uncaging-evoked Ca2+ wave also suppressed the bAP-generated [Ca2+]i increase (Fig. 1B). The summary statistics (Fig. 1C) show that the suppressed amplitude was typically 60–70% of the first spike signal, measured at a site near the centre of the Ca2+ wave (synaptically induced: 68.0 ± 2.1% and uncaging induced: 61.0 ± 2.4%, compared with the peak amplitude of bAP-evoked [Ca2+]i increase before the Ca2+ wave). The similarity of the Ca2+ waves and the resulting suppression from the two ways of doing the experiments (synaptic stimulation or uncaging IP3) also suggested that in some experiments we could use uncaging to quantitatively assay the suppression. With uncaging, we could more reproducibly generate Ca2+ waves and control their spatial and temporal characteristics.
One possible mechanism for the suppression is that the Ca2+ wave affected the peak membrane potential amplitude of the spike, reducing the amount of Ca2+ entry through voltage-gated Ca2+ channels (VGCCs). The expanded electrical traces (Fig. 1B) show that the somatically recorded APs were unaffected by the dendritic Ca2+ wave. To more directly test this possibility we repeated these experiments with patch recordings at the sites of wave generation. Figure 2A shows an example where a Ca2+ wave in the dendrites did not affect the AP amplitude or shape at the recording site but did suppress the [Ca2+]i increase (spike fluorescence signal ratio, 0.70 ± 0.04, spike amplitude ratio, 1.01 ± 0.02, n = 4; Fig. 2B). Similarly, a Ca2+ wave generated by an uncaging flash to the soma suppressed the AP signal but did not affect the electrical recording from the cell body (data not shown). Another possibility is that the large [Ca2+]i increase from the Ca2+ wave activated a K+ conductance, which persisted until the second bAP and affected the spike parameters. However, 100 nm apamin, which blocks SK channels (the dominant K+ channel activated by Ca2+ waves; Hong et al. 2007; El-Hassar et al. 2011) did not affect the Ca2+ wave-mediated suppression or the spike parameters (Control: fluorescence signal ratio, 0.66 ± 0.05; spike width ratio, 0.98 ± 0.04; spike amplitude ratio, 1.01 ± 0.01; 100 nm apamin: fluorescence signal ratio, 0.70 ± 0.07; spike width ratio, 1.04 ± 0.02; spike amplitude ratio, 1.00 ± 0.01, n = 4; Fig. 2C). These experiments show that the suppression mechanism affected the VGCCs opened by the bAP and not the peak bAP amplitude or width.
Figure 2. The reduction in bAP-evoked [Ca2+]i increase is not due to a change in the AP peak amplitude or width at the site of the measurement.
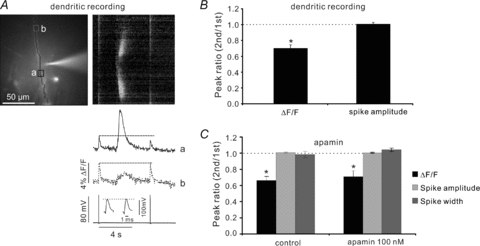
A, the image shows a dendrite with a patch electrode about 70 μm from the soma. The uncaging pulse at that location caused a reduction in the bAP Ca2+ signal at the site of the evoked Ca2+ wave (continuous ROI, a) but not at a distal location (dotted ROI, b) where the wave did not reach. The inset in the electrical trace shows that there was no change in the AP peak amplitude or shape. The cell was loaded with 50 μm OGB-1. B, summary histogram (*P < 0.01; two-tailed t test; n = 4). C, summary histogram for experiments showing that 100 nm apamin did not affect synaptically evoked Ca2+ wave-mediated suppression or spike parameters (*P < 0.01 for control; *P < 0.01 for apamin; two-tailed t test; n = 4). Ca2+ measurements from dendrites; electrical measurements from soma.
If the suppression is caused by the [Ca2+]i increase of the Ca2+ wave then we would expect the suppression to be largest where the wave is generated and less at other locations. The experiments in Fig. 3 confirm this idea. In one cell (Fig. 3A), sites near the centre of the wave (green and blue ROIs) showed the greatest suppression and sites at the edge of the wave (red and magenta ROIs) showed no suppression. A detailed profile along the dendrite of another cell (Fig. 3B) confirms that the suppression was maximal at the centre of the wave. The experiments supply additional evidence that the Ca2+ waves did not affect the electrical properties of the bAP since there was no suppression at sites distal to the Ca2+ wave.
Figure 3. The reduction in the bAP-evoked [Ca2+]i increase is greatest at locations with the largest wave-generated [Ca2+]i increase.
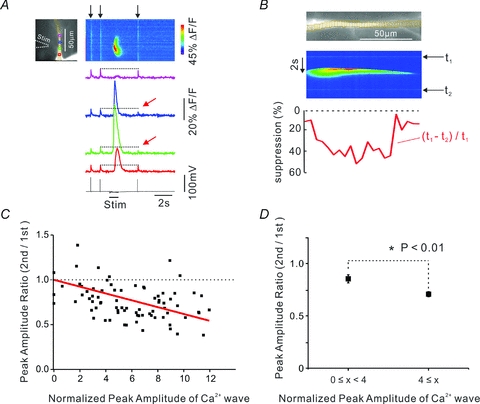
A, typical experiment measuring reduction in bAP-evoked [Ca2+]i increase following a synaptically evoked Ca2+ wave. The largest reductions (red arrows) were at the blue and green ROIs at the centre of the wave. Indicator, 200 μm OGB-5N. B, detailed profile (red trace) of the signal suppression (per cent of bAP signal at each location) along the dendrite (different cell) showing greatest effect where the wave-evoked [Ca2+]i increase was largest. C, summary of data from 8 cells. The amplitude of the [Ca2+]i increase from the wave at a specific location was normalized to the amplitude of the bAP signal evoked at that location before the wave was generated. Several locations were chosen for each cell. Larger reductions were measured at locations with the largest wave-generated [Ca2+]i increases. The red line is the best fit to the data, with the line forced to 1.0 when the [Ca2+]i change was 0. D, the same data grouped into two bins showing that the suppression was significantly greater for larger [Ca2+]i changes.
These experiments suggest that the suppression is proportional to the magnitude of the [Ca2+]i increase generated by the wave. Figure 3C shows data from many cells where we compared these two parameters. The [Ca2+]i increase was measured using the low-affinity indicator OGB-5N (Kd≈ 20 μm; Molecular Probes catalogue), making the [Ca2+]i increases proportional to the fluorescence signal (ΔF/F). These increases were normalized to the signal from a single bAP (evoked before the wave) at the same location. This normalization facilitated comparison among cells. Although there was scatter, the figure supports the hypothesis of proportionality. Grouping the data into bins (Fig. 3D) confirms the significance of the trend.
In most of these experiments we measured the suppression about 6 s after the generation of the Ca2+ wave. To determine the time window for this effect and to estimate the recovery time we measured the suppression with test bAPs evoked at different times after the Ca2+ was generated. We did this experiment in two ways. In one (Fig. 4A) we evoked a train of bAPs at 1 s intervals, then generated a Ca2+ wave with a UV flash after the third bAP, and measured the amplitudes of the bAP signals over the next 25 s. The suppression was maximal just after the Ca2+ wave and recovered to about 80% of the pre-stimulus amplitude by the end of the trial. The [Ca2+]i did not completely recover to baseline levels between bAPs in the initial few seconds after the Ca2+ wave (Fig. 4B). This ‘residual’[Ca2+]i should not depress the transient amplitudes since the response of OGB-1 is almost linear in this range (Fig. 4C). Nevertheless, we usually waited 5 s after the Ca2+ wave before making measurements to eliminate this potential problem. The second protocol for measuring the recovery time was to repeat experiments like those in Fig. 1 only varying the time before evoking the second bAP. This protocol avoided any potential problems from residual signals from the bAP train in the first approach. Figure 4D (with summary results in Fig. 4E) shows that the recovery time was about 30 s, consistent with the results using the first method.
Figure 4. The reduction in the bAP-evoked [Ca2+]i increase can be detected for 30–60 s after the Ca2+ wave.
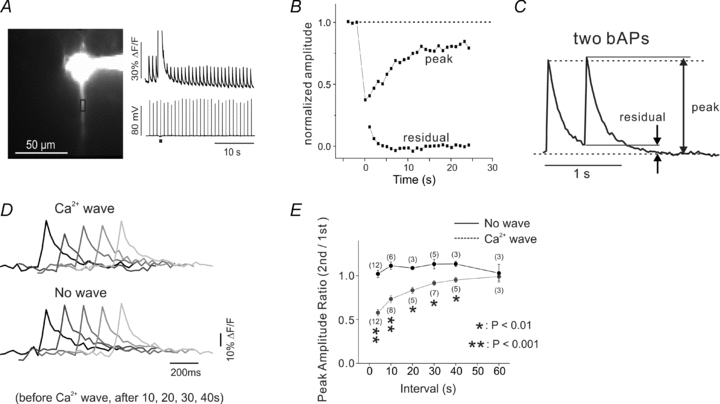
A, bAPs were evoked at 1 Hz and the [Ca2+]i increases were measured at a location in the dendrites. After the third bAP a UV flash evoked a Ca2+ wave near that location and the amplitude of the bAP signals was suppressed for more than 20 s. B, the normalized peak amplitude (measured from the base of the transient) and the residual amplitude between bAP signals after the Ca2+ wave are plotted. The amplitude was still suppressed at the time the residual amplitude recovered to baseline. C, response to two bAPs, 500 ms apart, measured about 100 μm from the soma. The summated amplitude was always greater (n = 5 cells) than the response to the first bAP when there was a residual change from the first bAP. D, overlaid measurements of the bAP-evoked [Ca2+]i increases before and after the Ca2+ wave in experiments similar to that in Fig. 1. The traces show measurements from an ROI over the dendrites at the centre of the wave at 10, 20, 30 and 40 s after the end of the wave. The suppression was strongest at 10 s and less at later times. The bottom traces show similar data in experiments where no wave was generated. There was no reduction in the fluorescence signal. E, summary data from many experiments showing strong reduction just after wave generation and no reduction 60 s after the wave. Indicator, 50 μm OGB-1.
Suppression by NMDA spikes
Since synaptically activated Ca2+ waves are generated most strongly on the primary apical dendrite (Nakamura et al. 1999, 2002) it was not possible to use these waves to assay bAP signal suppression on the oblique dendrites. To examine the effects of large [Ca2+]i increases in this region of the dendrites we used NMDA spikes (Schiller et al. 2000), which are often generated by a similar synaptic tetanus. These spikes generate large [Ca2+]i increases predominantly by regenerative Ca2+ entry through NMDA receptors. They have been studied most extensively in the basal dendrites of rat L5 pyramidal neurons (Major et al. 2008), but have also been observed on oblique and tuft dendrites (Larkum et al. 2009; Antic et al. 2010).
Figure 5A shows an experiment where we tested whether these NMDA spikes could suppress bAP Ca2+ signals on the oblique dendrites. A synaptic tetanus (100 Hz for 500 ms) evoked a Ca2+ wave on the main apical dendrite and a regenerative NMDA spike on an oblique dendrite with no spatial overlap. These are separate events because the addition of 100 μm APV completely blocked the NMDA spike but had no effect on the Ca2+ wave (Nakamura et al. 2002). The bAP Ca2+ signals were suppressed on both the apical and oblique dendrites by these events (Fig. 5C). The NMDA spike was the cause of the suppression on the oblique dendrite since APV prevented the reduction of the bAP [Ca2+]i increase at that site. The magnitude of the suppression was proportional to the normalized [Ca2+]i increase at the sites of suppression on the oblique dendrites (Fig. 5D). However, the slope of the proportionality (red line) was different from the slope for the Ca2+ wave-mediated suppression on the main apical dendrite (Fig. 3C). This difference may be due to a different mixture of Ca2+ channel types in the two compartments (Magee & Johnston, 1995; Yasuda et al. 2003) or to the longer duration of the NMDA spikes compared to the duration of Ca2+ waves (e.g. Fig. 5A). Also, the spike signals on the oblique dendrites may be smaller than the signals on the main apical dendrite because the spike voltage amplitude declines with distance (Spruston et al. 1995). This smaller spike signal would make the normalized NMDA spike amplitude appear larger. The peak suppression amplitude and time course of recovery were about the same in the two compartments (Fig. 5E). These experiments show that a large [Ca2+]i increase, not from a Ca2+ wave, can suppress bAP-evoked [Ca2+]i increases. One caveat to this conclusion is that we could not measure directly the spike voltage amplitude on the oblique dendrites, although the similarity to the suppression on the main apical dendrite suggests that we are dealing with the same mechanism.
Figure 5. Synaptically evoked NMDA spikes suppress bAP-evoked [Ca2+]i increases on the oblique dendrites.
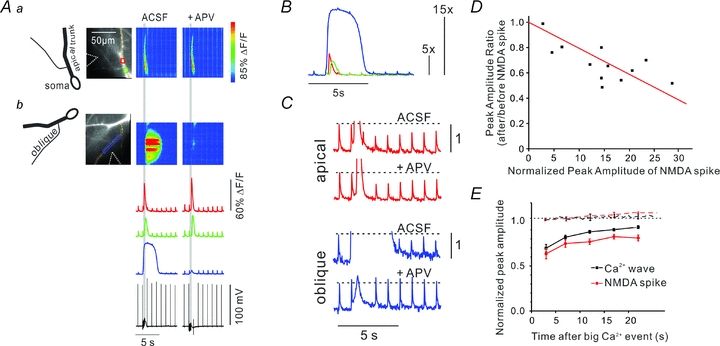
A, an experiment similar to that in Fig. 1 except that the low-affinity indicator OGB-5N (200 μm) was used. The top part shows ROIs and pseudocolour images of bAP signals and a synaptically evoked (100 Hz for 500 ms, grey vertical bar) Ca2+ wave along the main apical dendrite. The lower images show the same experiment except a rectangular ROI and pixel line along an oblique dendrite were selected. The tetanus evoked a larger and slower [Ca2+]i increase at these locations. Repeating the experiment in the presence of 100 μm APV blocked the large Ca2+ signal on the oblique dendrites but had no effect on the Ca2+ wave on the apical shaft. B, fluorescence signals at the three ROIs normalized to the amplitude of a bAP signal generated before the tetanus. The wave was about 5× the bAP signal and the NMDA spike more than 15× the bAP signal. C, high-resolution measurements showing that the Ca2+ wave suppressed the bAP signal on the apical shaft and the NMDA spike suppressed the signal on the oblique dendrite. In the presence of APV the suppression on the oblique dendrite did not occur. D, the suppression amplitude was plotted against the [Ca2+]i increase from the NMDA spike at a specific location, normalized to the amplitude of the bAP signal evoked at that location before the NMDA spike was generated. Larger reductions were measured at locations with the largest normalized NMDA spike-generated [Ca2+]i increases. The red line is the best fit to the data, with the line forced to 1.0 when the [Ca2+]i change was 0. Only experiments using 200 μm OGB-5N are included in the plot. E, summary (n = 5, NMDA spike; n = 5, Ca2+ wave). The time window for the suppression was similar on the oblique dendrites (NMDA spike) and on the apical shaft (Ca2+ wave). The amplitude of the bAP-evoked transients did not recover to initial values by the end of the 20 s trial. The dotted lines show the amplitudes of a series of bAPs evoked transients at 2 s intervals (normalized to the 1st transient) when there was no Ca2+ wave or NMDA spike. In both the apical dendrite (n = 5) and the oblique dendrite (n = 5) there was no change during the 20 s trial, showing that neither indicator bleaching, photodynamic damage nor change in bAP parameters had an effect on the transients during the trial period.
Suppression by Ca2+ entry through VGCCs
If [Ca2+]i increases from Ca2+ waves and from NMDA spikes can each suppress bAP Ca2+ signals then, perhaps, [Ca2+]i increases from other sources could also affect bAP Ca2+ signals. To test this hypothesis we generated [Ca2+]i increases by stimulating trains of bAPs. These spikes generate [Ca2+]i increases primarily by opening VGCCs (Markram et al. 1995; Sabatini et al. 2002). Figure 6A–C shows that both trains of bAPs at 100 Hz (Fig. 6A) or depolarizing pulses under voltage clamp (−70 to 0 mV for 2 s, Fig. 6B) were both effective in suppressing the Ca2+ signals from bAPs ∼30 μm from the soma. (The 2nd bAP signal was 83.7 ± 6.7% of the 1st bAP signal following trains of bAPs and 84.3 ± 2.4% following depolarizing pulses.) The magnitude of this suppression was not as great as the suppression generated by Ca2+ waves or NMDA spikes, consistent with the observation that these protocols did not generate the large [Ca2+]i increases evoked by Ca2+ waves or NMDA spikes. We confirmed that the source of Ca2+ in these experiments was not release from internal stores by repeating them in ACSF containing 1 μm thapsigargin, a blocker of the ER Ca2+-ATPase (Thastrup et al. 1990). In this solution the spike train still evoked a large [Ca2+]i increase and the 2nd spike signal was still suppressed (n = 4; data not shown). As a control for the effectiveness of thapsigargin we observed that a Ca2+ wave could not be generated and that the recovery time of the spike signal was increased (Markram et al. 1995).
Figure 6. Ca2+ entry through VGCCs suppresses bAP-evoked [Ca2+]i increases.
Aa, an experiment similar to the one in Fig. 5 except a train of intrasomatically evoked bAPs at 100 Hz was generated instead of a Ca2+ wave; the indicator was 50 μm OGB-1 and the 40× lens was used to view a larger field. Ab, a reduction in the bAP signal was detected at the dendritic ROI (a) 30 μm from the soma, but no change was detected 150 μm from the soma (ROI b). Amplitudes were determined by averaging responses 6–10 s after the spike train. Note the sharp transient during the train at the distal location (arrow) reflecting frequency-dependent spike backpropagation (see text). B, a similar experiment using a depolarizing step instead of the bAPs. A 2 s pulse from –70 to 0 mV was generated in voltage clamp mode. The amplitude of the bAP-evoked signals was reduced for at least 10 s. For quantitative measurements the signal at a time when the slow baseline recovered to resting level (arrow) was used. C, summary histogram of the experiments. Both the bAP train and the depolarizing pulse significantly suppressed the bAP signal 30 μm from the soma but there was no suppression from the train 150 μm from the soma (P < 0.05, two-tailed t test; n = 13). D, data (open squares and line) from experiments similar to those in Fig. 1 except that the control and test conditions were a train of 5 bAPs at 40 Hz. The suppression was proportional to the amplitude of the Ca2+ wave (normalized to the bAP signal measured at the same location) but not as great as the suppression of the signal from a single bAP (filled squares and line; data from Fig. 3C).
Interestingly, the train of bAPs did not suppress the spike-evoked [Ca2+]i increase ∼150 μm from the soma (Fig. 6A and C). Ca2+ signals at this distance (on both the distal and oblique dendrites) also were not suppressed by trains at 30 Hz or 63 Hz (data not shown). Most probably the lack of suppression at these locations results from the much smaller [Ca2+]i increase evoked by the train in distal locations. The smaller [Ca2+]i increase is a consequence of the smaller amplitude of individual bAPs in the dendrites (e.g. Spruston et al. 1995) and the frequency-dependent propagation failure of later bAPs in a train (Callaway & Ross, 1995; Spruston et al. 1995; Tsubokawa & Ross, 1997). Figure 6A shows evidence of this propagation failure since the [Ca2+]i increase rises to a plateau in the proximal location while there is an initial peak (arrow) that falls to a small plateau in the distal location. Since it takes several seconds for the dendritic amplitude of bAPs to recover to their initial value following a train (Spruston et al. 1995; Jung et al. 1997) we measured suppression 6–10 s after the end of the train.
If a train of bAPs can suppress the [Ca2+]i increase by a bAP generated 4 s after the train (Fig. 6A) then it is likely that a short train of bAPs can suppress the [Ca2+]i signal from a bAP generated immediately after the train, i.e. the Ca2+ entry from the last bAP in a train would be less than the Ca2+ entry from the first bAP in the train because the Ca2+ influx from earlier bAPs suppressed the Ca2+ influx from the later bAPs. The data in Fig. 6D support this hypothesis. The figure shows results from an experiment like that shown in Fig. 1 except two trains of five bAPs were evoked instead of single bAPs. The suppression of the signals from five bAPs by the Ca2+ wave was less than the suppression of the single bAP signals. Our interpretation is that early bAPs in the train suppressed the [Ca2+]i increase from later bAPs; this suppression then occluded some of the suppression by the Ca2+ wave. However, we have no additional evidence to support this hypothesis.
In other experiments we tried to develop a protocol to assay for suppression of bAP-evoked [Ca2+]i increases using caged calcium, which would have allowed testing at all dendritic locations. However, we found that caged calcium buffered the bAP signal to low amplitudes where it could not be measured reliably, so this approach was abandoned.
Suppression of subthreshold Ca2+ signals and localized Ca2+ release events
All these experiments tested protocols that suppressed the [Ca2+]i change caused by a bAP. These APs are known to open a variety of VGCCs in the dendrites (e.g. Magee & Johnston, 1995; Williams & Stuart, 2000; Yasuda et al. 2003) including some high threshold channels. However, there also is evidence that subthreshold depolarizations can cause [Ca2+]i increases, primarily by Ca2+ entry through an L-type Ca2+ channel (Magee et al. 1996; Manita & Ross, 2009). These subthreshold depolarization-evoked [Ca2+]i increases also were suppressed by Ca2+ waves (Fig. 7). These experiments suggest that the suppression mechanism acts, at least in part, on L-type channels (see below).
Figure 7. Ca2+ waves suppress the amplitude of subthreshold [Ca2+]i increases.
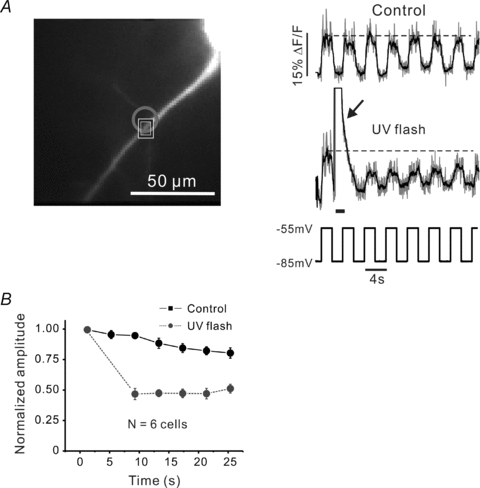
A, 2 s subthreshold depolarizing pulses (–85 to –55 mV in voltage clamp mode) generated small, persistent [Ca2+]i increases in the dendrites. Transient changes were detected on the top of the slow [Ca2+]i increases but not in the trough. Following the second pulse a UV flash (grey circle) generated a Ca2+ wave in the dendrites (arrow). The wave strongly reduced the slow signal and the number of transient changes at that location (black ROI) for more than 10 s after the wave. Indicator, 50 μm OGB-1. The data (grey traces) were filtered with a 5-point smoothing function (black traces) and the amplitudes of the steps were plotted for control conditions and following the UV flash. B, summary data from 6 cells. The Ca2+ wave clearly suppressed the amplitude of the subthreshold response.
A careful examination of the traces in Fig. 7A shows small, noise-like transients on the tops of the Ca2+ signals. These transients were more frequent when the membrane was depolarized, and were less frequent following the Ca2+ wave. These kinds of transients resemble the localized dendritic Ca2+ release events we previously described in these neurons (Manita & Ross, 2009). To more carefully examine the effects of Ca2+ waves on these events we selected dendrites where they occurred with relatively high frequency. The data in Fig. 8A and B show that the frequency and amplitude of these events were suppressed for about 30 s following synaptic generation of a Ca2+ wave. This suppression appears to resemble the suppression of the bAP-evoked signals described above. However, when we tried to suppress these events by raising [Ca2+]i with a long, high frequency train of bAPs (100 Hz for 1 s) we found no suppression (Fig. 8C and D). Together these experiments suggest that Ca2+ waves suppress the events by a different mechanism, probably by depleting the stores. Suppression of similar Ca2+ release events (‘sparks’) by store depletion has been described in cardiac myocytes (Lukyanenko et al. 1999).
Figure 8. Ca2+ waves but not trains of bAPs suppress the rate and amplitude of Ca2+ release events.
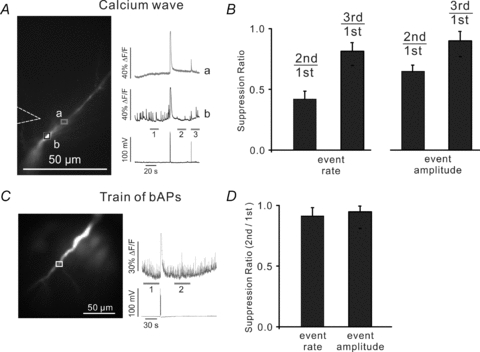
A, during a long recording localized [Ca2+]i increases were detected at one location in the dendrites (black ROI, b) but not at a nearby location (grey ROI, a). Indicator was 50 μm OGB-1. The mean rate and amplitude of the events in a 20 s period after the wave was less than before the wave. B, summary histogram of data from 8 experiments showing significant reductions in both parameters. C, similar experiments testing the effect of 100 bAPs at 100 Hz. There was no apparent effect on the rate or amplitude of the spontaneous events. D, summary histogram of data from 6 experiments showing no significant changes in either parameter.
Pharmacological insensitivity of suppression
VGCCs can be modulated by a variety of G-protein-coupled receptors and by phosphorylation (e.g. Catterall, 2000). They also are regulated by a direct feedback mechanism (Ca2+-dependent inactivation; CDI) when [Ca2+]i is elevated (Brehm & Eckert, 1978; Peterson et al. 1999; Budde et al. 2002; see Discussion). The proportionality of suppression to the magnitude of the preceding [Ca2+]i increase (Fig. 3), and the lack of a requirement for receptor activation (Figs 1B and 6), suggested that CDI might be the dominant mechanism. Nevertheless, we tested for the contribution of some other pathways with a variety of pharmacological experiments. Figure 9A shows a typical experiment. We first recorded the Ca2+ wave suppression of the bAP [Ca2+]i increase induced by uncaging IP3. The experiment was then repeated with the addition of 5 μm staurosporine (a broad spectrum kinase inhibitor) to the ACSF, with no change in the suppression (Fig. 9B). We found a similar insensitivity to FK-506 (a protein phosphatase 2B inhibitor), KN-62 (a CaM kinase II inhibitor), H-7 (another protein kinase inhibitor) and W-7 (an inhibitor of Ca2+–calmodulin-dependent phosphodiesterase and myosin light chain kinase). We also tested the possibility that endocannabinoid signalling might contribute to the suppression by adding AM-251 (a CB1 endocannabinoid receptor antagonist) to the ACSF, but found no change in the suppression (summarized in Fig. 9C). The lack of sensitivity to these pharmacological agents is consistent with CDI (see Discussion).
Figure 9. Suppression of bAP-evoked Ca2+ changes is insensitive to many pharmacological agents.
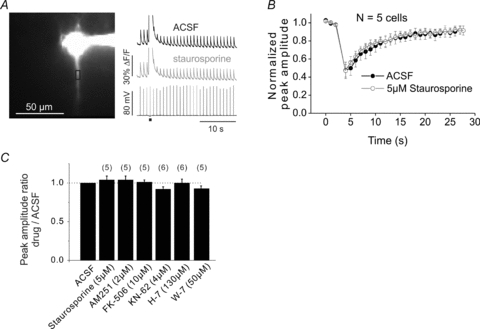
A, typical experiment. APs were evoked at 1 Hz and the [Ca2+]i increases were measured at a location in the dendrites. After the third AP a UV flash evoked a Ca2+ wave near that location and the amplitude of the bAP signals was suppressed for more than 10 s. The experiment was repeated in the presence of 5 μm staurosporine with no clear change in the profile of the Ca2+ signals. The amplitude of the Ca2+ wave in staurosporine (and in other drugs included in this figure) was within 10% of the amplitude in control conditions. B, the normalized peak amplitude was plotted for the both trials. For quantitative measurements amplitudes were determined 12 s after the wave when the residual amplitude recovered to baseline levels (Fig. 4B). Combined results of experiments on 5 cells showing that the bAP signal amplitude was unaffected by staurosporine at any time. C, summary histogram of experiments testing 7 conditions.
We made an attempt to determine if L-type Ca2+ channels were a specific target of the suppression mechanism. We found that incubating the slices in 20 μm nimodipine or 20 μm nifedipine had no effect on the [Ca2+]i increase from single bAPs or on the suppression of Ca2+ signals from single bAPs (n = 5). However, this finding does not eliminate the role of L-type channels since several groups (e.g. Mermelstein et al. 2000; Nakamura et al. 2000) reported that Ca2+ entry during APs is insensitive to these compounds, even though L-type channels are known to be in the membrane. This apparent insensitivity is probably due to the use dependence of these inhibitors (Helton et al. 2005). In other experiments we tested the effect of nifedipine (20 μm) on the suppression of subtheshold [Ca2+]i increases. These signals are generated, in part, by Ca2+ entry through L-type channels and are sensitive to nifedipine (Magee et al. 1996; Manita & Ross, 2009). However, the magnitude of these signals depends on the balance between Ca2+ entry and removal and is not directly interpreted as reflecting Ca2+ current. Therefore, we could not develop consistent, interpretable measurements from this protocol.
Enhancement of bAP signalling by Ca2+ waves
All the preceding experiments examined suppression of bAP Ca2+ transients by Ca2+ waves and others sources of large [Ca2+]i increases. However, we previously showed that bAPs could synergistically enhance the [Ca2+]i increase generated by mGluR-mediated synaptic activation if the bAP occurred within 0.5 s of synaptic stimulation (Nakamura et al. 1999; Manita & Ross, 2010; see also Rae et al. 2000; Wang et al. 2000). This enhancement is primarily due to the coincident activation of the IP3 receptor by IP3 and Ca2+ (e.g. Bezprozvanny et al. 1991). Interestingly, we could see many examples where both of these effects (suppression and enhancement) occurred at the same time in different locations in the dendrites. One experiment is shown in Fig. 10. A synaptic tetanus (100 Hz for 500 ms) generated a Ca2+ wave in the dendrites. This wave suppressed the following bAP-evoked [Ca2+]i increase (blue arrow) at a site at the centre of the wave (blue ROI). However, at the edges of the wave (orange and green ROIs) the bAP-evoked [Ca2+]i increase was enhanced (orange and green arrows). At a more proximal site (red ROI, about 30 μm from the soma) there was no change in the AP-evoked [Ca2+]i increase. The segregation of the different regions is shown more clearly in the pseudo line scan image. Similar patterns were observed when the Ca2+ waves were generated by uncaging IP3 (data not shown). Our interpretation of the enhancement is that some synaptically mobilized or uncaged IP3 spread in the dendrites beyond the limits of the regenerative Ca2+ wave. This peripheral IP3 did not cause Ca2+ release by itself, but could combine with the Ca2+ from the bAP to release a small amount of Ca2+, which supplemented the voltage-gated Ca2+ entry from the bAP (see also Fig. 4D in Manita & Ross, 2010). In most other experiments (e.g. Fig. 3B) we did not see this enhancement, probably because the second bAP was evoked several seconds after the Ca2+ wave, beyond the time window for evoking synergistic Ca2+ release.
Figure 10. Complex response to the interaction of synaptic stimulation and bAPs.
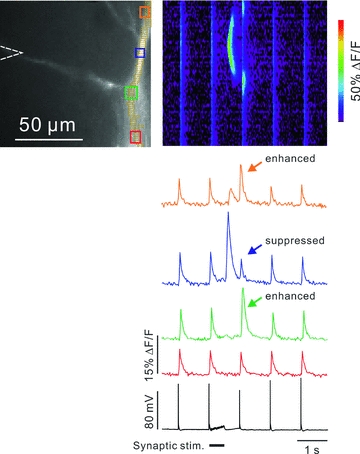
A train of bAPs at 1 Hz was generated with brief intrasomatic pulses. The soma was about 25 μm below the bottom of the cell image. After the 2nd bAP a 100 Hz synaptic tetanus was evoked for 0.5 s. The electrical responses measured with the somatic electrode were subthreshold for AP generation during the tetanus. Near the soma (red ROI) the detected [Ca2+]i changes (red trace) only showed signals from the bAPs. In the centre of the dendrite (blue ROI) a Ca2+ wave was generated, which spread about 20 μm in each direction. This wave suppressed the amplitude of the bAP signal (blue arrow) that immediately followed the wave. There was no suppression outside the range of the wave. At sites just at the edge of the wave (green and orange ROIs) the bAP signals were enhanced (green and orange arrows). Note that neither of these interactions was detected by the electrical recoding on the soma. Typical result for at least 5 cells, but not all cells showed this edge enhancement.
Discussion
There are two main results from these experiments. First, we found that large synaptically activated [Ca2+]i increases in the dendrites suppress VGCC Ca2+ signalling, generated either by bAPs or subthreshold depolarizations. The suppression was evoked either by Ca2+ waves or by NMDA spikes (Schiller et al. 2000). The Ca2+ wave-generated [Ca2+]i increases, mediated by mGluRs (Nakamura et al. 1999), also reduced the frequency and amplitude of spontaneous Ca2+ release events (Manita & Ross, 2009). These reductions probably result from depleting the stores supplying the Ca2+ for the release events since a comparable [Ca2+]i increase mediated by Ca2+ entry through VGCCs did not affect the localized events. However, we cannot rule out a contribution from the suppression of L-type VGCCs since this pathway affects the frequency of Ca2+ release events (Manita & Ross, 2009). We did not examine the effects of NMDA spikes on these events.
The NMDA spikes are generated primarily on the oblique and basal dendrites, while the IP3-mediated Ca2+ waves are generated primarily on the main apical dendrite. Therefore, these two sources of [Ca2+]i increases are produced in non-overlapping dendritic regions. The generation of the [Ca2+]i increase by Ca2+ waves or by NMDA spikes occurs through entirely different mechanisms. Therefore, it is likely that it is the [Ca2+]i increase, and not some ancillary signalling pathway, that is responsible for the suppression (see below). Consistent with this conclusion, large depolarizing pulses and trains of bAPs (Fig. 6) also caused suppression in some dendritic regions.
Complexity of Ca2+ signalling interactions
The second important observation is that there are additional components to the complexity in the interactions among different signalling mechanisms generating or suppressing Ca2+ signals in the dendrites. One previously reported example is experiments showing that Ca2+ entry through some VGCCs affects NMDA receptor Ca2+ entry indirectly by modulating SK-type K+ channels (Faber et al. 2005; Bloodgood & Sabatini, 2007). Also, pairing a single bAP with mGluR-mediated synaptic transmission synergistically enhanced the likelihood of generating a Ca2+ wave in the dendrites if the spike occurred within 0.5 s of the synaptic tetanus (Nakamura et al. 1999; Manita & Ross, 2010). This synergism is due to the coincident activation of the IP3 receptor by mGluR-mobilized IP3 and bAP-evoked Ca2+ entry. We also found that mGluR-mediated synaptic transmission and Ca2+ entry through L-type Ca2+ channels enhanced the frequency of localized Ca2+ release events (Manita & Ross, 2009).
In this paper we describe ways in which similar synaptic or voltage stimuli can suppress Ca2+ signalling. Whether enhancement or suppression occurs depends, primarily, on whether the stimulation evokes a large or small [Ca2+]i or IP3 increase, and sometimes on the spatial organization of the interacting signals. For example, we found (Fig. 10) that synaptic stimulation suppressed the bAP-evoked [Ca2+]i increase at some locations by inactivating Ca2+ channels but enhanced the increase at other locations by the synergistic effect of IP3 and Ca2+ when both signals occurred within a time window of 0.5 s (Manita & Ross, 2010).
Mechanism of suppression of bAP-evoked [Ca2+]i increase
There are several clues in our data concerning the mechanism responsible for suppression. The most important is that the suppression was proportional to the magnitude of the [Ca2+]i increase generated by the Ca2+ wave. All ways of raising [Ca2+]i appeared to be effective, ruling out signalling pathways that are activated only by Ca2+ waves, NMDA spikes or trains of bAPs. Second, the suppression was insensitive to several inhibitors of calmodulin-dependent kinases and phosphatases and was insensitive to AM251, a blocker of CB-1 endocannabinoid receptors. Both these properties are consistent with suppression due to Ca2+-dependent inactivation (CDI) of Ca2+ channels (Brehm & Eckert, 1978; Imredy & Yue, 1994; Dunlap, 2007; however, see Budde et al. 2002). This inactivation, which has been studied intensively at the molecular level, is mediated by calmodulin (Peterson et al. 1999; Zühlke et al. 1999). The lack of sensitivity to the inhibitors results from the tight binding of calmodulin to Ca2+ channels near the pore. CDI occurs in most, but not all, members of the high voltage-activated Cav1 and Cav2 channels, but is absent in the low voltage-activated Cav3 channels (Dunlap, 2007). One variation in our experiments from many studied forms of CDI is the long recovery time from suppression. We found that suppression persisted for 30–60 s and occasionally longer. Most electrophysiological studies of CDI describe shorter recovery times (Patil et al. 1998; Zühlke et al. 1999; Wang & Cohen, 2003). However, there are several reports of recovery times that match our experiments (Forsythe et al. 1998; Lee et al. 2000; Zeilhofer et al. 2000). The reasons for this variation are not understood.
Other aspects of our experiments also appear to be consistent with this mechanism. First, the suppression was observed in both apical and oblique dendrites, which requires that the targets for suppression are found in these regions. Our experiments did not determine which Ca2+ channels respond to the [Ca2+]i increase. However, previous work (Westenbroek et al. 1990; Magee & Johnston, 1995) found that all Ca2+ channel types are found in different dendritic regions although they are distributed unevenly. Second, the suppression of subthreshold potential-evoked [Ca2+]i increases appeared to be as strong as the suppression of bAP-evoked [Ca2+]i increases. Since L-type Ca2+ channels are activated near threshold in CA1 pyramidal neurons (Magee et al. 1996; Lipscombe et al. 2004; Manita & Ross, 2009) and are known targets for CDI (Dunlap, 2007), they are likely participants in this suppression, although we could not definitively make this determination.
Comparison with activity-dependent Ca2+ channel inactivation in spines
It is interesting to compare our results with those of Yasuda et al. (2003). Those investigators examined the depression of bAP-evoked [Ca2+]i increases in the dendrites and spines of oblique processes of CA1 pyramidal neurons caused by trains of bAPs. Using 2-photon microscopy to measure [Ca2+]i changes, they found about 30% depression in spines and no depression in the dendrites at locations that appeared to be more than 100 μm from the soma. The depression in spines lasted at least 30 min, was predominantly due to effects on R-type channels, required Ca2+ entry through L-type channels, and required activation of CaM KII since the effect was blocked by KN-62. Spine signal depression measured in Yasuda et al. (2003) was dependent on cyclic AMP-dependent protein kinase (PKA) since it was blocked by bath application of the PKA blocker Rp-cyclic adenosine monophosphorothioate (Rp-cAMPS).
The bAP signal suppression in our experiments has some different characteristics than the depression observed by Yasuda et al. (2003), in particular, the lack of pharmacological sensitivity. The most likely source of this difference is that our experiments mainly examined suppression in the primary apical dendrites, while they looked in the more distal and oblique dendrites. We looked in the proximal apical dendrites because Ca2+ waves are almost exclusively found in this region (Nakamura et al. 2002; see also Fig. 5A), and suppression by Ca2+ waves was the initial focus of our investigation. However, the vast majority of spines in pyramidal neurons are on the oblique and distal dendrites (Megias et al. 2001). Yasuda et al. (2003) found that several pharmacological agents affected suppression in the spines. We did not see these effects in our experiments since our pharmacological analysis was done on Ca2+ wave signals on the apical dendrites where there are few spines. The lack of pharmacological effects is reasonable for our experiments since most of our measured suppression was probably due to CDI, which is insensitive to the pharmacological agents. The spine suppression in their experiments was through a different mechanism.
The large [Ca2+]i change generated by the NMDA spike did cause suppression in the oblique dendrites, and the magnitude of this suppression was proportional to the normalized [Ca2+]i increase at the sites of suppression. However, we did not do a pharmacological analysis on these NMDA spike signals where the spine effects might have been noticed. It would be difficult to do these experiments since the inhibitors of calmodulin-dependent kinases and phosphatases would probably affect the generation of the NMDA spike itself. In addition, it was not possible to generate NMDA spikes of the same magnitude in successive trials, which would be a requirement for this kind of experiment. On the main shaft we could replace synaptic activation of the Ca2+ wave with a wave generated by uncaging IP3. This technique gave reproducible Ca2+ waves, which allowed the spike signals to be tested for pharmacological sensitivity.
Even though we were using a camera system that did not resolve spines from dendrites it is possible that we could have detected signs of spine depression on the oblique dendrites in the AP train experiments since spines comprise about 25% of the total volume of oblique dendrites (Katz et al. 2009; Y. Katz, personal communication). Our failure to detect this suppression probably reflects the fact that we were looking at locations with lower spine density, although we have no way of knowing if that was the case in our experiments.
One potential conflict with the results of Yasuda et al. (2003) is the suppression caused by a train of bAPs (Fig. 6A). We found suppression in the primary apical dendrites (∼30 μm from the soma) while they found no suppression on the dendrites from a comparable train. However, when we looked at distal or oblique dendrites, ∼150 μm from the soma, where Yasuda et al. (2003) did most of their experiments, we did not detect suppression on the dendrites, consistent with their results. The failure to cause suppression at this distance is probably because of the frequency-dependent propagation of bAPs into the dendrites (see Results). As noted above, we did detect suppression on the oblique dendrites from the NMDA spikes, but these spikes caused much larger [Ca2+]i changes than the train of bAPs at that location (Fig. 5B).
Functional implications
The suppression of bAP-evoked [Ca2+]i increases we observed could be evoked by several mechanisms. The greatest suppression was induced by the large [Ca2+]i increases generated by Ca2+ waves and NMDA spikes. While these events have not been detected in vivo under physiological conditions (possibly because the appropriate experiments have not been performed) they both can be induced in slices with moderate intensity (subthreshold for AP generation) tetanic synaptic stimulation – a protocol which is widely used in synaptic plasticity experiments. In addition, a clear but smaller suppression could be achieved with trains of bAPs, which are similar to bursts sometimes recorded in vivo (Hirase et al. 2001).
We can divide the potential consequences of the suppression of bAP-evoked [Ca2+]i increases into two components: suppression in spines and suppression in the parent dendrite. Within the spine the suppression may modulate the induction of LTP in the same way that Yasuda et al. (2003) previously demonstrated. Since Ca2+ waves and NMDA spikes generate substantially larger [Ca2+]i increases than trains of bAPs, this modulation could be even stronger following protocols that induce these events. However, these consequences remain speculative since we did not observe directly [Ca2+]i changes in spines.
The possible consequences of suppression in the main dendrites depend on those processes that are controlled by changes in [Ca2+]i in these regions. One candidate is the generation of endocannabinoids, which act on nearby interneurons to modulate synaptic inhibition and excitation (reviewed by Regehr et al. 2009). Diacylglycerol lipase, which catalyses the synthesis of this messenger in a Ca2+-dependent manner, is concentrated in the dendrites. Changes in bAP-evoked [Ca2+]i entry should modulate this synthesis. In addition, changes in membrane conductances that respond to [Ca2+]i increases, like SK and BK type K+ channels, obviously will be modulated by this suppression.
Acknowledgments
This work was supported in part by NIH grant NS-016295. We thank Nechama Lasser-Ross for computer programming and discussions.
Glossary
Abbreviations
- bAP
backpropagating action potential
- caged IP3
d-myo-inositol 1,4,5-trisphosphate, p4(5)-1-(2-nitrophenyl)ethyl ester
- CDI
calcium-dependent inhibition
- ROI
region of interest
- VGCC
voltage-gated calcium channel
Author contributions
S.M. and W.N.R. designed the experiments; S.M., K.M. and W.N.R. collected, analysed and interpreted the data; W.N.R. wrote the paper with contributions from S.M. and K.M. All authors approved the final version.
References
- Antic SD, Zhou WL, Moore AR, Short SM, Ikonomu KD. The decade of the dendritic NMDA spike. J Neurosci Res. 2010;88:2991–3001. doi: 10.1002/jnr.22444. [DOI] [PMC free article] [PubMed] [Google Scholar]
- Bezprozvanny I, Watras J, Ehrlich BE. Bell-shaped calcium-response curves of Ins(1,4,5)P3- and calcium-gated channels from endoplasmic reticulum of cerebellum. Nature. 1991;351:751–754. doi: 10.1038/351751a0. [DOI] [PubMed] [Google Scholar]
- Bloodgood BL, Sabatini BL. Nonlinear regulation of unitary synaptic signals by CaV2.3 voltage-sensitive calcium channels located in dendritic spines. Neuron. 2007;53:249–260. doi: 10.1016/j.neuron.2006.12.017. [DOI] [PubMed] [Google Scholar]
- Brager DH, Johnston D. Plasticity of intrinsic excitability during long-term depression is mediated through mGluR-dependent changes in Ih in hippocampal CA1 pyramidal neurons. J Neurosci. 2007;27:13926–13937. doi: 10.1523/JNEUROSCI.3520-07.2007. [DOI] [PMC free article] [PubMed] [Google Scholar]
- Brehm P, Eckert R. Calcium entry leads to inactivation of calcium channels in Paramecium. Science. 1978;202:1203–1206. doi: 10.1126/science.103199. [DOI] [PubMed] [Google Scholar]
- Budde T, Meuth S, Pape HC. Calcium-dependent inactivation of neuronal calcium channels. Nat Rev Neurosci. 2002;3:873–883. doi: 10.1038/nrn959. [DOI] [PubMed] [Google Scholar]
- Callaway JC, Ross WN. Frequency-dependent propagation of sodium action potentials in dendrites of hippocampal CA1 pyramidal neurons. J Neurophysiol. 1995;74:1395–1403. doi: 10.1152/jn.1995.74.4.1395. [DOI] [PubMed] [Google Scholar]
- Catterall WA. Structure and regulation of voltage-gated Ca2+ channels. Annu Rev Cell Dev Biol. 2000;16:521–555. doi: 10.1146/annurev.cellbio.16.1.521. [DOI] [PubMed] [Google Scholar]
- Dudman JT, Tsay D, Siegelbaum SA. A role for synaptic inputs at distal dendrites: instructive signals for hippocampal long-term plasticity. Neuron. 2007;56:866–879. doi: 10.1016/j.neuron.2007.10.020. [DOI] [PMC free article] [PubMed] [Google Scholar]
- Dunlap K. Calcium channels are models of self-control. J Gen Physiol. 2007;129:379–383. doi: 10.1085/jgp.200709786. [DOI] [PMC free article] [PubMed] [Google Scholar]
- El-Hassar L, Hagenston AM, D'Angelo LB, Yeckel MF. Metabotropic glutamate receptors regulate hippocampal CA1 pyramidal neuron excitability via Ca2+ wave-dependent activation of SK and TRPC channels. J Physiol. 2011;589:3211–3229. doi: 10.1113/jphysiol.2011.209783. [DOI] [PMC free article] [PubMed] [Google Scholar]
- Faber ES, Delaney AJ, Sah P. SK channels regulate excitatory synaptic transmission and plasticity in the lateral amygdala. Nat Neurosci. 2005;8:635–641. doi: 10.1038/nn1450. [DOI] [PubMed] [Google Scholar]
- Fan Y, Fricker D, Brager DH, Chen X, Lu HC, Chitwood RA, Johnston D. Activity-dependent decrease of excitability in rat hippocampal neurons through increases in Ih. Nat Neurosci. 2005;8:1542–1551. doi: 10.1038/nn1568. [DOI] [PubMed] [Google Scholar]
- Fernández de Sevilla D, Núñez A, Borde M, Malinow R, Buño W. Cholinergic-mediated IP3-receptor activation induces long-lasting synaptic enhancement in CA1 pyramidal neurons. J Neurosci. 2008;28:1469–1478. doi: 10.1523/JNEUROSCI.2723-07.2008. [DOI] [PMC free article] [PubMed] [Google Scholar]
- Forsythe ID, Tsujimoto T, Barnes-Davies M, Cuttle MF, Takahashi T. Inactivation of presynaptic calcium current contributes to synaptic depression at a fast central synapse. Neuron. 1998;20:797–807. doi: 10.1016/s0896-6273(00)81017-x. [DOI] [PubMed] [Google Scholar]
- Frick A, Magee J, Johnston D. LTP is accompanied by an enhanced local excitability of pyramidal neuron dendrites. Nat Neurosci. 2004;7:126–135. doi: 10.1038/nn1178. [DOI] [PubMed] [Google Scholar]
- Gordon U, Polsky A, Schiller J. Plasticity compartments in basal dendrites of neocortical pyramidal neurons. J Neurosci. 2006;26:12717–12726. doi: 10.1523/JNEUROSCI.3502-06.2006. [DOI] [PMC free article] [PubMed] [Google Scholar]
- Grover LM, Teyler TJ. Two components of long-term potentiation induced by different patterns of afferent activation. Nature. 1990;347:477–479. doi: 10.1038/347477a0. [DOI] [PubMed] [Google Scholar]
- Hagenston AM, Fitzpatrick JS, Yeckel MF. MGluR-mediated calcium waves that invade the soma regulate firing in layer V medial prefrontal cortical pyramidal neurons. Cereb Cortex. 2008;18:407–423. doi: 10.1093/cercor/bhm075. [DOI] [PMC free article] [PubMed] [Google Scholar]
- Helton TD, Xu W, Lipscombe D. Neuronal L-type calcium channels open quickly and are inhibited slowly. J Neurosci. 2005;25:10247–10251. doi: 10.1523/JNEUROSCI.1089-05.2005. [DOI] [PMC free article] [PubMed] [Google Scholar]
- Hirase H, Leinekugel X, Czurko A, Csicsvari J, Buzsaki G. Firing rates of hippocampal neurons are preserved during subsequent sleep episodes and modified by novel awake experience. Proc Natl Acad Sci U S A. 2001;98:9386–9390. doi: 10.1073/pnas.161274398. [DOI] [PMC free article] [PubMed] [Google Scholar]
- Holbro N, Grunditz A, Oertner TG. Differential distribution of endoplasmic reticulum controls metabotropic signaling and plasticity at hippocampal synapses. Proc Natl Acad Sci U S A. 2009;106:15055–15060. doi: 10.1073/pnas.0905110106. [DOI] [PMC free article] [PubMed] [Google Scholar]
- Hong M, Manita S, Ross WN. 2007 Abstract Viewer/Itinerary Planner. Washington, DC: Society for Neuroscience; 2007. Calcium waves generated by uncaging IP3 or synaptic stimulation evoke an apamin-sensitive AHP in the perisomatic region of hippocampal CA1 pyramidal neurons. Programme No. 786.6. [Google Scholar]
- Hong M, Ross WN. Priming of intracellular calcium stores in rat CA1 pyramidal neurons. J Physiol. 2007;584:75–87. doi: 10.1113/jphysiol.2007.137661. [DOI] [PMC free article] [PubMed] [Google Scholar]
- Imredy JP, Yue DT. Mechanism of Ca2+-sensitive inactivation of L-type Ca2+ channels. Neuron. 1994;12:1301–1318. doi: 10.1016/0896-6273(94)90446-4. [DOI] [PubMed] [Google Scholar]
- Jung HY, Mickus T, Spruston N. Prolonged sodium channel inactivation contributes to dendritic action potential attenuation in hippocampal pyramidal neurons. J Neurosci. 1997;17:6639–6646. doi: 10.1523/JNEUROSCI.17-17-06639.1997. [DOI] [PMC free article] [PubMed] [Google Scholar]
- Katz Y, Menon V, Nicholson DA, Geinisman Y, Kath WL, Spruston N. Synapse distribution suggests a two-stage model of dendritic integration in CA1 pyramidal neurons. Neuron. 2009;63:171–177. doi: 10.1016/j.neuron.2009.06.023. [DOI] [PMC free article] [PubMed] [Google Scholar]
- Kim J, Jung SC, Clemens AM, Petralia RS, Hoffman DA. Regulation of dendritic excitability by activity-dependent trafficking of the A-type K+ channel subunit Kv4.2 in hippocampal neurons. Neuron. 2007;54:933–947. doi: 10.1016/j.neuron.2007.05.026. [DOI] [PMC free article] [PubMed] [Google Scholar]
- Larkum ME, Nevian T, Sandler M, Polsky A, Schiller J. Synaptic integration in tuft dendrites of layer 5 pyramidal neurons: a new unifying principle. Science. 2009;325:756–760. doi: 10.1126/science.1171958. [DOI] [PubMed] [Google Scholar]
- Lasser-Ross N, Miyakawa H, Lev-Ram V, Young SR, Ross WN. High time resolution fluorescence imaging with a CCD camera. J Neurosci Methods. 1991;36:253–261. doi: 10.1016/0165-0270(91)90051-z. [DOI] [PubMed] [Google Scholar]
- Lee A, Scheuer T, Catterall WA. Ca2+/calmodulin-dependent facilitation and inactivation of P/Q-type Ca2+ channels. J Neurosci. 2000;20:6830–6838. doi: 10.1523/JNEUROSCI.20-18-06830.2000. [DOI] [PMC free article] [PubMed] [Google Scholar]
- Lipscombe D, Helton TD, Xu W. L-type calcium channels: the low down. J Neurophysiol. 2004;92:2633–2641. doi: 10.1152/jn.00486.2004. [DOI] [PubMed] [Google Scholar]
- Lukyanenko V, Subramanian S, Gyorke I, Wiesner TF, Gyorke S. The role of luminal Ca2+ in the generation of Ca2+ waves in rat ventricular myocytes. J Physiol. 1999;518:173–186. doi: 10.1111/j.1469-7793.1999.0173r.x. [DOI] [PMC free article] [PubMed] [Google Scholar]
- Magee JC, Avery RB, Christie BR, Johnston D. Dihydropyridine-sensitive, voltage-gated Ca2+ channels contribute to the resting intracellular Ca2+ concentration of hippocampal CA1 pyramidal neurons. J Neurophysiol. 1996;76:3460–3470. doi: 10.1152/jn.1996.76.5.3460. [DOI] [PubMed] [Google Scholar]
- Magee JC, Johnston D. Characterization of single voltage-gated Na+ and Ca2+ channels in apical dendrites of rat CA1 pyramidal neurons. J Physiol. 1995;487:67–90. doi: 10.1113/jphysiol.1995.sp020862. [DOI] [PMC free article] [PubMed] [Google Scholar]
- Major G, Polsky A, Denk W, Schiller J, Tank DW. Spatiotemporally graded NMDA spike/plateau potentials in basal dendrites of neocortical pyramidal neurons. J Neurophysiol. 2008;99:2584–2601. doi: 10.1152/jn.00011.2008. [DOI] [PubMed] [Google Scholar]
- Malenka RC, Nicoll RA. Long-term potentiation – a decade of progress? Science. 1999;285:1870–1874. doi: 10.1126/science.285.5435.1870. [DOI] [PubMed] [Google Scholar]
- Manita S, Ross WN. Synaptic activation and membrane potential changes modulate the frequency of spontaneous elementary Ca2+ release events in the dendrites of pyramidal neurons. J Neurosci. 2009;29:7833–7845. doi: 10.1523/JNEUROSCI.0573-09.2009. [DOI] [PMC free article] [PubMed] [Google Scholar]
- Manita S, Ross WN. IP3 mobilization and diffusion determine the timing window of Ca2+ release by synaptic stimulation and a spike in rat CA1 pyramidal cells. Hippocampus. 2010;20:524–539. doi: 10.1002/hipo.20644. [DOI] [PMC free article] [PubMed] [Google Scholar]
- Markram H, Helm PJ, Sakmann B. Dendritic calcium transients evoked by single back-propagating action potentials in rat neocortical pyramidal neurons. J Physiol. 1995;485:1–20. doi: 10.1113/jphysiol.1995.sp020708. [DOI] [PMC free article] [PubMed] [Google Scholar]
- Megías M, Emri Z, Freund TF, Gulyás AI. Total number and distribution of inhibitory and excitatory synapses on hippocampal CA1 pyramidal cells. Neuroscience. 2001;102:527–540. doi: 10.1016/s0306-4522(00)00496-6. [DOI] [PubMed] [Google Scholar]
- Mermelstein PG, Bito H, Deisseroth K, Tsien RW. Critical dependence of cAMP response element-binding protein phosphorylation on L-type calcium channels supports a selective response to EPSPs in preference to action potentials. J Neurosci. 2000;20:266–273. doi: 10.1523/JNEUROSCI.20-01-00266.2000. [DOI] [PMC free article] [PubMed] [Google Scholar]
- Miller LD, Petrozzino JJ, Golarai G, Connor JA. Ca2+ release from intracellular stores induced by afferent stimulation of CA3 pyramidal neurons in hippocampal slices. J Neurophysiol. 1996;76:554–562. doi: 10.1152/jn.1996.76.1.554. [DOI] [PubMed] [Google Scholar]
- Nakamura T, Barbara JG, Nakamura K, Ross WN. Synergistic release of Ca2+ from IP3-sensitive stores evoked by synaptic activation of mGluRs paired with backpropagating action potentials. Neuron. 1999;24:727–737. doi: 10.1016/s0896-6273(00)81125-3. [DOI] [PubMed] [Google Scholar]
- Nakamura T, Lasser-Ross N, Nakamura K, Ross WN. Spatial segregation and interaction of calcium signalling mechanisms in rat hippocampal CA1 pyramidal neurons. J Physiol. 2002;543:465–480. doi: 10.1113/jphysiol.2002.020362. [DOI] [PMC free article] [PubMed] [Google Scholar]
- Nakamura T, Nakamura K, Lasser-Ross N, Barbara JG, Sandler VM, Ross WN. Inositol 1,4,5-trisphosphate (IP3)-mediated Ca2+ release evoked by metabotropic agonists and backpropagating action potentials in hippocampal CA1 pyramidal neurons. J Neurosci. 2000;20:8365–8376. doi: 10.1523/JNEUROSCI.20-22-08365.2000. [DOI] [PMC free article] [PubMed] [Google Scholar]
- Patil PG, Brody DL, Yue DT. Preferential closed-state inactivation of neuronal calcium channels. Neuron. 1998;20:1027–1038. doi: 10.1016/s0896-6273(00)80483-3. [DOI] [PubMed] [Google Scholar]
- Peterson BZ, DeMaria CD, Adelman JP, Yue DT. Calmodulin is the Ca2+ sensor for Ca2+ -dependent inactivation of L-type calcium channels. Neuron. 1999;22:549–558. doi: 10.1016/s0896-6273(00)80709-6. [DOI] [PubMed] [Google Scholar]
- Power JM, Sah P. Distribution of IP3-mediated calcium responses and their role in nuclear signalling in rat basolateral amygdala neurons. J Physiol. 2007;580:835–857. doi: 10.1113/jphysiol.2006.125062. [DOI] [PMC free article] [PubMed] [Google Scholar]
- Rae MG, Martin DJ, Collingridge GL, Irving AJ. Role of Ca2+ stores in metabotropic L-glutamate receptor-mediated supralinear Ca2+ signaling in rat hippocampal neurons. J Neurosci. 2000;20:8628–8636. doi: 10.1523/JNEUROSCI.20-23-08628.2000. [DOI] [PMC free article] [PubMed] [Google Scholar]
- Regehr WG, Carey MR, Best AR. Activity-dependent regulation of synapses by retrograde messengers. Neuron. 2009;63:154–170. doi: 10.1016/j.neuron.2009.06.021. [DOI] [PMC free article] [PubMed] [Google Scholar]
- Reyes M, Stanton PK. Induction of hippocampal long-term depression requires release of Ca2+ from separate presynaptic and postsynaptic intracellular stores. J Neurosci. 1996;16:5951–5960. doi: 10.1523/JNEUROSCI.16-19-05951.1996. [DOI] [PMC free article] [PubMed] [Google Scholar]
- Sabatini BL, Maravall M, Svoboda K. Ca2+ signaling in dendritic spines. Curr Opin Neurobiol. 2001;11:349–356. doi: 10.1016/s0959-4388(00)00218-x. [DOI] [PubMed] [Google Scholar]
- Sabatini BL, Oertner TG, Svoboda K. The life cycle of Ca2+ ions in dendritic spines. Neuron. 2002;33:439–452. doi: 10.1016/s0896-6273(02)00573-1. [DOI] [PubMed] [Google Scholar]
- Sakmann B, Stuart G. Patch-pipette recordings from the soma, dendrites, and axon of neurons in brain slices. In: Sakmann B, Neher E, editors. Single Channel Recording. 2nd edn. New York: Plenum; 1995. pp. 199–211. [Google Scholar]
- Schiller J, Major G, Koester HJ, Schiller Y. NMDA spikes in basal dendrites of cortical pyramidal neurons. Nature. 2000;404:285–289. doi: 10.1038/35005094. [DOI] [PubMed] [Google Scholar]
- Spruston N, Schiller Y, Stuart G, Sakmann B. Activity-dependent action potential invasion and calcium influx into hippocampal CA1 dendrites. Science. 1995;268:297–300. doi: 10.1126/science.7716524. [DOI] [PubMed] [Google Scholar]
- Taufiq AM, Fujii S, Yamazaki Y, Sasaki H, Kaneko K, Li J, Kato H, Mikoshiba K. Involvement of IP3 receptors in LTP and LTD induction in guinea pig hippocampal CA1 neurons. Learn Mem. 2005;12:594–600. doi: 10.1101/lm.17405. [DOI] [PMC free article] [PubMed] [Google Scholar]
- Thastrup O, Cullen PJ, Drøbak BK, Hanley MR, Dawson AP. Thapsigargin, a tumor promoter, discharges intracellular Ca2+ stores by specific inhibition of the endoplasmic reticulum Ca2+-ATPase. Proc Natl Acad Sci U S A. 1990;87:2466–2470. doi: 10.1073/pnas.87.7.2466. [DOI] [PMC free article] [PubMed] [Google Scholar]
- Topolnik L, Chamberland S, Pelletier JG, Ran I, Lacaille JC. Activity-dependent compartmentalized regulation of dendritic Ca2+ signaling in hippocampal interneurons. J Neurosci. 2009;29:4658–4663. doi: 10.1523/JNEUROSCI.0493-09.2009. [DOI] [PMC free article] [PubMed] [Google Scholar]
- Tsubokawa H, Ross WN. Muscarinic modulation of spike backpropagation in the apical dendrites of hippocampal CA1 pyramidal neurons. J Neurosci. 1997;17:5782–5791. doi: 10.1523/JNEUROSCI.17-15-05782.1997. [DOI] [PMC free article] [PubMed] [Google Scholar]
- Walker JW, Somlyo AV, Goldman YE, Somlyo AP, Trentham DR. Kinetics of smooth and skeletal muscle activation by laser pulse photolysis of caged inositol 1,4,5-trisphosphate. Nature. 1987;327:249–252. doi: 10.1038/327249a0. [DOI] [PubMed] [Google Scholar]
- Wang HS, Cohen IS. Calcium channel heterogeneity in canine left ventricular myocytes. J Physiol. 2003;547:825–833. doi: 10.1113/jphysiol.2002.035410. [DOI] [PMC free article] [PubMed] [Google Scholar]
- Wang SS, Denk W, Häusser M. Coincidence detection in single dendritic spines mediated by calcium release. Nat Neurosci. 2000;3:1266–1273. doi: 10.1038/81792. [DOI] [PubMed] [Google Scholar]
- Westenbroek RE, Ahlijanian MK, Catterall WA. Clustering of L-type Ca2+ channels at the base of major dendrites in hippocampal pyramidal neurons. Nature. 1990;347:281–284. doi: 10.1038/347281a0. [DOI] [PubMed] [Google Scholar]
- Williams SR, Stuart GJ. Action potential backpropagation and somato-dendritic distribution of ion channels in thalamocortical neurons. J Neurosci. 2000;20:1307–1317. doi: 10.1523/JNEUROSCI.20-04-01307.2000. [DOI] [PMC free article] [PubMed] [Google Scholar]
- Yasuda R, Sabatini BL, Svoboda K. Plasticity of calcium channels in dendritic spines. Nat Neurosci. 2003;6:948–955. doi: 10.1038/nn1112. [DOI] [PubMed] [Google Scholar]
- Zeilhofer HU, Blank NM, Neuhuber WL, Swandulla D. Calcium-dependent inactivation of neuronal calcium channel currents is independent of calcineurin. Neuroscience. 2000;95:235–241. doi: 10.1016/s0306-4522(99)00434-0. [DOI] [PubMed] [Google Scholar]
- Zühlke RD, Pitt GS, Deisseroth K, Tsien RW, Reuter H. Calmodulin supports both inactivation and facilitation of L-type calcium channels. Nature. 1999;399:159–162. doi: 10.1038/20200. [DOI] [PubMed] [Google Scholar]