

Non-technical summary
To be effective, synaptic transmission requires precise alignment of the presynaptic terminal, releasing the neurotransmitter, with the postsynaptic density, where receptors are present at high density. Complex molecular mechanisms ensure this interplay between neurons and, in addition, stabilize receptors in the postsynaptic membrane. To explore these mechanisms at GABAergic synapses, which mediate inhibitory neurotransmission in the brain, we investigated here the consequences of ‘removing’ the receptors, using targeted gene deletion. Our results show that the receptors are dispensable for synapse formation, but are required for the postsynaptic aggregation of several proteins involved in receptor trafficking, anchoring and regulation. Defects in the molecular regulation of GABAergic synapses have been associated with neurodevelopmental disorders, mental retardation, anxiety and mood disorders, underscoring the relevance of fine tuning of GABAergic inhibition for proper brain function.
Abstract
Abstract
Pyramidal cells express various GABAA receptor (GABAAR) subtypes, possibly to match inputs from functionally distinct interneurons targeting specific subcellular domains. Postsynaptic anchoring of GABAARs is ensured by a complex interplay between the scaffolding protein gephyrin, neuroligin-2 and collybistin. Direct interactions between these proteins and GABAAR subunits might contribute to synapse-specific distribution of GABAAR subtypes. In addition, the dystrophin–glycoprotein complex, mainly localized at perisomatic synapses, regulates GABAAR postsynaptic clustering at these sites. Here, we investigated how the functional and molecular organization of GABAergic synapses in CA1 pyramidal neurons is altered in mice lacking the GABAAR α2 subunit (α2-KO). We report a marked, layer-specific loss of postsynaptic gephyrin and neuroligin-2 clusters, without changes in GABAergic presynaptic terminals. Whole-cell voltage-clamp recordings in slices from α2-KO mice show a 40% decrease in GABAergic mIPSC frequency, with unchanged amplitude and kinetics. Applying low/high concentrations of zolpidem to discriminate between α1- and α2/α3-GABAARs demonstrates that residual mIPSCs in α2-KO mice are mediated by α1-GABAARs. Immunofluorescence analysis reveals maintenance of α1-GABAAR and neuroligin-2 clusters, but not gephyrin clusters, in perisomatic synapses of mutant mice, along with a complete loss of these three markers on the axon initial segment. This striking subcellular difference correlates with the preservation of dystrophin clusters, colocalized with neuroligin-2 and α1-GABAARs on pyramidal cell bodies of mutant mice. Dystrophin was not detected on the axon initial segment in either genotype. Collectively, these findings reveal synapse-specific anchoring of GABAARs at postsynaptic sites and suggest that the dystrophin–glycoprotein complex contributes to stabilize α1-GABAAR and neuroligin-2, but not gephyrin, in perisomatic postsynaptic densities.
Introduction
Inhibitory neurotransmission mediated by GABAA receptors (GABAARs) is essential for emergence of behaviourally relevant fast and slow oscillations in cortical networks (Mann & Paulsen, 2007). As best studied in the hippocampus, morphologically and functionally specialized interneurons target distinct sites on principal cells to generate multiple modes of GABAergic inhibition (Klausberger & Somogyi, 2008). A striking example of such specialization is provided by perisomatic inhibition of pyramidal cells, mediated by two distinct types of basket cells, targeting the soma and proximal dendrites, and by axo-axonic cells, selectively innervating the axon initial segment (AIS) (Freund & Katona, 2007). The basket cells are distinguished by their firing mode (‘regular-spiking’ and ‘fast-spiking’) and expression of selective neurochemical markers – cholecystokinin (CCK), parvalbumin (PV), metabotropic receptors – and are driven by distinct afferents to differentially modulate principal cell firing (Freund, 2003).
In hippocampal (and cortical) pyramidal cells, diversity of GABAergic inputs is matched by expression of multiple GABAAR subtypes, distinguished by their constituent subunits (α1–α5, β1–β3, γ1–γ3, δ) (Fritschy & Mohler, 1995; Schwarzer et al. 2001), as well as functional and pharmacological properties. A fundamental distinction is drawn between phasic and tonic inhibition, mediated by postsynaptic and extrasynaptic GABAARs, respectively (Farrant & Nusser, 2005). The latter mainly comprise receptors containing α4 or α5 subunits (Glykys et al. 2008), whereas the former are mediated by receptors containing α1, α2, α3 and α5 subunits, along with β subunit variants and the γ2 subunit (Thomson & Jovanovic, 2010). Further, there is evidence for a segregation of GABAAR subtypes in various cell surface compartments (distal/proximal dendrites, soma, AIS). Initially, perisomatic input from regular-spiking CCK/cannabinoid receptor 1+ basket cell was suggested to target α2-GABAARs, whereas synapses from fast spiking PV+ basket cells contain α1-GABAARs (Nyiri et al. 2001). In contrast, pharmacological data indicated a predominance of α2-GABAAR-mediated inhibition in the perisomatic region and α1-GABAARs on distal apical dendrites (Prenosil et al. 2006). Finally, high sensitivity immunohistochemical analysis showed the presence of both α1 and α2 subunits in most perisomatic synapses (Kasugai et al. 2010). However, it is not known whether they are present in separate receptors or are co-assembled in pentameric α1–α2–βx–βx–γ2 configurations.
GABAARs are aggregated in GABAergic postsynaptic densities (PSDs) by interacting notably with the scaffolding protein gephyrin (Fritschy et al. 2008) and collybistin, a guanidine exchange factor activating cdc-42 (Poulopoulos et al. 2009; Saiepour et al. 2010). In turn, these proteins interact with the transmembrane molecule neuroligin-2 (NL2), which binds to presynaptic neurexins to form and maintain postsynaptic sites facing appropriate release sites (Südhof, 2008). Analysis of mutant mice lacking specific GABAAR α subunit variants revealed that the corresponding receptor subtype is not formed. Thus, absence of α1- or α3-GABAARs causes disruption of postsynaptic gephyrin clustering, whereas NL2 can be preserved (Kralic et al. 2006; Studer et al. 2006; Patrizi et al. 2008; Peden et al. 2008). Similar effects are seen in neurons from γ2-KO mice, in which postsynaptic accumulation of GABAARs is impaired (Brünig et al. 2002b). The mechanisms underlying these alterations are not understood, especially when considering the existence of stable interactions among constituent proteins of the GABAergic PSD.
Here, we investigated the molecular organization of perisomatic GABAergic synapses in the CA1 area of α2 subunit-knockout (α2-KO) mice with two specific goals: first, to determine the functional and morphological consequences of the loss of α2-GABAARs in perisomatic synapses; second, to explore the molecular heterogeneity of GABAergic PSDs in distinct synapses of CA1 pyramidal cells and its contribution to functional GABAergic transmission.
Methods
Animals
Experiments were conducted in accordance with internationally recognized guidelines on animal use and care (European Communities Council Directive of 24 November 1986; 86/609/EEC) and were approved by the cantonal veterinary office of Zurich. For morphological analysis, α2-KO mice generated at the Institute of Pharmacology and Toxicology of the University of Zurich were used. In brief, embryonic stem (ES) cells from mouse line C57BL/6N (source: Eurogentec, Seraing, Belgium) were transfected with a replacement-type targeting vector (PstI–NcoI fragment in Fig. 1A) and clones that have undergone homologous recombination were isolated. These ES cell clones were injected into blastocysts (by Polygene AG, Rümlang, Switzerland) and chimeras were obtained, one of which carried the mutation in the germ line. The Flippase Recognition Target (FRT)-flanked neomycin resistance marker cassette was eliminated by crossing with ACTFLPe mice (The Jackson Laboratory, Bar Harbor, ME, USA) and the FLPe transgene was subsequently bred out to obtain the floxed allele (Gabra2tm2.1Uru). The mutant mice were then crossed with Ella-cre mice (The Jackson Laboratory), in order to obtain a global α2-KO allele (Gabra2tm2.2Uru). Subsequently, the EIIa-cre transgene was bred out and the α2-KO allele was backcrossed on the C56BL/6J background for more than nine generations and maintained on a heterozygote background at the University of Zurich. For electrophysiology, the α2-KO mice were generated at the Merck Sharp & Dohme Research Laboratories, Harlow, UK as described previously (Dixon et al. 2008). Experiments were conducted on brain slices prepared from the first two generations of wild-type (WT) and α2-KO breeding pairs derived from the corresponding heterozygous +/− mice bred at the University of Dundee. All genotyping was performed by PCR analysis of tail/ear biopsies. In pilot experiments, we verified that the loss of α2 subunit immunoreactivity and alteration of gephyrin clustering occurred in both strains of α2-KO mice (not shown).
Figure 1. Characterization of α2-KO mice.
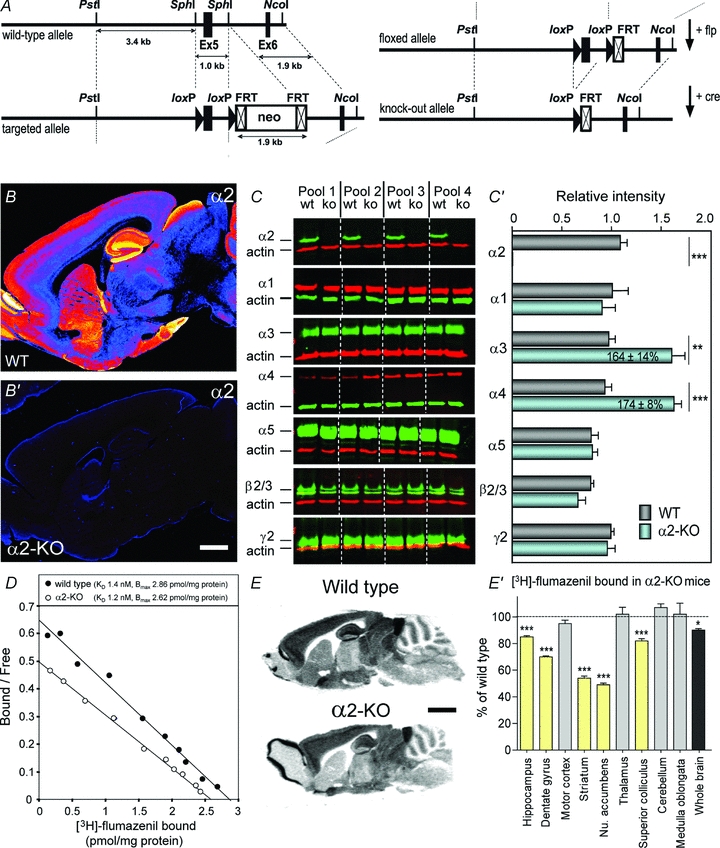
A, targeting scheme, showing the wild-type allele (upper left) and the targeted allele in ES cells (lower left). The targeting vector contained the genomic PstI–NcoI fragment. The location of the loxP sites, which are flanking exon 5, and of the FRT sites, which are flanking the neomycin resistance cassette (neo), are indicated. The floxed allele obtained after excision of the neomycin resistance marker (upper right) and the knock-out allele after excision of exon 5 (lower right) are shown. B–B′, confirmation of the absence of α2 subunit protein by immunohistochemistry; its differential regional distribution, depicted in false-colour in WT mice (upper panel), is completely abrogated in α2-KO mice (lower panel). C–C′, quantitative Western blot analysis of 7 major GABAAR subunits in α2-KO mice, showing the increase in α3 and α4 subunit protein; experiments were performed with four pools of whole brain membranes, using actin for signal normalization. Quantification of fluorescence signals (mean ± SEM) is given in the bar graph; **P < 0.01, ***P < 0.001, unpaired t test. D, Scatchard analysis of [3H]flumazenil binding to whole brain membranes reveals a moderate decrease in Bmax, but no change in KD in α2-KO mice (representative experiment repeated three times with distinct membrane preparations). E–E′, receptor autoradiograpy of [3H]flumazenil binding to adult brain sections demonstrating region-specific decrease in binding sites, maximally in striatum and nucleus accumbens; n = 4 per genotype; *P < 0.05, ***P < 0.001, one-way ANOVA, Tukey's post hoc comparison test. Scale bars: B, 300 μm; E, 500 μm.
Western blotting and ligand-binding analyses
For Western blot analysis and [3H]flumazenil binding, whole brain membranes were prepared from 10-week-old WT and α2-KO mice (4 pools, 6 mice per pool). Brain tissue was homogenized in 10 vol. 5 mm Tris pH 7.4 containing 0.32 m sucrose and centrifuged for 10 min at 1000 g. The crude membranes were recovered from the supernatant by centrifugation for 20 min at 30,000 g, washed twice with 50 mm Tris pH 7.4 and subjected to Western blot analysis or [3H]flumazenil binding.
For Western blotting, 20 μg membrane proteins per lane were resolved on 10% polyacrylamide gels and blotted onto nitrocellulose membranes. Membranes were incubated overnight at 4°C with antibodies directed against GABAAR subunits along with β-actin for normalization. Antibody signals were captured and quantified using the Odyssey infrared imaging system (Li-COR Biosciences).
Saturation binding experiments were performed by incubating whole brain membranes (50–100 μg protein) with increasing concentration of [3H]flumazenil (0.1–20 nm) for 90 min on ice followed by rapid filtration onto glass fibre filters and scintillation counting. Data were analysed using the program KELL for Windows 6.0.5 (Biosoft, Great Shelford, UK).
For receptor autoradiography, sagittal brain sections (12 μm) of WT and α2-KO mice were incubated for 120 min at 4°C with 6 nm[3H]flumazenil. After washing in 50 mm Tris pH 7.4 (three times for 20 s each) the sections were dried and apposed to a tritium-sensitive phosphoimaging screen (Cyclone Storage Phosphor Screen, PerkinElmer, Shelton, CT, USA). After 5 days of exposure, the screens were scanned and individual brain regions were quantified using the Optiquant software (PerkinElmer). [3H]-Micro scales (Amersham) were exposed in parallel and used as standards. Five mice per genotype and three to five brain sections of each mouse were analysed.
Tissue preparation
For regional distribution analysis and densitometry of GABAAR subunits and synaptic markers, adult mice of both sexes (2–3 months old) were anaesthetized with pentobarbital (Nembutal, 50 mg kg−1, i.p.), and perfusion fixed with 4% paraformaldehyde in 0.15 m sodium phosphate buffer, pH 7.4, as described (Fritschy & Mohler, 1995). Brain tissue was postfixed for 4 h, cryoprotected in 30% sucrose in phosphate-buffered saline (PBS), and frozen. Sections were cut at 40 μm with a sliding microtome, collected in PBS, and stored in antifreeze solution at –20°C until use.
For high resolution analysis of synaptic proteins, adult mice of both sexes (2–3 months old) were deeply anaesthetized with isoflurane and swiftly decapitated. The forebrain was dissected out and acute 300 μm-thick coronal slices were prepared with a Leica vibrating blade microtome (VT 1000S), placed in bubbled artificial cerebrospinal fluid (aCSF) for 30 min at 35°C and fixed by immersion in 4% paraformaldehyde at room temperature for 12 min, as described (Schneider Gasser et al. 2006). After fixation, slices were rinsed in PBS, cryoprotected in 30% buffered sucrose, frozen and sectioned with a cryostat. Sections were mounted on gelatinized slides and stored at –20°C.
Immunoperoxidase staining
Sections from perfusion-fixed brain were processed for immunoperoxidase staining as described (Fritschy & Mohler, 1995), using antibodies against the various α subunit variants expressed in the hippocampal formation (Table 1).
Table 1.
List of primary antibodies
| Target, | applications | Species | Company; cat. no. | References for specificity |
|---|---|---|---|---|
| α1 subunit | WB, IHC | Rabbit, guinea pig | Self-made | Fritschy et al. 2006; Kralic et al. 2006 |
| α2 subunit | WB, IHC | Guinea pig | Self-made | Marksitzer et al. 1993; Fritschy & Mohler, 1995; present study |
| α3 subunit | WB, IHC | Guinea pig | Self-made | Studer et al. 2006 |
| α4 subunit | WB, IHC | Rabbit | PhosphoSolutions; 844-GA4N | Peng et al. 2002; tested on tissue from α4-KO mice |
| α5 subunit | WB, IHC | Guinea pig | Self-made | Fritschy et al. 1998 |
| β2,3 subunits | WB | Mouse | Self-made; clone bd-17 | Ewert et al. 1990 |
| γ2 subunit | WB | Guinea pig | Self-made | Gunther et al. 1995 |
| Ankyrin G | IHC, EM | Mouse | Neuromab; N106/65 | Hedstrom et al. 2007 |
| Calbindin | IHC | Rabbit | Swant; CB-38 | Celio, 1990 |
| Calretinin | IHC | Rabbit | Swant; 7696 | Schwaller et al. 1993 |
| Dystrophin | IHC | Mouse | Anawa; clone 6C5; 3990–5005 | Knuesel et al. 1999 |
| Gephyrin | IHC, EM | Mouse | Synaptic Systems; mAb7a; 147011 | Feng et al. 1998 |
| Pan-Nav | IHC | Rabbit | Alomone Laboratories; ASC-003 | Lorincz & Nusser, 2008 |
| Neuroligin-2 | IHC, EM | Rabbit | Gift, P. Scheiffele | Budreck & Scheiffele, 2007 |
| nNOS | IHC | Rabbit | Alexis; 210–501-R025 | Fuentealba et al. 2008 |
| Parvalbumin | IHC, EM | Rabbit, mouse | Swant; PV-28 | Celio, 1990 |
| VGAT | IHC, EM | Rabbit | Synaptic Systems; 131003 | Fritschy et al. 2006 |
| VGLUT3 | IHC, EM | Guinea pig | Millipore; AB5421 | Fremeau et al. 2002 |
Images were digitized at low magnification at 8 bit image depth and displayed with a self-made look-up table (Fritschy & Mohler, 1995) maximizing differences in staining intensity between brain regions.
Immunofluorescence staining and confocal laser scanning microscopy
The laminar distributions of the GABAAR α1 and α2 subunits and gephyrin, NL2 and vesicular GABA transporter (VGAT) in the CA1 region were analysed in sections from perfusion-fixed brains processed for double- or triple-immunofluorescence staining. Detection of proteins clustered at postsynaptic sites was enhanced by mild pepsin digestion of the tissue, as described (Watanabe et al. 1998), performed immediately prior to incubation in primary antibodies. In brief, sections were rinsed in PBS, transferred to 0.15 mg mL−1 pepsin solution in 0.2 n HCl pre-warmed to 37°C, incubated for 10 min, and rinsed 3 times with PBS.
High sensitivity detection of synaptic proteins in perisomatic synapses was obtained in cryostat sections prepared from acute brain slices processed for triple immunofluorescence staining, as described (Schneider Gasser et al. 2006; Panzanelli et al. 2009), using various combinations of primary antibodies raised in different species (Table 1). All secondary antibodies were raised in goat and conjugated to Alexa488 (Molecular Probes), Cy3, or Cy5 (Jackson ImmunoResearch Laboratories, Inc., West Grove, PA, USA).
Images were acquired by confocal laser scanning microscopy (LSM 710 Zen, Zeiss) using sequential acquisition of separate wavelength channels to avoid fluorescence crosstalk. Stacks of 12–15 confocal sections (1024 × 1024 pixels; 50–90 nm pixel−1) spaced at 300–500 nm were acquired with a 63× oil-immersion objective (1.4 NA) with the pinhole set at 1 Airy unit. For display, images were processed with the image analysis software Imaris (Bitplane, Zurich, Switzerland).
Image analysis
Quantification of the number of clusters positive for the α1 and α2 subunit, gephyrin, NL2, and VGAT was performed in single 8-bit confocal images using the software ImageJ (NIH). Tissue was from perfusion-fixed mice (n = 3–4 per genotype and staining combination) and processed for pepsin pretreatment. Clusters were defined based on intensity (25–30% of maximal intensity) and size (minimal area, 0.1 μm2). Statistical analysis was performed with Student's unpaired t test (Prism; GraphPad, San Diego, CA, USA). The analysis of single and double labelled clusters was performed separately in the main dendritic layers. In the pyramidal cell layer and on the AIS, quantification was performed in images from cryostat sections obtained from acute brain slices. In the pyramidal cell layer, cluster density per surface area was assessed in single confocal images, whereas on the AIS, cluster density per unit length was assessed in 3D reconstructions from stacks of 12–15 images spanning a thickness of 3–4 μm. Data are reported as means ± SEM acquired from multiple images from at least three mice per genotype. Statistical analyses were performed using the Mann–Whitney test. All analyses were performed using Prism software.
Pre-embedding electron microscopic immunohistochemistry
Five WT and five α2-KO adult mice (2–4 months old, both sexes) were anaesthetized with pentobarbital (Nembutal, 50 mg kg−1, i.p.) and perfused with 4% paraformaldehyde and 0.1% glutaraldehyde in 0.1 m sodium phosphate buffer (pH 7.4). The brain was taken out, postfixed for 4 h, rinsed extensively in PBS and cut into 70 μm coronal sections with a vibrating blade microtome. The sections were cryoprotected with 30% sucrose and frozen and thawed three times to enhance the antibody penetration. Sections were blocked in 10% normal goat serum in Tris-buffered saline (TBS; pH 7.4), incubated with a mixture of two primary antibodies (Table 1) diluted in TBS and processed for immunogold labelling as described (Panzanelli et al. 2009), using secondary antibodies coupled to biotin for immunoperoxidase and to 1.4 nm colloidal gold particles (1:200, Nanoprobes, Yaphank, NY, USA). Following gold-toning, the sections were treated with 0.5% OsO4, and 1% uranyl acetate, dehydrated and embedded in Epon 812. Ultrathin sections were collected on copper single-hole grids and observed and photographed in a JEM-1010 transmission electron microscope (Jeol, Tokyo, Japan) equipped with a side-mounted CCD camera (Mega View III, Soft Imaging System, Münster, Germany).
Electrophysiology
Slice preparation
Hippocampal slices were prepared from mice of either sex (P17–24) according to standard protocols as previously described (Peden et al. 2008). Animals were killed by cervical dislocation in accordance with Schedule 1 of the UK Animals (Scientific Procedures) Act 1986. The brain was rapidly dissected and incubated with an ‘ice-cold’, oxygenated artificial cerebrospinal fluid (aCSF) solution which contained (in mm): 225 sucrose, 2.95 KCl, 1.25 NaH2PO4, 26 NaHCO3, 0.5 CaCl2, 10 MgSO4, 10 d-glucose, (pH 7.4; 330–340 mosmol l−1). Hippocampal coronal slices (300 μm thick) were cut using a vibrating blade microtome (Intracel, Royston, UK) and incubated at room temperature in an oxygenated aCSF containing (in mm): 126 NaCl, 2.5 KCl, 26 NaHCO3, 1.25 NaH2PO4, 0.5 CaCl2, 10 d-glucose, 10 MgSO4, 1 ascorbic acid and 3 sodium pyruvate (pH 7.4; 300–310 mosmol l−1), for a minimum of 1 h prior to experimentation.
Recording
An Axopatch 1D amplifier (Molecular Devices, Union City, CA, USA) was used to make whole-cell voltage-clamp recordings (holding potential = –60 mV), from hippocampal CA1 pyramidal neurons visually identified with an Olympus BX51 (Olympus, Southall, UK) microscope equipped with DIC/IR optics. All recordings were made at 35°C. The extracellular recording solution (ECS) contained (in mm): 126 NaCl, 2.95 KCl, 26 NaHCO3, 1.25 NaH2PO4, 2 CaCl2, 10 d-glucose, 2 MgCl2, kynurenic acid 2 and 0.5 μm tetrodotoxin (pH 7.4; 300–310 mosmol L−1). Recording electrodes were constructed from thick walled borosilicate glass (Garner Glass Co., Claremont, CA, USA) and had open tip resistances of 4–5 MΩ when containing an intracellular solution that comprised (in mm): 135 CsCl, 10 Hepes, 10 EGTA, 2 Mg-ATP, 1 CaCl2, 1 MgCl2, 5 QX-314 (pH 7.3 with CsOH, 300–305 mosmol L−1).
Drugs
Zolpidem (1 mm) was dissolved in DMSO to provide a concentrated (×1000) stock solution that was subsequently diluted in ECS to give the desired final bath concentration. The final maximum DMSO concentration (0.1%) had no effect on the properties of the mIPSCs. Zolpidem was applied via the perfusion system (2–4 mL min−1) and allowed to infiltrate the slice for a minimum period of 10 min before recordings were made in the presence of 100 nm of the drug. Having acquired sufficient mIPSCs (a minimum of 50 events – see below) for analysis, the slice was subsequently perfused with 1 μm zolpidem for a further 10 min before recording additional mIPSCs in the presence of this greater concentration of the drug. All drugs were obtained from either Tocris Bioscience or Sigma-Aldrich-RBI with the exception of TTX (TCS Biologicals Ltd, Buckingham, UK).
Data analysis
All recordings were analysed offline using the Strathclyde Electrophysiology Software (Electrophysiology Data Recorder (WinEDR) and Whole Cell analysis Program (WinWCP); courtesy of Dr J. Dempster, University of Strathclyde). Individual mIPSCs were detected using a low amplitude (–4 pA, 3 ms duration) threshold detection algorithm followed by visual scrutiny to avoid spurious detections. Analysis was restricted to events with a rise time ≤1 ms to minimize the contribution of dendritically generated currents, which are subject to cable filtering. Individual accepted events were analysed for peak amplitude, 10–90% rise time, charge transfer and time for such events to decay from their peak amplitude by 70% (T70). Subsequently, a minimum of 50 accepted events were digitally averaged by alignment at the mid-point of the rising phase. To such averaged mIPSCs a decay was fitted (98–5% of the peak amplitude) by utilizing either a mono-exponential (y(t) = Ae(−t/τ)), or a bi-exponential (y(t) = A1e(−t/τ1)+A2e(−t/τ2)) function using the least squares method, where A is amplitude, t is time and τ is the decay time constant. Analysis of the SD of residuals and use of the F test to compare goodness of fit revealed that the decay of the average mIPSC waveform was always best fit with the sum of two exponential components. Thus, a weighted decay time constant (τw) was also calculated according to the equation: τw = τ1P1+τ2P2, where τ1 and τ2 are the decay time constants of the first and second exponents and P1 and P2 are the proportions of the synaptic current decay described by each function. The mIPSC frequency was determined over a minimum of two separate 30 s recording periods with the Win EDR program using a detection method based on the rate of rise of the slowest events (35–40 pA ms−1) and subsequent visual scrutiny.
Results are reported as the arithmetic mean ± standard error of the mean (SEM). When data are presented as normalized, the mean value was calculated by averaging the normalized change for each cell following drug application. Statistical significance of the data was assessed with Student's t test (paired or unpaired), and repeated measures ANOVA (one- or two-way repeated measure ANOVA) followed post hoc by the Newman–Keuls test as appropriate, using the SigmaStat software package (Systat Software Inc., San Jose, CA, USA).
Results
Characterization of α2-KO mice
As reported previously (Vollenweider et al. 2011), α2-KO mice develop normally and have no obvious morphological phenotype. Since the mice were obtained by Cre-mediated recombination of the Gabra2 allele containing two LoxP sites (Fig. 1A), we first verified the absence of the α2 subunit protein by immunohistochemistry (Fig. 1B) and Western blotting, using whole brain extracts (Fig. 1C). These experiments confirmed the complete inactivation of Gabra2 in the CNS, as α2 subunit protein was undetectable with either technique, but Western blotting showed a 65–75% increase in α3 and α4 subunit protein levels (Fig. 1C). Additionally, radio-ligand binding analysis and autoradiography were performed to assess the effect of Gabra2 inactivation on the formation and distribution of benzodiazepine binding sites in adult brain. No change in KD for [3H]flumazenil was detected, whereas Bmax was reduced by 8 ± 0.5% (Fig. 1D). Autoradiography with [3H]flumazenil showed that the reduction in binding sites was most pronounced in regions enriched in α2 subunit immunoreactivity, notably striatum, nucleus accumbens and dentate gyrus (Fig. 1E). Averaged over the entire brain, the reduction was about 10%, in line with the radio-ligand binding experiment. Since α2-GABAARs represent at most 15% of [3H]flumazenil binding sites in adult brain (Marksitzer et al. 1993), these findings suggest limited compensation by other diazepam-sensitive GABAAR subtypes.
Immunohistochemical analysis of the four remaining α subunit variants expressed in forebrain showed only limited changes in protein levels and no alteration in regional distribution across the forebrain (Fig. 2A–D). In particular, we noted increased α5 subunit immunoreactivity in the hippocampus of α2-KO mice, but were unable to detect the increased α3 and α4 subunit expression observed by Western blotting (Fig. 1C). These discrepancies suggest that the increase in α5 subunit immunoreactivity might be restricted to the hippocampal formation, whereas the α3 and α4 subunit expression might be globally increased. Taken together, these findings indicate a moderate region-specific reduction of GABAAR in α2-KO mice, with only minor compensation by subtypes containing a different α subunit variant.
Figure 2. Morphological characterization of GABAergic components in α2-KO mice.

A–D, unaltered regional distribution of α subunit variants in the forebrain of α2-KO mice; each pair of images depicts in false colours (ranging from blue, background, to yellow-white for maximal intensity) a representative immunoperoxidase staining for the α1 (A), α3 (B), α4 (C) and α5 (D) subunit in adult WT and mutant mice. Note the moderate increase in α5 subunit staining in the hippocampus of α2-KO mice (arrow). E–I, GABAergic interneurons and presynaptic terminals are unaffected in α2-KO mice. E and F, representative illustrations of interneurons immunopositive for PV and nNOS in the CA1 area of WT and mutant mice, depicting their similar distribution and morphology (see Table 2 for quantification). G–G′, PV (red) and VGLUT3 (green) are distinct markers of two subsets of GABAergic terminals innervating CA1 pyramidal cell bodies, as shown in WT and α2-KO mice by triple staining with VGAT (blue). The boxed area in G′ is enlarged on the right in colour-separated images. H, representative example of the GABAergic innervation (VGAT+ teminal, red) of an AIS positive for ankyrin (green) in the CA1 region of an α2-KO mouse; sites of contact appear yellow. I–I′′, quantitative analysis of GABAergic presynaptic markers in CA1 in WT and mutant mice, revealing no significant effect of Gabra2 deletion (3 mice per genotype). I, density of VGAT+ terminals in the main dendritic layers and relative area covered by VGAT staining in the stratum pyramidale (SP); I′, density of PV and VGLUT3+ terminals in SP; I′′, density of VGAT+ terminals innervating the AIS. No difference between genotypes is evident for all these parameters. Abbreviations: SLM, stratum lacunosum-moleculare; SO, stratum oriens; SP, stratum pyramidale; SR, stratum radiatum. Scale bars, A–D: 500 μm; E and F, 50 μm; G, 10 μm; H, 2 μm.
To determine whether the deletion of Gabra2, which is expressed primarily in principal cells of the hippocampal formation, had an effect presynaptically on major populations of interneurons in CA1, we quantified the number of interneurons expressing the Ca2+-binding proteins PV, calbindin and calretinin, as well as nNOS, which collectively represent the vast majority of GABAergic cells in CA1. Although some differences were statistically significant, they were small in absolute terms (Table 2). Therefore, no major changes were observed in morphology or distribution of these interneurons in α2-KO mice (Fig. 2E and F; Table 2), indicating that none of these subpopulations were selectively affected during development.
Table 2.
Quantification of interneurons in CA1
| Stratum oriens | Stratum pyramidale | Stratum radiatum | |||||||
|---|---|---|---|---|---|---|---|---|---|
| WT | α2-KO | % WT | WT | α2-KO | % WT | WT | α2-KO | % WT | |
| Parvalbumin | 8.1 ± 0.6 | 8.9 ± 0.7 | 111 | 21.3 ± 0.8 | 21.9 ± 0.9 | 103 | 2.3 ± 0.3 | 2.7 ± 0.3 | 116.5 |
| Calbindin | 8.1 ± 1.1 | 10.9 ± 0.9 | 136* | 2.7 ± 0.5 | 3.7 ± 0.5 | 134 | 7.9 ± 0.7 | 10 ± 0.7 | 127.9* |
| Calretinin | 9.7 ± 0.7 | 11.4 ± 1 | 118* | 16.7 ± 1 | 23.1 ± 1.4 | 138.7* | 9.3 ± 0.8 | 8.3 ± 0.5 | 88.5 |
| nNOS | 10.6 ± 0.8 | 11.3 ± 0.7 | 106 | 24 ± 0.8 | 24.8 ± 0.8 | 103.2 | 22.5 ± 1.1 | 21.2 ± 1 | 94.6 |
The values indicate the number of interneurons (mean ± SD) counted on one side per 40 μm-thick coronal section in the three main layers of CA1 in WT and α2-KO mice.
Significantly different (P < 0.05; Mann–Whitney; n = 4 mice per genotype) between genotypes.
To determine whether perisomatic GABAergic terminals have a normal distribution, we used triple immunofluorescence staining for VGAT, PV and VGLUT3 (Fig. 2G–G′), which are markers distinguishing the two types of basket cells forming perisomatic synapses in CA1 (Freund & Katona, 2007). In both WT and α2-KO mice, these experiments confirmed the segregation of PV+ and VGLUT3+ terminals in two subpopulations of VGAT+ terminals, with a similar distribution around the pyramidal cell somata (Fig. 2G). Finally, to visualize axo-axonic synapses on the AIS of CA1 pyramidal cells, we used double staining for VGAT and ankyrin, a selective marker of AIS (and nodes of Ranvier) in adult brain (Rasband, 2010) (Fig. 2H).
Quantitative analysis of VGAT+ terminals in the main dendritic layers of CA1 revealed no difference between genotypes (Fig. 2I; n = 3 mice per genotype; P > 0.05, Mann–Whitney). In the pyramidal cell layer, the high density and elongated shape of VGAT+ terminals precluded determining their numbers, even in single confocal images. However, as measured by densitometry (intensity threshold 33% of maximal intensity), the relative surface area occupied by VGAT immunoreactivity remained unchanged (Fig. 2H′; n = 3 mice per genotype; P > 0.05, Mann–Whitney). Likewise, quantification of PV+ and VGLUT3+ cluster density in the pyramidal cell layer showed no genotype-related differences (Fig. 2I′). Finally, the average linear density of VGAT+ terminals apposed to AIS was similar in WT and α2-KO mice (Fig. 2I′′; n = 3 mice per genotype; P > 0.05, Mann–Whitney). Altogether, these results indicate that Gabra2 deletion has no effects on expression and distribution of neurochemical markers in GABAergic interneurons of CA1 and on the formation and subcellular targeting of GABAergic synapses innervating CA1 pyramidal cells.
α1-GABAAR-mediated synaptic inhibition in CA1 pyramidal cells from α2-KO mice
The impact of deleting the α2 subunit on the function of synaptic GABAARs was determined by comparing the properties of miniature inhibitory postsynaptic currents (mIPSCs) recorded from hippocampal CA1 neurons derived from WT and α2-KO mice. The deletion of the α2 subunit significantly reduced the frequency of mIPSCs (WT = 11 ± 1.3 Hz; α2-KO = 6.8 ± 0.6 Hz, n = 22 neurons for each genotype; P < 0.01, Student's unpaired t test – see Fig. 3 and Table 3), but this genetic manipulation had no significant effect on the mIPSC peak amplitude, or decay time (τW) (Fig. 3; Table 3). By contrast, equivalent recordings made from hippocampal dentate gyrus granule cells revealed the loss of the α2 subunit to result in a significant decrease of the mIPSC peak amplitude in comparison to WT (not shown).
Figure 3. Effect of Gabra2 deletion on GABAergic mIPSCs and their sensitivity to zolpidem in CA1 pyramidal cells.

A–A′, cumulative probability plot of the inter-event interval (IEI) values of all mIPSCs collected from WT and α2-KO CA1 pyramidal neurons (n = 22 neurons for each genotype). Note the rightward shift of the plot for α2-KO compared to WT neurons reflecting a reduced frequency of events for α2-KO neurons. A′, examples of whole-cell voltage-clamp recordings of mIPSCs obtained from a representative WT (black) and α2-KO (grey) CA1 pyramidal neuron (calibration bars: y = 20 pA, x = 0.1 s). The bar chart illustrates the mean frequency of mIPSCs recorded from WT (black) and α2-KO (grey) CA1 pyramidal neurons. Note the frequency of mIPSCs is significantly reduced for α2-KO neurons (P < 0.01, unpaired Student's t test). B–B′, cumulative probability plots of (i) the mIPSC decay time (expressed as the T70 – the time taken to decay from peak amplitude to 30% of that value) and (ii) the peak amplitude of all such events collected from CA1 neurons derived from WT and α2-KO mice (n = 22 neurons for each genotype). Note that for both parameters the plots for these genotypes are superimposed. The inset (B) illustrates the superimposed (normalized to the peak amplitude of the WT mIPSC) ensemble average of mIPSCs recorded from representative cells for each genotype (calibration bar: y = 10 pA, x = 10 ms). C, normalized (to control peak amplitude to facilitate comparison of their time course) ensemble averages of mIPSCs recorded from representative WT (left) and α2-KO (right) CA1 pyramidal neurons before and after the bath application of zolpidem (100 nm, red trace; 1 μm, blue trace). Note that the prolongation of the mIPSC decay following the bath application of 100 nm zolpidem is greater for the representative α2-KO neuron than for WT (scale bar: y = 10 pA, x = 10 ms). C′, a bar graph summarizing the effects of zolpidem (100 nm and 1 μm) upon the τW of averaged mIPSCs recorded from CA1 pyramidal neurons derived from WT (black) and α2-KO (grey) mice (n = 5 neurons per genotype) expressed as the percentage prolongation of τW. The increase of the mIPSC τW by 100 nm zolpidem is significantly greater in neurons derived from α2-KO mice than in WT (n = 5; *P < 0.05, two-way repeated measure ANOVA). In contrast, the effect of 1 μm zolpidem upon the mIPSC τW is similar for both genotypes (n = 5; P > 0.05, two-way RMA). NS: non-significant.
Table 3.
Properties of mIPSCs recorded from CA1 pyramidal neurons derived from WT and from α2-KO mice
| WT (n = 22) | α2-KO (n = 22) | |
|---|---|---|
| Peak amplitude (pA) | −71 ± 3 | −64 ± 3 |
| Rise time (ms) | 0.4 ± 0.1 | 0.4 ± 0.1 |
| τ70 (ms) | 7.9 ± 0.2 | 7.7 ± 0.3 |
| τW (ms) | 5.6 ± 0.2 | 5.8 ± 0.2 |
| Frequency (Hz) | 11 ± 1.3* | 6.8 ± 0.6* |
Significantly different between genotypes (P < 0.01 unpaired Student's t test). The n value refers to the number of CA1 neurons studied for each genotype.
To investigate the probable subunit composition of the synaptic GABAAR in the CA1 neurons of α2-KO mice, we compared for both genotypes the actions of two concentrations of zolpidem, 100 nm, which in a brain slice preparation is relatively selective for synaptic receptors incorporating the α1 subunit, and 1 μm, a concentration that will further influence synaptic α1-GABAARs, but that will additionally enhance the function of synaptic α2- and α3-GABAARs (Peden et al. 2008). For WT CA1 neurons, zolpidem (100 nm) produced a relatively modest prolongation of the mIPSC decay (τW = 21 ± 5% increase; n = 5), whereas for α2-KO neurons the drug was significantly (P < 0.05, two way repeated measure ANOVA) more effective in this respect (τW = 45 ± 5% increase; n = 5; Fig. 3).
By contrast, there was no significant (P > 0.05, two way repeated measure ANOVA) influence of the genotype on the effects of 1 μm zolpidem (WT: τW = 77 ± 8% increase, n = 5; α2-KO τW = 75 ± 8% increase, n = 5; Fig. 3). Considering the immunohistochemistry, a parsimonious interpretation of these data postulates that the greater effect of 100 nm zolpidem for α2-KO neurons reflects the dominance of α1-GABAARs expressed in the CA1 synapses of this genotype. For WT neurons, at the greater concentration of 1 μm the effects of zolpidem on synaptic receptors (particularly α2-GABAARs) produces an equivalent effect to that produced for α1- and potentially α3-GABAARs in the α2-KO neurons.
Layer-specific alteration of GABAergic postsynaptic markers in CA1
To determine the molecular substrate underlying preservation of mIPSCs in CA1 pyramidal cells, possibly mediated by α1-GABAARs, we examined immunohistochemically the distribution of GABAergic postsynaptic markers in the hippocampal formation of adult mice. Triple immunofluorescence staining for VGAT, the α2 subunit, and gephyrin or NL2 revealed that Gabra2 inactivation causes profound reduction of gephyrin and NL2 clustering at presumptive postsynaptic sites (Fig. 4A–C). Examination at high resolution revealed that in WT mice, gephyrin and NL2 were co-localized in individual clusters, most of which were triple-labelled for the α2 subunit (Fig. 4B), whereas in α2-KO mice, we detected the presence of double labelled gephyrin–NL2 clusters, as well as clusters positive for only gephyrin or NL2 (Fig. 4B′). Quantitative analysis in three to four mice per genotype showed that the reduction of gephyrin and NL2 clusters was layer specific, being more pronounced in stratum radiatum, pyramidale and oriens, and absent in stratum lacunosum-moleculare (Fig. 4C). Overall, the reduction was more severe for gephyrin than for NL2. Altogether, these results suggest that gephyrin and NL2 depend on α2-GABAARs in a layer-specific manner for postsynaptic clustering. Moreover, preservation of GABAergic mIPSCs in CA1 pyramidal cells points to the presence of additional GABAARs, possibly localized at postsynaptic sites independently of gephyrin and/or NL2.
Figure 4. Differential alterations in postsynaptic marker distribution in CA1 neurons of α2-KO mice, as analysed in dendritic layers (A–C) and on the soma (D–H).

A–A′, low magnification views depicting the profound loss of gephyrin clusters (green) and the preservation of VGAT+ presynaptic terminals. The pictures on the right depict at higher magnification the close apposition of gephyrin with VGAT+ terminals. B–B′, images from triple staining for gephyrin (green), NL2 (red) and the α2 subunit (blue), depicting the extensive colocalization of these three markers in the stratum radiatum (SR) of WT mice and the reduction of remaining gephyrin and NL2 clusters in mutants. C, quantification of cluster density for the four markers indicated, confirming the preservation of VGAT+ terminals and the differential loss of gephyrin and NL2 clusters in the three main dendritic layers of CA1. n = 3–4 mice per genotype; *P < 0.05, **P < 0.01, unpaired t test. D–D′, triple staining for the α2 subunit (green), α1 subunit (red), and gephyrin (blue) in the stratum pyramidale (SP), depicting their extensive colocalization (white) in WT mice and the preservation of α1 subunit-positive clusters in α2-KO mice, despite the loss of gephyrin clusters (replaced by large intracellular aggregates, arrowheads in D′). E–E′, triple fluorescence for the α1 subunit (green), NL2 (red), and gephyrin (blue) depicting their extensive colocalization in WT mice and the selective preservation of α1/NL2 in α2-KO mice, which contrasts with the partial loss of NL2 in the stratum oriens and radiatum (see C); boxed areas are shown below in colour-separated images, as indicated. F, quantification of cluster density in the pyramidal cell layer, confirming these visual impressions. Note, in particular, the significant decrease in gephyrin clusters and in α1 subunit clusters containing gephyrin (n = 3 mice per genotype; *P < 0.05, Mann–Whitney), as well as the large fraction of clusters stained for both α1 and α2 in WT mice (pink). G, co-localization of α1 and α2 subunit immunoreactivity (shown in yellow) in clusters apposed to PV+ terminals (blue) in WT mice. G′, in α2-KO mice, α1 subunit clusters (red) remain unaffected and are likewise apposed to PV+ terminals. H–H′, the apposition of α1 subunit clusters to PV+ and VGLUT3+ terminals is unaffected in α2-KO mice. Scale bars: A–A′, 50 μm; inset, 2 μm; B–B′, 2 μm; D–D′, 10 μm; E–E′, 20 μm; G–H, 10 μm.
To examine these issues more specifically, we focused on perisomatic GABAergic innervation of CA1 pyramidal cells, where most mIPSCs measured in whole-cell voltage clamp recordings are generated. We used triple immunofluorescence staining for the α1 and α2 subunit along with gephyrin or NL2 to confirm this anatomical arrangement, showing the vast majority of clusters on pyramidal cell bodies to be triple labelled in WT mice for either combination of antibodies (Fig. 4D–F). The extensive co-localization of α1 and α2 subunit clusters in perisomatic synapses suggested molecular heterogeneity of GABAARs in individual synapses, in line with a recent high resolution ultrastructural analysis (Kasugai et al. 2010).
In α2-KO mice, clusters positive for the α1 subunit appeared unaltered in number and morphology, contrasting with the profound loss of gephyrin immunoreactivity (Fig. 4D′). Further, as reported previously for other mutant mice lacking α subunit variants (Kralic et al. 2006; Studer et al. 2006), gephyrin formed large intracellular aggregates, suggestive of a disrupted interaction with proteins of the GABAergic postsynaptic density. While these results suggested preservation of α1-GABAARs clustering in the absence of gephyrin, examination of sections stained for the α1 subunit and NL2 revealed that NL2 clustering and immunoreactivity were not affected in perisomatic synapses of CA1 pyramidal cells in α2-KO mice (Fig. 4E′). These descriptive results were confirmed by quantitative analysis in three mice per genotype (Fig. 4F), pointing to molecular heterogeneity in GABAergic postsynaptic densities between the soma and dendrites of CA1 pyramidal cells, and indicating that gephyrin clustering can be lost from certain synapses without a concomitant alteration of NL2 subcellular localization.
Perisomatic inhibition is well known to originate from two distinct populations of basket cells: fast-spiking basket cells, recognized by expression of PV, and regular-spiking basket cells expressing calbindin and characterized by cannabinoid receptor 1 as well as VGLUT3 in their axon terminals (Freund & Katona, 2007). Therefore, we tested here whether the preservation of α1-GABAAR clusters in α2-KO mice is selective for one type of basket cells synapses. Triple immunofluorescence staining for the α1 and α2 subunit along with either PV or VGLUT3 (Fig. 4G-G′), or for the α1 subunit along with both presynaptic markers (Fig. 4H-H′) confirmed that both α1- and α2-GABAARs are present in perisomatic synapses on CA1 pyramidal cells (Kasugai et al. 2010), and that α1 subunit clusters are retained in both populations of synapses in α2-KO mice (Fig. 4G′ and H′).
To determine whether Gabra2 inactivation induces compensatory changes in GABAAR subtypes other than the α1-GABAAR, we investigated the distribution of the α3, α4 and α5 subunit in relation to VGAT and gephyrin (Supplemental Fig. 1). As reported previously (Brünig et al. 2002a), immunoreactivity for the α3 subunit was weak in CA1, except for a subset of interneurons in the stratum oriens, characterized by large postsynaptic sites strongly labelled for the α3 subunit and gephyrin. No change was observed in α2-KO mice, as shown in the CA1 pyramidal cell layer (Suppl. Fig. 1A–A′). The α4 and α5 subunits contribute to the formation of both extrasynaptic receptors mediating the bulk of tonic inhibition in CA1 (Prenosil et al. 2006; Glykys et al. 2008) and, for α5 only, to a subset of postsynaptic receptors (Serwanski et al. 2006; Thomson & Jovanovic, 2010). Accordingly, immunoreactivity for these subunits was only rarely colocalized with VGAT or gephyrin staining in either genotype (Suppl. Fig. 1B–C), and the α4 subunit staining remained unchanged (Suppl. Fig. 1B′). However, in line with the low resolution image shown in Fig. 2D, a moderate increase in α5 subunit immunoreactivity was observed in α2-KO mice (Suppl. Fig. 1C′), with a 50% increase in the number of α5 subunit puncta being apposed to a VGAT+ terminal (from 11.9 ± 2.6 in WT to 16.6 ± 2.9 clusters per 2500 μm2 in α2-KO mice; P < 0.05, unpaired t test). In the absence of gephyrin, the postsynaptic localization of these clusters could not be ascertained, but a partial compensation for the missing α2 subunit is possibly mediated by α5-GABAARs.
Stabilization of α1 subunit-positive clusters by dystrophin?
A characteristic feature of GABAergic synapses in cortical areas (including cerebral cortex, hippocampal formation, and cerebellar cortex) is the presence of dystrophin and its associated glycoprotein complex (DGC), notably in perisomatic synapses (reviewed in Haenggi & Fritschy, 2006). Previous work in mdx mutant mice lacking full length dystrophin has revealed a functionally relevant decrease in postsynaptic GABAAR clustering in hippocampus and cerebellum (Knuesel et al. 1999; Anderson et al. 2004; Vaillend et al. 2004). To explain the preservation of α1 subunit and NL2 clustering in α2-KO mice, we reasoned that the DGC might be involved in this process. In WT mice, triple staining experiments for dystrophin, NL2 and the α1 subunit revealed a nearly one-to-one colocalization of these markers in perisomatic synapses of CA1 pyramidal cells (Fig. 5A), as well as in the proximal stratum oriens, suggesting a preferential association of dystrophin with perisomatic GABAergic synapses. A majority of α2 subunit clusters in the pyramidal cell layer also contained dystrophin and NL2, except those apparently located on AIS (Fig. 5C). Taken together with the data shown in Fig. 4D and E, this result implies the presence of dystrophin, gephyrin and NL2, along with both α1 and α2 subunits in perisomatic synapses. In α2-KO mice, dystrophin staining was unaltered, and remained extensively clustered along with the α1 subunit and NL2 (Fig. 5B). Therefore, deletion of the α2 subunit impairs gephyrin clustering in these synapses, but not dystrophin or NL2, which remain associated with α1-GABAARs. Quantitative analysis confirmed that the density of dystrophin clusters, as well as the extent of their co-localization with the α1 subunit and NL2 clusters, was unchanged in the pyramidal cell layer of α2-KO mice (Fig. 5D).
Figure 5. Intact dystrophin, α1 subunit and NL2 clustering in perisomatic synapses of CA1 pyramidal cells in α2-KO mice.

A–A‴, triple immunofluorescence for the α1 subunit (green), dystrophin (red) and NL2 (blue) in WT mice, demonstrating the co-localization of these three proteins at presumptive perisomatic postsynaptic sites, as shown in a merged and in colour-separated images. B–B‴, preservation of α1 subunit (green), dystrophin (red) and NL2 (blue) clustering in CA1 pyramidal cells from α2-KO mice. C–C′, triple immunofluorescence for the α2 subunit (green), dystrophin (red), and NL2 (blue) in WT mice, illustrating the presence of dystrophin in a subset only of α2 subunit clusters; the arrow points to α2 subunit clusters surrounding a presumptive AIS devoid of dystrophin immunoreactivity. D, quantitative analysis of dystrophin cluster density and extent of colocalization with the α1/α2 subunit and NL2 in WT and α2-KO mice. No significant difference was detected statistically between genotypes (Mann–Whitney, n = 3 mice per genotype). Scale bars, 20 μm.
Loss of GABAergic postsynaptic markers in the AIS on pyramidal cells
To address the molecular composition of GABAergic postsynaptic sites on the AIS, we used either ankyrin staining in combination with α2 or α1 subunit and NL2, or a polyclonal rabbit antibody against voltage-gated Na+ channels (pan-Nav; Lorincz & Nusser, 2008; Table 1), along with gephyrin or dystrophin (Fig. 6).
Figure 6. Loss of GABAergic postsynaptic markers in the AIS of mutant CA1 pyramidal cells correlates with absence of dystrophin.

A–A′, triple staining for the α1 subunit (green), α2 subunit (red) and ankyrin (blue), illustrating the partial colocalization of α1 and α2 on the AIS in WT, and the reduction of these α1 subunit-positive clusters in α2-KO mice (upper panels); the lower panels show only α1 subunit and ankyrin staining, and the insets illustrate co-localized pixels (cyan) on selected AIS. B–B′, complete disappearance of gephyrin clusters on the AIS (stained with pan-Nav antibody) of α2-KO mice, along with the formation of large aggregates. C–C′, triple staining for the α2 subunit (red), NL2 (green) and ankyrin (blue), depicting the profound loss of α2/NL2 clusters on the AIS. D, example of α1/NL2 staining of ankyrin-positive AIS in α2-kO mice. E–E′, quantification of α1/α2 subunit clusters and α1/NL2 clusters on AIS (results are pooled from 3 mice per genotype). F–F′, absence of dystrophin clusters on the AIS in WT mice, as shown by triple staining with α2 and pan-Nav antibodies and illustrated in colour separated images. Scale bars: A and F, 20 μm; B–E, 10 μm.
In WT mice, a high density of GABAAR clusters was readily evident on the AIS, the majority of them containing the α2 subunit, either alone or together with the α1 subunit (Fig. 6A), matching the dense innervation of AIS by GABAergic terminals (Fig. 2H). Gephyrin and NL2 also formed clusters on the AIS, which, for unknown reasons, were less intensely stained than those located on the soma or dendrites (Fig. 6B and C). In α2-KO mice, despite the preservation of presynaptic terminals on the AIS (Fig. 2I′′), a profound loss of postsynaptic markers was evident: gephyrin clusters disappeared completely, being frequently replaced by a large aggregate located within the AIS (Fig. 6B′). The α1 subunit and NL2 clusters also were affected, although a fraction of them remained, with both markers typically being co-localized (Fig. 6A′, C′ and D). Quantitative analysis confirmed these visual observations: in WT mice, gephyrin cluster density reached 0.45 ± 0.21 clusters (μm AIS)−1; none were preserved in α2-KO mice. A less dramatic decrease was evident for the α1 subunit and NL2 (Fig. 6E–E′), but these results nevertheless revealed a fundamental difference between the soma and AIS for preservation of α1-GABAAR/NL2 clusters in α2-KO mice.
In contrast to gephyrin and NL2, dystrophin immunoreactivity was conspicuously absent from the AIS in WT mice, as shown by triple staining for voltage-gated Na+ channels (using pan-Nav antibody) and the α2 subunit in WT mice (Fig. 6F). In these images, the synapses on the AIS are clearly visible based on their selective α2 subunit labelling. The lack of dystrophin on the AIS might explain the loss of α1 subunit and NL2 clusters from these synapses in α2-KO mice. However, the mechanism contributing to retain a fraction of α1/NL2 clusters on the AIS of mutant CA1 pyramidal cells is not known.
Utrastructural preservation of GABAergic synapses in α2-KO mice
Finally, to confirm the synaptic localization of the markers used in this study, we performed a systematic ultrastructural analysis using pre-embedding immunoelectron microscopy in WT and α2-KO mice to qualitatively confirm our light microscopy data (Fig. 7). First, these studies showed that ultrastructural features of symmetric (GABAergic) synapses on pyramidal cell bodies and AIS were preserved in α2-KO mice (Fig. 7A and B). Next, using immunogold labelling for gephyrin with the monoclonal antibody mAb7a, we confirmed its selective postsynaptic localization at both perisomatic and axo-axonic synapses in WT mice (Fig. 7C) and its partial disappearance in α2-KO mice (Fig. 7F). Selectivity of the mutation was verified by examining GABAergic synapses onto PV+ dendritic profiles, in which gephyrin immunogold labelling was preserved in α2-KO mice (Fig. 7G–G′). Finally, we verified that VGLUT3 is a marker for a subset of GABAergic terminals, making synapses containing gephyrin (Fig. 7D) or NL2 (Fig. 7E).
Figure 7. Preservation of presynaptic terminals in perisomatic and axo-axonic synapses in CA1 neurons of α2-KO mice, and confirmation of the postsynaptic localization of gephyrin and NL2 in WT mice, as shown by immunoelectron microscopy.

In all panels, arrows point to the postsynaptic density of symmetric synapses, whereas ‘PC’ denotes pyramidal cell body profiles. A–A′, images from conventional EM depicting the typical morphology of perisomatic symmetric synapses in tissue from α2-KO mice. B, the GABAergic nature of such presynaptic profiles was confirmed by post-embedding immunogold labelling for GABA. C–C″, confirmation of the postsynaptic localization of gephyrin immunogold labelling in WT mice. D and E, identification of gephyrin and NL2 (immunogold labelling) in synapses made by VGLUT3+ terminals (immunoperoxidase) in WT mice. F, partial reduction of gephyrin immunogold labelling at postsynaptic sites in α2-KO mice, as shown in relation to PV+ terminals (immunoperoxidase). G–G′, preservation of gephyrin immunogold labelling in symmetric synapses of PV+ dendrites, belonging presumably to interneurons of α2-KO mice. Scale bars: A and B, 1 μm; C–G′, 500 nm.
Discussion
These results uncover unsuspected heterogeneity in the mechanisms aggregating α1- and α2-GABAARs, as well as gephyrin and NL2, in perisomatic and axo-axonic synapses of CA1 pyramidal cells, and suggest a role of the DGC for selectively anchoring NL2 and α1-GABAARs at postsynaptic sites. In particular, the 40% decrease in the frequency of mIPSCs recorded from CA1 pyramidal cells is likely to be due to loss of GABAARs at axo-axonic synapses, which are devoid of dystrophin. In contrast, perisomatic inhibition mediated by α1-GABAARs is largely preserved in α2-KO mice, despite severe disruption of the gephyrin postsynaptic scaffold. Since components of the DGC interact with neurexins and NL2 (Sugita et al. 2001; Sumita et al. 2007), we conclude that this protein complex plays a key role in the formation and maintenance of perisomatic GABAergic inhibition of CA1 pyramidal cells, selectively at synapses formed by basket cells, but not axo-axonic cells.
Consequences of the Gabra2 gene deletion
As shown for other GABAAR mutant mice (see Introduction), Gabra2 deletion causes loss of corresponding GABAAR subtypes across the entire CNS, without major remodelling of the regional expression pattern of the remaining subtypes. The absence of major compensations is evidenced by a reduced density of [3H]flumazenil binding sites, notably in the basal ganglia and dentate gyrus (Fig. 1). It is of note, however, that Gabra2 inactivation does not cause detectable alterations in brain cytoarchitecture, despite the fact that α2-GABAARs are expressed at high levels in the CNS during pre- and early postnatal ontogeny, notably until initiation of synaptogenesis (Fritschy et al. 1994; Paysan et al. 1997; Peden et al. 2008). Therefore, either GABAARs regulating neuronal (and network) maturation during ontogeny are redundant, or deletion of Gabra2 is compensated by functional adaptations that are not apparent in our morphological analysis.
Pharmacological manipulation of mIPSCs recorded from CA1 pyramidal cells by zolpidem strongly supports the contention that the bulk of perisomatic inhibition in α2-KO mice is mediated by α1-GABAARs. However, the lack of effect of Gabra2 deletion on mIPSC decay kinetics was somewhat unexpected, considering the abundant literature indicating that events mediated by α1-GABAARs are fast compared to α2-GABAARs. There are two possible explanations to this paradox. First, as we highlighted in the developing thalamus (Peden et al. 2008), additional mechanisms can contribute to shape the kinetics of α2-GABAARs. Alternatively, it is possible that many GABAARs in CA1 pyramidal cells contain both α2 and α1 subunits, and that the latter dominates the kinetics of these receptors. Therefore, replacing α2 by a second α1 subunit in receptors of mutant mice would have no apparent impact on the mIPSC decay. Both models are compatible with the change in zolpidem sensitivity observed in α2-KO mice, assuming that zolpidem sensitivity is governed by the α subunit variant located next to the γ2 subunit in the assembled receptor pentamer.
Our morphological analysis does not allow distinguishing between these alternatives. The extensive co-localization of α1 and α2 subunit clusters, along with gephyrin, NL2 and dystrophin, confirms ultrastructural findings (Kasugai et al. 2010) that both subunits are present in most perisomatic (but not axo-axonic) synapses. However, further discrimination within or between GABAARs is not feasible at this stage.
Several studies demonstrated functional and pharmacological impairments in α2-KO mice (Dixon et al. 2008, 2010; Vollenweider et al. 2011), which suggest altered function of specific neuronal circuits relevant for associative learning, emotional control and psychiatric disorders. In particular, our present results suggest that synchronization of pyramidal cell firing, which is strongly dependent on axo-axonic synapses (Cobb et al. 1995), might be impaired in α2-KO mice. Finally, the reported abolition of the anxiolytic effects of diazepam in α2-KO mice (Dixon et al. 2008) confirms previous results from mutants carrying α2-GABAARs that are functional, but pharmacologically non-responsive to diazepam (Löw et al. 2000).
Role of the DGC at GABAergic synapses
In view of the molecular heterogeneity of dystrophin, which is transcribed from multiple promoters, and of its associated glycoprotein complex (reviewed in Haenggi & Fritschy, 2006), it is very likely that the DGC has multiple, possibly synapse-specific functions (Perronnet & Vaillend, 2010; Pilgram et al. 2010). The DGC interacts directly with presynaptic neurexins (Sugita et al. 2001), and indirectly with NL2 (Sumita et al. 2007; Arancibia-Cárcamo & Kittler, 2009), suggesting a possible contribution to stabilization of these proteins at postsynaptic sites. The link to neurexins might be operant for activity-dependent stabilization of synaptic sites, governed by presynaptic terminals (Huang & Scheiffele, 2008). This hypothesis would provide an elegant explanation as to why dystrophin (and β-dystroglycan, a member of the DGC tethering dystrophin at the plasma membrane) remain clustered at GABAergic synapses in neurons from γ2-KO mice, lacking postsynaptic accumulation of GABAARs and gephyrin (Brünig et al. 2002b). Likewise, anchoring of the DGC to neurexins and NL2 might explain why in primary neuron cultures dystrophin and β-dystroglycan are localized only in postsynaptic sites innervated by GABAergic terminals, whereas GABAARs and gephyrin can be clustered at sites innervated by glutamatergic inputs (Brünig et al. 2002b; Levi et al. 2002). Therefore, the DGC might play a determinant role in specifying the localization and/or molecular identity of GABAergic synapses.
Owing to the size and complexity of the dystrophin gene, no ‘dystrophin-KO’ mouse is available for investigating directly its role in GABAergic synapse formation or molecular organization. Furthermore, one cannot exclude that interactions with NL2, gephyrin, or GABAARs involve members of the DGC rather than dystrophin itself, rendering the analysis of dystrophin mutants more complex.
The DGC is a major molecular determinant of perisomatic GABAergic PSDs
Analysis of NL2-deficient mice has unravelled NL2's key role in formation of perisomatic GABAergic synapses in the hippocampus (Poulopoulos et al. 2009) and dentate gyrus (Jedlicka et al. 2011). According to Poulopoulos et al. NL2 regulates collybistin's enzymatic activity by interacting with its SH3 domain and thereby facilitates subsynaptic tethering of gephyrin and formation of a postsynaptic scaffold for GABAAR. Along the same line, Papadopoulos et al. (2008) showed that collybistin is necessary for formation and maintenance of gephyrin and GABAAR postsynaptic clusters in CA1 pyramidal cells. These authors observed a profound loss of clusters stained for the γ2 subunit, which is present in both α1- and α2-GABAARs. Therefore, their results suggest that aggregation of both receptor subtypes requires functional collybistin in pyramidal cells. However, it remains so far unexplained why collybistin deficiency affects all GABAergic synapses in pyramidal cells whereas NL2 deficiency only impairs perisomatic sites. Our present results provide a possible answer. Together with biochemical evidence showing that synaptic scaffolding molecule (S-SCAM) forms a tight tripartite complex with NL2 and β-dystroglycan (Sumita et al. 2007), our results suggest that this protein complex is not altered in α2-KO mice and that postsynaptic NL2 clustering can occur without gephyrin. It is therefore well conceivable that this association of NL2 with S-SCAM and the DGC is a key step in the formation of perisomatic GABAergic PSDs, thereby explaining their loss in NL2-KO mice, whereas at GABAergic synapses devoid of DGC, NL2 might be replaced by another NL isoform in NL2-KO mice. In this context, it is important to note that in α1-KO mice, postsynaptic NL2 clusters remain unaltered and spatially associated with the DGC despite the complete ablation of GABAAR, as reported in Purkinje cells (Patrizi et al. 2008).
The analysis of mutant mice lacking the α1, α3, or γ2 subunit showed that postsynaptic accumulation of GABAARs is necessary for gephyrin clustering (see Introduction). In α2-KO mice, gephyrin clusters are disrupted at perisomatic synapses, despite the presence of α1-GABAARs, suggesting that their postsynaptic localization is regulated by direct interaction with the α2 subunit (Tretter et al. 2008). Originally, this interaction was thought to contribute to the targeting of α2-GABAARs to the AIS. Evidence for this possibility came from expression of chimeric α1 subunits carrying the intracellular loop of the α2 subunit, which were enriched in the AIS of CA1 pyramidal cells (Tretter et al. 2008). Moreover, recent data suggest that collybistin and gephyrin can form trimeric complexes with the α2-GABAAR, providing a molecular basis for a preferential partnership (Saiepour et al. 2010). Finally, the independence of gephyrin clustering from the DGC is in line with our previous observations that GABAAR clusters, but not gephyrin clusters, are reduced in size in mdx mice, which lack full-length dystrophin isoforms (Knuesel et al. 1999).
Exclusion of dystrophin from the AIS was unexpected, considering that dystrophin (and β-dystroglycan) interaction with ankyrin B and G in muscle cells is essential for maintenance of the neuromuscular junction and long-term cellular integrity (Ayalon et al. 2008). During ontogenesis, ankyrin G directs the formation of synapses on the AIS by means of interaction with neurofascin, as shown in Purkinje cells (Ango et al. 2004). It will be interesting to determine whether the selective perisomatic location of dystrophin is also regulated by ankyrin G-dependent interactions with another member of the cell-adhesion molecule family. In adult brain, neurofascin stabilizes GABAergic synapses on the AIS and regulates the size of gephyrin and GABAAR clusters in vivo, by a mechanism involving fibroblast growth factor receptor type 1 signalling (Kriebel et al. 2011). These selective interactions suggest that mechanisms regulating GABAergic PSD function are synapse specific, allowing for differential functional regulation of distinct neuronal circuits.
Taken together, our results demonstrate that multiple molecular mechanisms are operant in GABAergic PSDs ensuring separately the clustering of α1- and α2-GABAARs in concert with the DGC, NL2, gephyrin and collybistin. Alterations of these molecular machineries have been associated with neurodevelopmental disorders, mental retardation, anxiety and mood disorders, underscoring the relevance of fine tuning of perisomatic inhibition for proper brain function.
Acknowledgments
The study was supported by the Swiss National Science Foundation (grant 31003A_130495 to J.-M.F. and grant 31003A-125209 to P.S.), the ‘Compagnia di San Paolo’ and the World Wide Style Program (University of Turin). Studies in the D.B. and J.J.L. lab were in part funded by the MRC (G1000008). We are grateful to Ruth Keist for her role in the generation of α2-KO mice, Franziska Parpan for mouse genotyping, and Corinne Sidler, Thomas Grampp and Smitha Punnakkal for technical help.
Glossary
Abbreviations
- AIS
axon initial segment
- CCK
cholecystokin
- DGC
dystrophin glycoprotein complex
- GABAAR
GABAA receptor
- NL2
neuroligin-2
- PBS
phosphate-buffered saline
- PSD
postsynaptic densities
- PV
parvalbumin
- TBS
Tris-buffered saline
- VGAT
vesicular GABA transporter
- WT
wild-type
Author contributions
P.P., B.G.G., M.C.S., D.B. and S.K.T. performed and analysed experiments and contributed to the study design. P.S. and U.R. provided reagents and transgenic mice. D.B. and J.J.L. designed and analysed experiments, and contributed to the study design. J.-M.F. designed and conducted the study and wrote the manuscript. Morphological analyses were carried out at the University of Zurich (J.M.F. Lab) and electrophysiology at the University of Dundee (J.J.L. & D.B. Lab). All authors have approved the final version for publication.
Supplementary material
Suppl. Figure 1
As a service to our authors and readers, this journal provides supporting information supplied by the authors. Such materials are peer-reviewed and may be re-organized for online delivery, but are not copy-edited or typeset. Technical support issues arising from supporting information (other than missing files) should be addressed to the authors
References
- Anderson JL, Head SI, Morley JW. Long-term depression is reduced in cerebellar Purkinje cells of dystrophin-deficient mdx mice. Brain Res. 2004;1019:289–292. doi: 10.1016/j.brainres.2004.06.011. [DOI] [PubMed] [Google Scholar]
- Ango F, Di Cristo G, Higashiyama H, Bennett V, Wu P, Huang ZJ. Ankyrin-based subcellular gradient of neurofascin, an immunoglobulin family protein, directs GABAergic innervation at Purkinje axon initial segment. Cell. 2004;119:257–272. doi: 10.1016/j.cell.2004.10.004. [DOI] [PubMed] [Google Scholar]
- Arancibia-Cárcamo IL, Kittler JT. Regulation of GABAA receptor membrane trafficking and synaptic localization. Pharmacol Ther. 2009;123:17–31. doi: 10.1016/j.pharmthera.2009.03.012. [DOI] [PubMed] [Google Scholar]
- Ayalon G, Davis JQ, Scotland PB, Bennett V. An ankyrin-based mechanism for functional organization of dystrophin and dystroglycan. Cell. 2008;135:1189–1200. doi: 10.1016/j.cell.2008.10.018. [DOI] [PubMed] [Google Scholar]
- Brünig I, Scotti E, Sidler C, Fritschy JM. Intact sorting, targeting, and clustering of γ-aminobutyric acid A receptor subtypes in hippocampal neurons in vitro. J Comp Neurol. 2002a;443:43–45. doi: 10.1002/cne.10102. [DOI] [PubMed] [Google Scholar]
- Brünig I, Suter A, Knuesel I, Luscher B, Fritschy JM. GABAergic presynaptic terminals are required for postsynaptic clustering of dystrophin, but not of GABAA receptors and gephyrin. J Neurosci. 2002b;22:4805–4813. doi: 10.1523/JNEUROSCI.22-12-04805.2002. [DOI] [PMC free article] [PubMed] [Google Scholar]
- Budreck EC, Scheiffele P. Neuroligin-3 is a neuronal adhesion protein at GABAergic and glutamatergic synapses. Eur J Neurosci. 2007;26:1738–1748. doi: 10.1111/j.1460-9568.2007.05842.x. [DOI] [PubMed] [Google Scholar]
- Celio MR. Calbindin D-28k and parvalbumin in the rat nervous system. Neuroscience. 1990;35:375–475. doi: 10.1016/0306-4522(90)90091-h. [DOI] [PubMed] [Google Scholar]
- Cobb SR, Buhl EH, Halasy K, Paulsen O, Somogyi P. Synchronization of neuronal activity in hippocampus by individual GABAergic interneurons. Nature. 1995;378:75–78. doi: 10.1038/378075a0. [DOI] [PubMed] [Google Scholar]
- Dixon CI, Morris HV, Breen G, Desrivieres S, Jugurnauth S, Steiner RC, Vallada H, Guindalini C, Laranjeira R, Messas G, Rosahl TW, Atack JR, Peden DR, Belelli D, Lambert JJ, King SL, Schumann G, Stephens DN. Cocaine effects on mouse incentive-learning and human addiction are linked to α2 subunit-containing GABAA receptors. Proc Natl Acad Sci U S A. 2010;107:2289–2294. doi: 10.1073/pnas.0910117107. [DOI] [PMC free article] [PubMed] [Google Scholar]
- Dixon CI, Rosahl TW, Stephens DN. Targeted deletion of the GABRA2 gene encoding α2-subunits of GABAA receptors facilitates performance of a conditioned emotional response, and abolishes anxiolytic effects of benzodiazepines and barbiturates. Pharmacol Biochem Behav. 2008;90:1–8. doi: 10.1016/j.pbb.2008.01.015. [DOI] [PubMed] [Google Scholar]
- Ewert M, Shivers BD, Luddens H, Mohler H, Seeburg PH. Subunit selectivity and epitope characterization of mAbs directed against the GABAA/benzodiazepine receptor. J Cell Biol. 1990;110:2043–2048. doi: 10.1083/jcb.110.6.2043. [DOI] [PMC free article] [PubMed] [Google Scholar]
- Farrant M, Nusser Z. Variations on an inhibitory theme: Phasic and tonic activation of GABAA receptors. Nat Rev Neurosci. 2005;6:215–229. doi: 10.1038/nrn1625. [DOI] [PubMed] [Google Scholar]
- Feng G, Tintrup H, Kirsch J, Nichol MC, Kuhse J, Betz H, Sanes JR. Dual requirement for gephyrin in glycine receptor clustering and molybdoenzyme activity. Science. 1998;282:1321–1324. doi: 10.1126/science.282.5392.1321. [DOI] [PubMed] [Google Scholar]
- Fremeau RT, Burman J, Qureshi T, Tran CH, Proctor J, Johnson JA, Zhang H, Sulzer D, Copenhagen DR, Storm-Mathisen J, Reimer RJ, Chaudhry FA, Edwards RH. The identification of vesicular glutamate transporter 3 suggests novel modes of signaling by glutamate. Proc Natl Acad Sci U S A. 2002;99:14488–14493. doi: 10.1073/pnas.222546799. [DOI] [PMC free article] [PubMed] [Google Scholar]
- Freund TF. Interneuron diversity series: rhythm and mood in perisomatic inhibition. Trends Neurosci. 2003;26:489–495. doi: 10.1016/S0166-2236(03)00227-3. [DOI] [PubMed] [Google Scholar]
- Freund TF, Katona I. Perisomatic inhibition. Neuron. 2007;56:33–42. doi: 10.1016/j.neuron.2007.09.012. [DOI] [PubMed] [Google Scholar]
- Fritschy JM, Harvey RJ, Schwarz G. Gephyrin, where do we stand, where do we go? Trends Neurosci. 2008;31:257–264. doi: 10.1016/j.tins.2008.02.006. [DOI] [PubMed] [Google Scholar]
- Fritschy JM, Johnson DK, Mohler H, Rudolph U. Independent assembly and subcellular targeting of GABAA receptor subtypes demonstrated in mouse hippocampal and olfactory neurons in vivo. Neurosci Lett. 1998;249:99–102. doi: 10.1016/s0304-3940(98)00397-8. [DOI] [PubMed] [Google Scholar]
- Fritschy JM, Mohler H. GABAA-receptor heterogeneity in the adult rat brain: differential regional and cellular distribution of seven major subunits. J Comp Neurol. 1995;359:154–194. doi: 10.1002/cne.903590111. [DOI] [PubMed] [Google Scholar]
- Fritschy JM, Panzanelli P, Kralic JE, Vogt KE, Sassoè-Pognetto M. Differential dependence of axo-dendritic and axo-somatic GABAergic synapses on GABAA receptors containing the α1 subunit in Purkinje cells. J Neurosci. 2006;26:3245–3255. doi: 10.1523/JNEUROSCI.5118-05.2006. [DOI] [PMC free article] [PubMed] [Google Scholar]
- Fritschy JM, Paysan J, Enna A, Mohler H. Switch in the expression of rat GABAA-receptor subtypes during postnatal development: an immunohistochemical study. J Neurosci. 1994;14:5302–5324. doi: 10.1523/JNEUROSCI.14-09-05302.1994. [DOI] [PMC free article] [PubMed] [Google Scholar]
- Fuentealba P, Begum R, Capogna M, Jinno S, Márton LF, Csicsvari J, Thomson A, Somogyi P, Klausberger T. Ivy cells: a population of nitric-oxide-producing, slow-spiking GABAergic neurons and their involvement in hippocampal network activity. Neuron. 2008;57:917–929. doi: 10.1016/j.neuron.2008.01.034. [DOI] [PMC free article] [PubMed] [Google Scholar]
- Glykys J, Mann EO, Mody I. Which GABAA receptor subunits are necessary for tonic inhibition in the hippocampus? J Neurosci. 2008;28:1421–1426. doi: 10.1523/JNEUROSCI.4751-07.2008. [DOI] [PMC free article] [PubMed] [Google Scholar]
- Gunther U, Benson J, Benke D, Fritschy JM, Reyes GH, Knoflach F, Crestani F, Aguzzi A, Arigoni M, Lang Y, Bluethmann H, Mohler H, Luscher B. Benzodiazepine-insensitive mice generated by targeted disruption of the γ2-subunit gene of γ-aminobutyric acid type A receptors. Proc Natl Acad Sci U S A. 1995;92:7749–7753. doi: 10.1073/pnas.92.17.7749. [DOI] [PMC free article] [PubMed] [Google Scholar]
- Haenggi T, Fritschy JM. Role of dystrophin and utrophin for assembly and function of the dystrophin glycoprotein complex in non-muscle tissue. Cell Mol Life Sci. 2006;63:1614–1631. doi: 10.1007/s00018-005-5461-0. [DOI] [PMC free article] [PubMed] [Google Scholar]
- Hedstrom KL, Xu X, Ogawa Y, Frischknecht R, Seidenbecher CI, Shrager P, Rasband MN. Neurofascin assembles a specialized extracellular matrix at the axon initial segment. J Cell Biol. 2007;178:875–886. doi: 10.1083/jcb.200705119. [DOI] [PMC free article] [PubMed] [Google Scholar]
- Huang ZJ, Scheiffele P. GABA and neuroligin signaling: linking synaptic activity and adhesion in inhibitory synapse development. Cur Opin Neurobiol. 2008;18:77–83. doi: 10.1016/j.conb.2008.05.008. [DOI] [PMC free article] [PubMed] [Google Scholar]
- Jedlicka P, Hoon M, Papadopoulos T, Vlachos A, Winkels R, Poulopoulos A, Betz H, Deller T, Brose N, Varoqueaux F, Schwarzacher SW. Increased dentate gyrus excitability in neuroligin-2-deficient mice in vivo. Cereb Cortex. 2011;21:357–367. doi: 10.1093/cercor/bhq100. [DOI] [PubMed] [Google Scholar]
- Kasugai Y, Swinny JD, Roberts JD, Dalezios Y, Fukazawa Y, Sieghart W, Shigemoto R, Somogyi P. Quantitative localisation of synaptic and extrasynaptic GABAA receptor subunits on hippocampal pyramidal cells by freeze-fracture replica immunolabelling. Eur J Neurosci. 2010;32:1868–1888. doi: 10.1111/j.1460-9568.2010.07473.x. [DOI] [PMC free article] [PubMed] [Google Scholar]
- Klausberger T, Somogyi P. Neuronal diversity and temporal dynamics: the unity of hippocampal circuit operations. Science. 2008;321:53–57. doi: 10.1126/science.1149381. [DOI] [PMC free article] [PubMed] [Google Scholar]
- Knuesel I, Mastrocola M, Zuellig RA, Bornhauser B, Schaub MC, Fritschy JM. Altered synaptic clustering of GABAA-receptors in mice lacking dystrophin (mdx mice) Eur J Neurosci. 1999;11:4457–4462. doi: 10.1046/j.1460-9568.1999.00887.x. [DOI] [PubMed] [Google Scholar]
- Kralic JE, Sidler C, Parpan F, Homanics G, Morrow AL, Fritschy JM. Compensatory alteration of inhibitory synaptic circuits in thalamus and cerebellum of GABAA receptor α1 subunit knockout mice. J Comp Neurol. 2006;495:408–421. doi: 10.1002/cne.20866. [DOI] [PubMed] [Google Scholar]
- Kriebel M, Metzger J, Trinks S, Chugh D, Harvey RJ, Harvey K, Volkmer H. The cell adhesion molecule neurofascin stabilizes axo-axonic GABAergic terminals at the axon initial segment. J Biol Chem. 2011;286:24385–24393. doi: 10.1074/jbc.M110.212191. [DOI] [PMC free article] [PubMed] [Google Scholar]
- Levi S, Grady M, Henry M, Campbell K, Sanes J, Craig A. Dystroglycan is selectively associated with inhibitory GABAergic synapses but is dispensable for their differentiation. J Neurosci. 2002;22:4274–4285. doi: 10.1523/JNEUROSCI.22-11-04274.2002. [DOI] [PMC free article] [PubMed] [Google Scholar]
- Lorincz A, Nusser Z. Specificity of immunoreactions: the importance of testing specificity in each method. J Neurosci. 2008;28:9083–9086. doi: 10.1523/JNEUROSCI.2494-08.2008. [DOI] [PMC free article] [PubMed] [Google Scholar]
- Löw K, Crestani F, Keist R, Benke D, Brünig I, Benson JA, Fritschy JM, Rulicke T, Bluethmann H, Mohler H, Rudolph U. Molecular and neuronal substrate for the selective attenuation of anxiety. Science. 2000;290:131–134. doi: 10.1126/science.290.5489.131. [DOI] [PubMed] [Google Scholar]
- Mann EO, Paulsen O. Role of GABAergic inhibition in hippocampal network oscillations. Trends Neurosci. 2007;30:343–349. doi: 10.1016/j.tins.2007.05.003. [DOI] [PubMed] [Google Scholar]
- Marksitzer R, Benke D, Fritschy JM, Mohler H. GABAA-receptors: Drug binding profile and distribution of receptors containing the α2-subunit in situ. J Recept Res. 1993;13:467–477. doi: 10.3109/10799899309073673. [DOI] [PubMed] [Google Scholar]
- Nyiri G, Freund TF, Somogyi P. Input-dependent synaptic targeting of α2-subunit-containing GABAA receptors in synapses of hippocampal pyramidal cells of the rat. Eur J Neurosci. 2001;13:428–442. doi: 10.1046/j.1460-9568.2001.01407.x. [DOI] [PubMed] [Google Scholar]
- Panzanelli P, Bardy C, Nissant A, Pallotto M, Sassoè-Pognetto M, Lledo PM, Fritschy JM. Early synapse formation in developing interneurons of the adult olfactory bulb. J Neurosci. 2009;29:15039–15052. doi: 10.1523/JNEUROSCI.3034-09.2009. [DOI] [PMC free article] [PubMed] [Google Scholar]
- Papadopoulos T, Eulenburg V, Reddy-Alla S, Mansuy IM, Li Y, Betz H. Collybistin is required for both the formation and maintenance of GABAergic postsynapses in the hippocampus. Mol Cell Neurosci. 2008;39:161–169. doi: 10.1016/j.mcn.2008.06.006. [DOI] [PubMed] [Google Scholar]
- Patrizi A, Scelfo B, Viltono L, Briatore F, Fukaya M, Watanabe M, Strata P, Varoqueaux F, Brose N, Fritschy JM, Sassoè-Pognetto M. Synapse formation and clustering of neuroligin-2 in the absence of GABAA receptors. Proc Natl Acad Sci U S A. 2008;105:13151–13156. doi: 10.1073/pnas.0802390105. [DOI] [PMC free article] [PubMed] [Google Scholar]
- Paysan J, Kossel A, Bolz J, Fritschy JM. Area-specific regulation of γ-aminobutyric acid A receptor subtypes by thalamic afferents in developing rat neocortex. Proc Natl Acad Sci U S A. 1997;94:6995–7000. doi: 10.1073/pnas.94.13.6995. [DOI] [PMC free article] [PubMed] [Google Scholar]
- Peden DR, Petitjean CM, Herd MB, Durakoglugil M, Rosahl TW, Wafford K, Homanics GE, Belelli D, Fritschy JM, Lambert JJ. Developmental maturation of synaptic and extrasynaptic GABAA receptors in mouse thalamic ventrobasal neurones. J Physiol. 2008;586:965–987. doi: 10.1113/jphysiol.2007.145375. [DOI] [PMC free article] [PubMed] [Google Scholar]
- Peng Z, Hauer B, Mihalek RM, Homanics GE, Sieghart W, Olsen RW, Houser CR. GABAA receptor changes in δ subunit-deficient mice: Altered expression of α4 and γ2 subunits in the forebrain. J Comp Neurol. 2002;446:179–197. doi: 10.1002/cne.10210. [DOI] [PubMed] [Google Scholar]
- Perronnet C, Vaillend C. Dystrophins, utrophins, and associated scaffolding complexes: role in mammalian brain and implications for therapeutic strategies. J Biomed Biotechnol. 2010;2010:849426. doi: 10.1155/2010/849426. [DOI] [PMC free article] [PubMed] [Google Scholar]
- Pilgram GS, Potikanond S, Baines RA, Fradkin LG, Noordermeer JN. The roles of the dystrophin-associated glycoprotein complex at the synapse. Mol Neurobiol. 2010;41:1–21. doi: 10.1007/s12035-009-8089-5. [DOI] [PMC free article] [PubMed] [Google Scholar]
- Poulopoulos A, Aramuni G, Meyer G, Soykan T, Hoon M, Papadopoulos T, Zhang M, Paarmann I, Fuchs C, Harvey K, Jedlicka P, Schwarzacher SW, Betz H, Harvey RJ, Brose N, Zhang W, Varoqueaux F. Neuroligin 2 drives postsynaptic assembly at perisomatic inhibitory synapses through gephyrin and collybistin. Neuron. 2009;63:628–642. doi: 10.1016/j.neuron.2009.08.023. [DOI] [PubMed] [Google Scholar]
- Prenosil GA, Schneider Gasser EM, Rudolph U, Keist R, Fritschy JM, Vogt KE. Specific subtypes of GABAA receptors mediate phasic and tonic forms of inhibition in hippocampal pyramidal neurons. J Neurophysiol. 2006;96:846–857. doi: 10.1152/jn.01199.2005. [DOI] [PubMed] [Google Scholar]
- Rasband MN. The axon initial segment and the maintenance of neuronal polarity. Nature Rev Neurosci. 2010;11:552–562. doi: 10.1038/nrn2852. [DOI] [PubMed] [Google Scholar]
- Saiepour L, Fuchs C, Patrizi A, Sassoè-Pognetto M, Harvey RJ, Harvey K. Complex role of collybistin and gephyrin in GABAA receptor clustering. J Biol Chem. 2010;285:29623–29631. doi: 10.1074/jbc.M110.121368. [DOI] [PMC free article] [PubMed] [Google Scholar]
- Schneider Gasser EM, Straub CJ, Panzanelli P, Weinmann O, Sassoè-Pognetto M, Fritschy JM. Immunofluorescence in brain sections: simultaneous detection of presynaptic and postsynaptic proteins in identified neurons. Nat Protoc. 2006;1:1887–1897. doi: 10.1038/nprot.2006.265. [DOI] [PubMed] [Google Scholar]
- Schwaller B, Buchwald P, Blumcke I, Celio MR, Hunziker W. Characterization of a polyclonal antiserum against the purified human recombinant calcium binding protein calretinin. Cell Calcium. 1993;14:639–648. doi: 10.1016/0143-4160(93)90089-o. [DOI] [PubMed] [Google Scholar]
- Schwarzer C, Berresheim U, Pirker S, Wieselthaler A, Fuchs K, Sieghart W, Sperk G. Distribution of the major γ-aminobutyric acidA receptor subunits in the basal ganglia and associated limbic brain areas of the adult rat. J Comp Neurol. 2001;433:526–549. doi: 10.1002/cne.1158. [DOI] [PubMed] [Google Scholar]
- Serwanski DR, Miralles CP, Christie SB, Mehta AK, Li X, De Blas AL. Synaptic and nonsynaptic localization of GABAA receptors containing the α5 subunit in the rat brain. J Comp Neurol. 2006;499:458–470. doi: 10.1002/cne.21115. [DOI] [PMC free article] [PubMed] [Google Scholar]
- Studer R, von Boehmer L, Haenggi T, Schweizer C, Benke D, Rudolph U, Fritschy JM. Alteration of GABAergic synapses and gephyrin clusters in the thalamic reticular nucleus of GABAA receptor α3 subunit-null mice. Eur J Neurosci. 2006;24:1307–1315. doi: 10.1111/j.1460-9568.2006.05006.x. [DOI] [PubMed] [Google Scholar]
- Südhof TC. Neuroligins and neurexins link synaptic function to cognitive disease. Nature. 2008;455:903–911. doi: 10.1038/nature07456. [DOI] [PMC free article] [PubMed] [Google Scholar]
- Sugita S, Saito F, Tang J, Satz JS, Campbell KP, Südhof TC. A stoichiometric complex of neurexins and dystroglycan in brain. J Cell Biol. 2001;154:435–445. doi: 10.1083/jcb.200105003. [DOI] [PMC free article] [PubMed] [Google Scholar]
- Sumita K, Sato Y, Iida J, Kawata A, Hamano M, Hirabayashi S, Ohno K, Peles E, Hata Y. Synaptic scaffolding molecule (S-SCAM) membrane-associated guanylate kinase with inverted organization (MAGI)-2 is associated with cell adhesion molecules at inhibitory synapses in rat hippocampal neurons. J Neurochem. 2007;100:154–166. doi: 10.1111/j.1471-4159.2006.04170.x. [DOI] [PubMed] [Google Scholar]
- Thomson AM, Jovanovic JN. Mechanisms underlying synapse-specific clustering of GABAA receptors. Eur J Neurosci. 2010;31:2193–2203. doi: 10.1111/j.1460-9568.2010.07252.x. [DOI] [PubMed] [Google Scholar]
- Tretter V, Jacob TC, Mukherjee J, Fritschy JM, Pangalos MN, Moss SJ. The clustering of GABAA receptor subtypes at inhibitory synapses is facilitated via the direct binding of receptor α2 subunits to gephyrin. J Neurosci. 2008;28:1356–1365. doi: 10.1523/JNEUROSCI.5050-07.2008. [DOI] [PMC free article] [PubMed] [Google Scholar]
- Vaillend C, Billard JM, Laroche S. Impaired long-term spatial and recognition memory and enhanced CA1 hippocampal LTP in the dystrophin-deficient DMD (mdx) mouse. Neurobiol Dis. 2004;17:10–20. doi: 10.1016/j.nbd.2004.05.004. [DOI] [PubMed] [Google Scholar]
- Vollenweider I, Smith KS, Keist R, Rudolph U. Antidepressant-like properties of α2-containing GABAA receptors. Behav Brain Res. 2011;217:77–80. doi: 10.1016/j.bbr.2010.10.009. [DOI] [PMC free article] [PubMed] [Google Scholar]
- Watanabe M, Fukaya M, Sakimura K, Manabe T, Mishina M, Inoue Y. Selective scarcity of NMDA receptor channel subunits in the stratum lucidum (mossy fibre-recipient layer) of the mouse hippocampal CA3 subfield. Eur J Neurosci. 1998;10:478–487. doi: 10.1046/j.1460-9568.1998.00063.x. [DOI] [PubMed] [Google Scholar]
Associated Data
This section collects any data citations, data availability statements, or supplementary materials included in this article.