

Abstract
The ear is a remarkably sensitive pressure fluctuation detector. In guinea pigs, behavioral measurements indicate a minimum detectable sound pressure of ~20 μPa at 16 kHz. Such faint sounds produce 0.1 nm basilar membrane displacements, a distance smaller than conformational transitions in ion channels. It seems that noise within the auditory system would swamp such tiny motions, making weak sounds imperceptible. Here, a new mechanism contributing to a resolution of this problem is proposed and validated through direct measurement. We hypothesize that vibration at the apical end of hair cells is enhanced compared to the commonly measured basilar membrane side. Using in vivo optical coherence tomography, we demonstrated that apical-side vibrations peak at a higher frequency, had different timing, and were enhanced compared to the basilar membrane. These effects depend nonlinearly on the stimulus level. The timing difference and enhancement are important for explaining how the noise problem is circumvented.
The high sensitivity of the hearing organ is an important survival factor for most vertebrates. Behavioral measurements indicate that guinea pigs, an extensively studied species, can detect sounds at levels around 20 μPa at 16 kHz1-3. Such weak sounds will vibrate the basilar membrane and all the structures attached to it. Outer hair cells (Fig. 1a, b) improve hearing sensitivity by amplifying these vibrations. Despite this amplification, basilar membrane vibrations are less than 0.1 nm during near-threshold stimulation4-6 – a distance similar to the diameter of a single hydrogen atom. To result in perception, these vibrations must be transmitted to hair cell stereocilia, the deflection of which opens mechanically sensitive ion channels. The only available data, originating from in vitro preparations where outer hair cells do not amplify motion, indicate that stereocilia deflections are even smaller than basilar membrane vibrations7, 8. This creates a fundamental problem, as direct measurements on isolated mouse9 and amphibian hair cells10, as well as theoretical considerations11, indicate that the minimum stimulus that these cells can resolve is on the order of 5 nm. If this limit applied to the intact organ of Corti, weak sounds would be imperceptible. A potential remedy is to presume collaboration amongst hair cells, in effect an averaging of the response across cells, or assuming that hair cells detect displacement of their stereocilia over a smaller bandwidth when situated in the intact organ of Corti9, 12, 13. Although both propositions seem reasonable, they cannot presently be experimentally verified. Here, an unconventional solution to this problem is proposed and validated through direct measurement of vibration within the organ of Corti.
Figure 1.
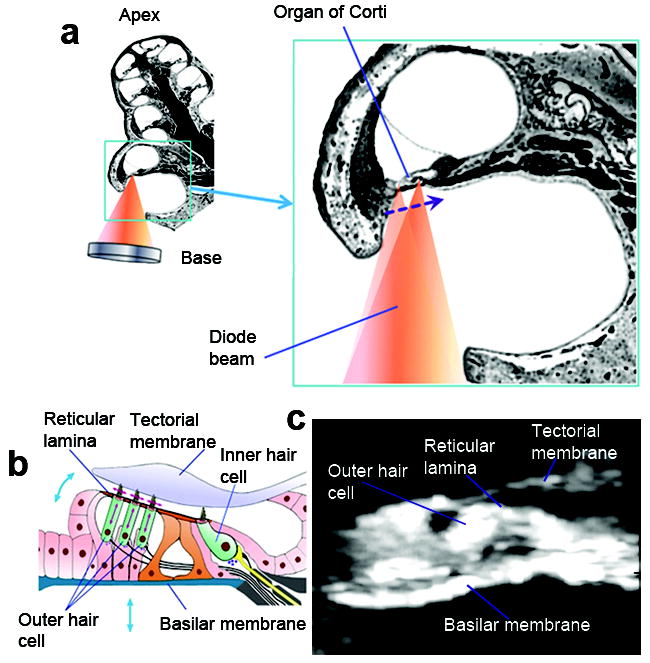
The cochlea and organ of Corti. a. Cross-section of the guinea pig cochlea showing the approach for vibration measurement. The panel on the right illustrates the scanning of the diode beam to obtain images of the hearing organ. b. Schematic organ of Corti cross-section. Arrows depict the direction of motion of different structures. c. OCT image of the organ of Corti in vivo. Asterisks mark the locations of vibration measurement.
Great effort has been expended in probing basilar membrane vibration14, because the amplification generated by outer hair cells is thought to be reflected in its motion. However, different cell types within the organ of Corti have different properties15, which means that vibrations may differ among the various components of the hearing organ. For instance, there is no reason why vibrations of the apical side, where stereocilia are located, must be fully reflected in the motion of the basilar membrane, which is known to be one of the stiffer components of the organ of Corti16.
Our hypothesis is that vibration is enhanced at the side of the hearing organ opposite to the basilar membrane. This, the reticular lamina or apical side, is where the initial stages of sensory transduction occur17-19. The low-level detection problem could be circumvented if this part of the hearing organ has larger motions than the basilar membrane, as suggested by in vitro experiments performed with electrical stimulation20. If amplitude differences occur, the timing of vibrations may also differ, which is important because hair cell force production must be correctly synchronized with the acoustic stimulus. To assess the potential relevance of these ideas, it is necessary to measure reticular lamina motion in vivo.
The behavior of the reticular lamina remains terra incognita at the base of the cochlea, where amplification is most pronounced, as no previous measurement method can penetrate beyond the basilar membrane. We designed an optical coherence tomography system that allows vibration measurements from both the basilar membrane side and the reticular lamina in living anaesthetized guinea pigs. We show that reticular lamina vibration has different frequency dependence, different timing with respect to the acoustic stimulus, and a larger magnitude than the basilar membrane. These features are important for explaining the remarkable sensitivity of mammalian hearing organs.
RESULTS
Here, optical coherence tomography (OCT)21, 22 was used to image cochlear structures and to measure sound-evoked motion. In the OCT system, light from a superluminescent diode is divided into a reference and an object beam. The object beam reaches the organ of Corti through an opening in the cochlea (Fig. 1a). When scanning this beam across the tissue, the back-reflected light is used to generate images (Fig. 1c). Vibrations are measured by locking the object beam on structures in these images. Light reflected from the tissue is then re-combined with the reference beam at the detector. The beams will interfere constructively if the length that they have travelled differs by <10 μm, corresponding to 1/10th of the distance separating the reticular lamina from the basilar membrane. Vibrations of the basilar membrane can therefore be differentiated from those of the reticular lamina.
Vibration of the basilar membrane and reticular lamina
In good preparations, basilar membrane vibrations are highly tuned. At 20 dB sound pressure level (decibels re 20 μPa, dB SPL), a sharp peak is seen at 19 kHz and the vibration amplitude decays sharply on either side of the peak (Fig. 2a). As the stimulus level increases, the peak moves to the left while growing flatter. Note that the response amplitude does not grow in proportion to the increase of the stimulus level. This nonlinear feature is typical for a healthy cochlea; it is seen in many previous studies23, 24.
Figure 2.
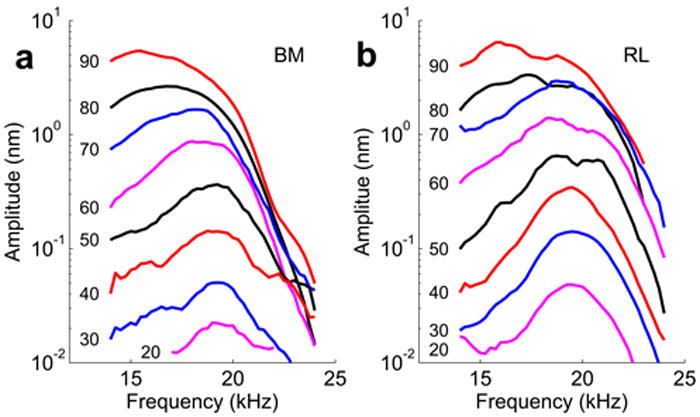
Vibration of the basilar membrane (BM, -panel a) and reticular lamina (RL, -panel b) in a guinea pig cochlea. Displacement magnitudes of vibration are plotted as a function of stimulus frequency. An auditory sensitivity loss of 8 dB was caused by surgical procedures in the ear. Numbers against each curve represent sound levels of dB SPL (re 20 μPa) used to induce hearing organ vibration. At 30 dB SPL, the maximum amplitude of BM vibration was 0.21 nm at 18 kHz. RL vibration peaked at 18.75 kHz, with a displacement amplitude of 0.41 nm.
High-frequency reticular lamina vibration has never been measured in vivo. We found that reticular lamina displacements are highly tuned and has greater magnitude than that of the basilar membrane. At 20 dB SPL, peak reticular lamina displacement is ~3 times greater than those of the basilar membrane (Fig. 2b), a difference that became smaller as the sound pressure increased. To illustrate this nonlinearity, we plotted displacement magnitudes as a function of stimulus intensity (Fig. 3a, which shows the mean and standard errors from 9 sensitive preparations). Because successful measurements at sound pressures below 40 dB SPL are uncommon, we used data acquired at 40 dB SPL for computing average values. At this sound pressure and at the characteristic frequency, reticular lamina vibrations were a factor 2.6 ± 0.3 larger than the basilar membrane (n=9, mean ± standard error; p=0.0045, using the paired t-test with Bonferroni corrections). When the stimulus level increased, the difference became smaller, but it remained statistically significant at 80 dB SPL (1.8± 0.2, p=0.02). Noticeably, both basilar membrane and reticular lamina vibration show nonlinear compression starting at 30 dB SPL (linear behavior is marked with the solid line in Fig. 3a). At the best frequency, low-level reticular lamina vibrations grow at a similar rate as the basilar membrane (in both cases, 0.5 – 0.6 dB increase of the response for every dB increase of the stimulus level), but at higher levels, the reticular lamina shows much slower growth (0.13 vs. 0.3 dB / dB SPL). As a result, the vibration amplitude of the two structures tend to converge between 70 and 90 dB SPL (compare the solid and the dashed lines in Fig. 3a). The nonlinear compression is stronger at higher frequencies but at lower frequencies, the BM and RL responses tend to overlap. Post mortem, vibrations were much smaller, grew linearly with stimulus intensity, and different structures within the organ of Corti had nearly identical vibration amplitudes (Fig. 3b, n=4). These data indicate that the amplified motion at the reticular lamina is due to processes sensitive to the physiological state of the cochlea.
Figure 3.
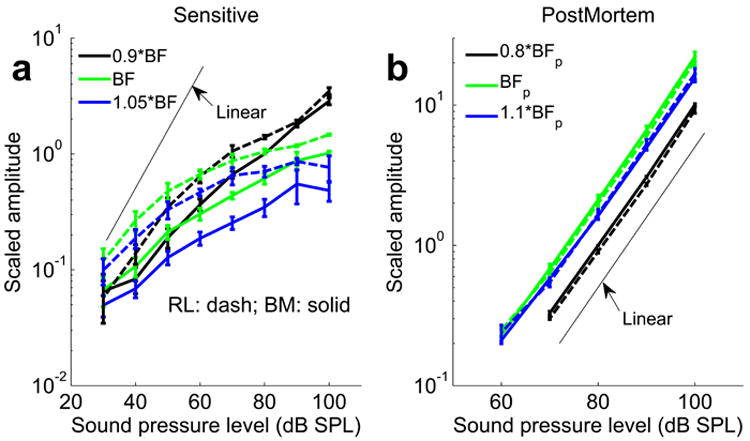
Displacement magnitude as a function of sound level (“input-output function”) measured from the basilar membrane (BM) and reticular lamina (RL). a, Input-output functions of BM (solid lines) and RL displacement (dashed lines); b, Postmortem input-output functions. Data plotted as mean ± standard error. Frequencies were normalized with respect to the best frequency of each animal. The frequency “0.9*BF” represents the frequency 0.9 times below the best frequency, and the frequency “1.05*BF” represents that 1.05 times above it. This compensates for slight variations in best frequencies in different experiments (best frequency range, 18.25-19.5 kHz). BFP is the best frequency at postmortem and it is around 15 kHz in the experiments. The thin lines mark a linear relationship between the sound pressure level and vibration amplitude.
Frequency differences
Apart from the amplitude difference, there is a difference in the frequency behavior of the two structures. When examining reticular lamina and basilar membrane vibration at exactly the same distance from the round window, peak frequency of reticular lamina vibration is higher than that of basilar membrane motion (frequency difference 440±160 Hz; n=9, p=0.02 by the paired t-test; cf. Fig. 4a and b).
Figure 4.
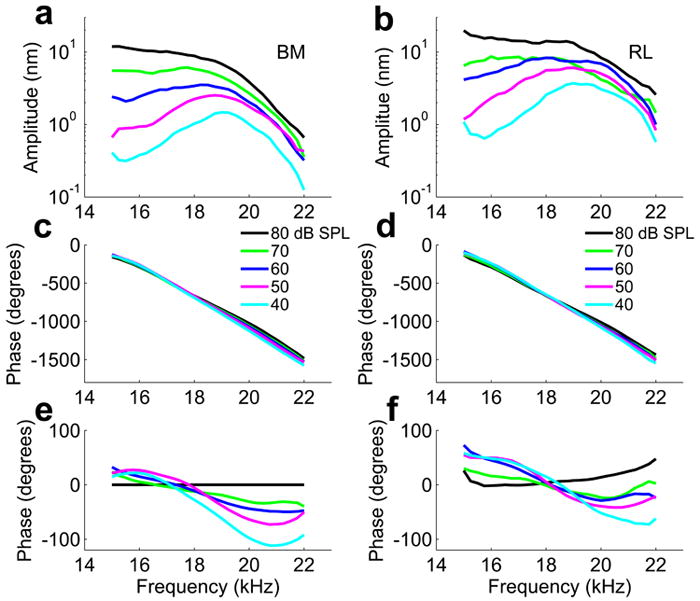
Sound-induced vibration of the basilar membrane (BM) and reticular lamina (RL) at the 19 kHz best frequency location in an animal with 7 dB sensitivity loss due to surgical preparation. a, b, Displacement amplitude versus frequency. c, d, Displacement phase relative to the speaker driving voltage versus frequency. e, f, Relative phase versus frequency at different sound levels with respect to the phase at 80 dB SPL. Numbers against the color lines in panels c and d represent the sound pressure level, which applies to all panels in this figure. Different sound levels were delivered in random order to avoid systematic errors. In panel b, the RL displacement magnitude at 70 dB SPL is affected by additional sensitivity loss of ~6 dB. This was the last measurement of the experiment.
The frequency differences are reflected in the timing of the response. Response timing, or phase, in the healthy cochlea depends on stimulus level. As the level increases, the slope of the phase-frequency curves became smaller, a behavior observed both at the basilar membrane (Fig. 4c) and at the reticular lamina (Fig. 4d). This indicates the presence of dispersive travelling waves. These phase changes are more easily examined if the phase is plotted with reference to the BM phase observed at the highest level, 80 dB SPL (Fig. 4e, f). In these plots, the BM phase at 80 dB SPL is zero by definition (black line in Fig. 4e). Note that the crossover between the phase curves at different levels occurs at a higher frequency for the reticular lamina, a disparity consistent with the higher best frequency for the reticular lamina described above. This difference in best frequency is accompanied by a timing difference between the two structures that is examined in detail below.
Timing differences
One may calculate, by scaling the phase delay of a basilar membrane travelling wave, that if the best frequency is 19 kHz for the reticular lamina and 18.5 kHz for the basilar membrane, a phase lead of about 80° for the reticular lamina with respect to the basilar membrane would result. Remarkably and consistent with this calculation, reticular lamina vibration does not occur in synchrony with the basilar membrane motion but displays a difference in phase (Fig. 5a). This difference is dependent on the sensitivity of the preparation and the stimulus level. At a low sound level (ie, 40 dB SPL), peak reticular lamina displacement precedes peak basilar membrane displacement, resulting in a relative phase lead of about 86°. The phase systematically shifts as the sound level increases and at 80 dB SPL, only 10° of phase lead remains. Noticeably, the reticular lamina phase lead occurs over the frequency range from 16 kHz to 19 kHz for a best frequency of 18 kHz. The average phase difference was 41 ± 11° at 40 dB SPL, which is significantly different from zero (n=9, p=0.006), decreasing to 11 ± 7° at 80 dB SPL (n=9, not significant). Postmortem, the phase and amplitude of the two structures are the same (data not shown).
Figure 5.
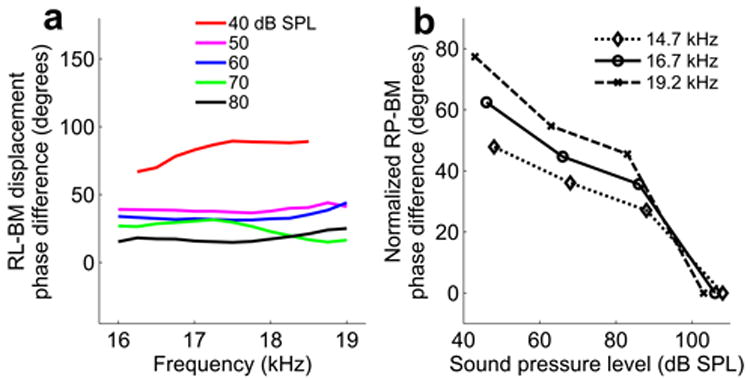
Phase differences of RL displacement and organ of Corti receptor potential compared with BM motion. a, Phase of RL displacement minus phase of BM displacement at different sound levels plotted for a frequency range of 16-19 kHz and sound levels between 40 and 80 dB SPL. Numbers in the panel represent sound levels in dB SPL. The best frequency is 18 kHz for BM and 18.5 kHz for RL. b, Normalized relative phase of organ of Corti receptor potentials (RP) and BM velocity for sound levels between 40 and 110 dB SPL. The best frequency is 18.5 kHz. Potentials were recorded in the fluid spaces within the organ of Corti adjacent to the outer hair cells. The relative phase lead of electric potentials decreases with sound level as it does for the phase of RL-BM displacement. This is an expected result when the RL displacement is the “drive” to the OHC and the extracellular potential is the result of that displacement. Similar results were also obtained from two additional sensitive animals.
These results demonstrated a mode of cochlear motion not anticipated from current models. Thus, confirmation of these findings with other techniques is essential. As no method other than OCT can directly quantify high-frequency reticular lamina motion, we measured extracellular receptor potentials within the organ of Corti. These potentials are an analog of outer hair cell receptor potentials25 and result from stereocilia deflection; reticular lamina motion is therefore an important determinant of their phase and amplitude. Potentials were compared with basilar membrane motion, which was measured with a conventional laser velocimeter. Strikingly, we found a similar phase shift (76° at the best frequency) of extracellular receptor potentials with respect to the basilar membrane as the one measured with OCT (Fig. 5b). The phase shift diminished with increasing level, giving rise to a negative slope in the phase versus intensity plot. Phase changes were smaller at frequencies remote from the peak of the tuning curve and in animals with substantial loss of auditory sensitivity.
DISCUSSION
It makes sense to amplify a stimulus near the part of the cell where it is detected. Indeed, here we demonstrated that vibrations at the reticular lamina, where stereocilia reside, were enhanced, had different frequency dependence and a different timing than the commonly measured vibrations of the basilar membrane. It is known that outer hair cells produce force to boost the movement of the organ of Corti20, 26-28. This process depends on the motor protein prestin29 and may involve force production by stereocilia30, 31. The active process equips the ear with a capacity to detect basilar membrane displacements at the subangstrom level. Although direct comparison with stereocilia displacements is difficult, we note that this displacement magnitude is much smaller than the thermal noise at the hair bundle10, 32, 33.
Two potential solutions emerge from the literature. The first requires hair cells to filter the incoming signal to a bandwidth less than 100 Hz9, 11. Such a process is difficult to verify experimentally, but if it occurs, the enhancement that we describe would relax the demands on the filter and allow its operation at bandwidths closer to psychophysically measured ones34. The other potential solution is cooperation, the stimulation of hair cells in groups around the place of maximum vibration. Responses would be summed across several cells, the averaged signal providing a noise-reduced driving stimulus for outer hair cell motility. However, experimental support for this theory is lacking. Our experiments showed that vibration at the reticular lamina was larger than at the basilar membrane. Because of this enhancement, stereocilia deflections will be closer to the noise-imposed limit found in vitro. The maximum difference between the reticular lamina and basilar membrane was near a factor 3, which is significant and will contribute to solving the low-level detection problem. However, the full resolution of this conundrum will likely require the development of new experimental techniques that can directly address the potential solutions mentioned above. The frequency differences are also important, because they ensure that hair cell force production has the right timing for counteracting viscous drag35, one of the main limitations on cochlear sensitivity. An erroneous timing would result in decreased rather than increased hearing sensitivity.
How is the enhanced reticular lamina motion generated? One important factor is likely the interaction between the tectorial membrane and outer hair cell stereocilia. Experimental and theoretical studies indicate that the tectorial membrane is capable of resonant motion that enhances stereocilia deflections36-38 and modeling studies indicate that the geometry of the organ of Corti may have a similar effect39. Since the cochlea is a feedback system, these factors may lead to augmented force production from outer hair cells that would increase internal differences in motion within the organ of Corti. The lack of enhancement at high stimulus levels and the disappearance of the phenomenon postmortem certainly implies a dependence on outer hair cells, as these cells are the only ones capable of generating force at the requisite speeds27 and the effect of their activity is known to be highly dependent on the functional status of the cochlea40.
Previous studies find that auditory nerve fibers have tuning very similar to that of the basilar membrane41, but because of the exceedingly demanding nature of such experiments, a frequency difference like the one found here could easily escape detection.
All of our findings required the organ of Corti to be mechanically compliant42-44, or else the motion of the reticular lamina would be fully reflected in basilar membrane vibrations. Measurements on isolated preparations do suggest gradients of compliance 20 which may lead to differences in motion amplitudes among structures in the organ of Corti42. A mechanically compliant organ of Corti allows the cochlear amplifier to work efficiently to optimize the mechanical stimulation on hair cell stereocilia. Nanoscale differential motion therefore appears indispensable for the near-threshold behavior of the organ of Corti.
METHODS
Optical coherence tomography
The OCT system uses 1310 ± 47 nm light for imaging and vibration measurement21, 22. When imaging, the beam scans across the tissue and reflected photons are used to generate images. With the scanning mirrors positioned on structures of interest, the system was operated as a homodyne interferometer to measure the displacement of the basilar membrane and reticular lamina. Because of the short coherence length of the light source, measurements are localized to within ~10 μm in the axial direction. The measurements presented here were conducted at the site showing maximum vibration along the radial axis of each structure.
Experimental procedures
Albino guinea pigs (250 – 350 g) with normal hearing were used. All procedures were approved by the Institutional Animal Care and Use Committee of Oregon Health & Science University. After anesthesia, the left cochlea was exposed and a small fenestra (~0.35 × 0.4 mm) was created in scala tympani. Tones were delivered via an acoustic coupler fitted to the ear canal. Vibrations were measured at the location corresponding to a best frequency near 19 kHz, and at the radial location where outer hair cells reside (Fig. 1c). Measurements were only made in preparations where image acquisition yielded a detailed map of organ of Corti structures. Signal generation for acoustic stimuli and data acquisition were performed via a lock-in amplifier (Stanford Research Systems, Model SR830) using custom software. Pure tones ranging from 20 to 100 dB SPL at frequencies 12 – 25 kHz were used for acoustic stimulation. Cochlear sensitivity was monitored throughout the experiment by measuring sound-evoked auditory nerve responses via a wire electrode on the round window membrane. Ears with surgically-induced hearing loss <15 dB were considered sensitive.
Electrophysiology
For measurement of the local potentials within the organ of Corti, a sharp glass microelectrode with tip diameter <1 μm was advanced through the opening used for recording mechanical responses. The position of the electrode was controlled by a motorized micromanipulator. Potentials were recorded using a BMA-200 amplifier (CWA Inc., Ardmore, PA) connected to the SR830 lock-in amplifier. The frequency response of each electrode was calibrated while in position within the organ of Corti45. Electrode penetration caused an unavoidable 10 – 17 dB loss of auditory sensitivity. Comparisons were therefore performed using basilar membrane data acquired after electrode penetration. Basilar membrane vibration was measured with a conventional laser velocimeter, as previously described24.
Acknowledgments
We thank Egbert de Boer, Tianying Ren, Anna Magnusson and Peter Gillespie for critical discussions and reading of the manuscript. This work was supported by the National Institutes of Health, NIDCD DC00141 and NIDCD DC010399, for A.L.N., and by grants from the Swedish Research Council, K2008-63X-14061-08-3, the Tysta Skolan foundation and Hörselskadades Riksförbund for A.F.
Footnotes
Author contributions F.C., D.Z., A.F., J.Z. and N.C. conducted experiments. F.C., D.Z., A.F., J.Z., X.S. and A.L.N. analyzed and interpreted data. F.C., A.F., J.Z. and A.L.N. wrote the manuscript. F.C., N.C., S.L.J. and R.K.W. designed and built the OCT interferometer. F.C., A.F., J.Z. and A.L.N. designed the experiments. F.C., D.Z., A.F. and J.Z. contributed equally.
Competing interests statement The authors declare no competing interests.
References
- 1.Heffner R, Heffner H, Masterton B. Behavioral measurements of absolute and frequency-difference thresholds in guinea pig. J Acoust Soc Am. 1971;49:1888–1895. doi: 10.1121/1.1912596. [DOI] [PubMed] [Google Scholar]
- 2.Prosen CA, Petersen MR, Moody DB, Stebbins WC. Auditory thresholds and kanamycin-induced hearing loss in the guinea pig assessed by a positive reinforcement procedure. J Acoust Soc Am. 1978;63:559–566. doi: 10.1121/1.381754. [DOI] [PubMed] [Google Scholar]
- 3.Hood LJ, et al. Objective auditory threshold estimation using sine-wave derived responses. Hear Res. 1991;55:109–116. doi: 10.1016/0378-5955(91)90097-s. [DOI] [PubMed] [Google Scholar]
- 4.Cooper N, Guinan JJ. Efferent-mediated control of basilar membrane motion. J Physiol. 2006;576:49–54. doi: 10.1113/jphysiol.2006.114991. [DOI] [PMC free article] [PubMed] [Google Scholar]
- 5.Khanna SM, Leonard DG. Basilar membrane tuning in the cat cochlea. Science. 1982;215:305–306. doi: 10.1126/science.7053580. [DOI] [PubMed] [Google Scholar]
- 6.Sellick PM, Patuzzi R, Johnstone BM. Measurement of basilar membrane motion in the guinea pig using Mossbauer technique. J Acoust Soc Am. 1982;72:131–141. doi: 10.1121/1.387996. [DOI] [PubMed] [Google Scholar]
- 7.Fridberger A, Tomo I, Ulfendahl M, Boutet de Monvel J. Imaging hair cell transduction at the speed of sound: Dynamic behavior of mammalian stereocilia. Proc Natl Acad Sci U S A. 2006;103:1918–1923. doi: 10.1073/pnas.0507231103. [DOI] [PMC free article] [PubMed] [Google Scholar]
- 8.Hu X, Evans BN, Dallos P. Direct visualization of organ of Corti kinematics in a hemicochlea. J Neurophysiol. 1999;82:2798–2807. doi: 10.1152/jn.1999.82.5.2798. [DOI] [PubMed] [Google Scholar]
- 9.van Netten SM, Dinklo T, Marcotti W, Kros CJ. Channel gating forces govern accuracy of mechano-electrical transduction in hair cells. Proc Natl Acad Sci U S A. 2003;100:15510–15515. doi: 10.1073/pnas.2632626100. [DOI] [PMC free article] [PubMed] [Google Scholar]
- 10.Denk W, Webb WW. Thermal-noise-limited transduction observed in mechanosensory receptors of the inner ear. Phys Rev Lett. 1989;63:207–210. doi: 10.1103/PhysRevLett.63.207. [DOI] [PubMed] [Google Scholar]
- 11.Bialek W. Physical limits to sensation and perception. Ann Rev Biophys Biophys Chem. 1987;16:455–478. doi: 10.1146/annurev.bb.16.060187.002323. [DOI] [PubMed] [Google Scholar]
- 12.Pickles JO. An introduction to the physiology of hearing. Emerald Group Pub Ltd; West Yorkshire: 1988. [Google Scholar]
- 13.Barral J, Dierkes K, Lindner B, Jülicher F, Martin P. Coupling a sensory hair-cell bundle to cyber clones enhances nonlinear amplification. Proc Natl Acad Sci U S A. 2010;107:8079–8084. doi: 10.1073/pnas.0913657107. [DOI] [PMC free article] [PubMed] [Google Scholar]
- 14.Robles L, Ruggero MA. Mechanics of the mammalian cochlea. Physiol Rev. 2001;81:1305–1352. doi: 10.1152/physrev.2001.81.3.1305. [DOI] [PMC free article] [PubMed] [Google Scholar]
- 15.Kolston PJ. Comparing in vitro, in situ, and in vivo experimental data in a three-dimensional model of mammalian cochlear mechanics. Proc Natl Acad Sci U S A. 1999;96:3676–3681. doi: 10.1073/pnas.96.7.3676. [DOI] [PMC free article] [PubMed] [Google Scholar]
- 16.Olson ES, Mountain DC. In vivo measurement of basilar membrane stiffness. J Acoust Soc Am. 1991;89:1262–1275. doi: 10.1121/1.400535. [DOI] [PubMed] [Google Scholar]
- 17.Flock Å. Transducing mechanisms in the lateral line canal organ receptors. Cold Spring Harb Symp Quant Biol. 1965;30:133–145. doi: 10.1101/sqb.1965.030.01.016. [DOI] [PubMed] [Google Scholar]
- 18.Hudspeth AJ, Corey DP. Sensitivity, polarity, and conductance change in the response of vertebrate hair cells to controlled mechanical stimuli. Proc Natl Acad Sci U S A. 1977;74:2407–2411. doi: 10.1073/pnas.74.6.2407. [DOI] [PMC free article] [PubMed] [Google Scholar]
- 19.Corey DP, Hudspeth AJ. Ionic basis of the receptor potential in a vertebrate hair cell. Nature. 1979;281:675–677. doi: 10.1038/281675a0. [DOI] [PubMed] [Google Scholar]
- 20.Mammano F, Ashmore JF. Reverse transduction measured in the isolated cochlea by laser Michelson interferometry. Nature. 1993;365:838–841. doi: 10.1038/365838a0. [DOI] [PubMed] [Google Scholar]
- 21.Choudhury N, et al. Low coherence interferometry of the cochlear partition. Hear Res. 2006;220:1–9. doi: 10.1016/j.heares.2006.06.006. [DOI] [PubMed] [Google Scholar]
- 22.Chen F, et al. In vivo imaging and low-coherence interferometry of organ of Corti vibration. J Biomed Opt. 2007;12:021006. doi: 10.1117/1.2717134. [DOI] [PubMed] [Google Scholar]
- 23.Rhode WS. Observations of the vibration of the basilar membrane in squirrel monkeys using the Mossbauer technique. J Acoust Soc Am. 1971;49(Suppl 2):1218. doi: 10.1121/1.1912485. [DOI] [PubMed] [Google Scholar]
- 24.Nuttall AL, Dolan DF, Avinash G. Laser Doppler velocimetry of basilar membrane vibration. Hear Res. 1991;51:203–213. doi: 10.1016/0378-5955(91)90037-a. [DOI] [PubMed] [Google Scholar]
- 25.Fridberger A, et al. Organ of Corti potentials and the motion of the basilar membrane. J Neurosci. 2004;24:10057–10063. doi: 10.1523/JNEUROSCI.2711-04.2004. [DOI] [PMC free article] [PubMed] [Google Scholar]
- 26.Brownell WE, Bader CR, Bertrand D, de Ribaupierre Y. Evoked mechanical responses of isolated cochlear outer hair cells. Science. 1985;227:194–196. doi: 10.1126/science.3966153. [DOI] [PubMed] [Google Scholar]
- 27.Frank G, Hemmert W, Gummer AW. Limiting dynamics of high-frequency electromechanical transduction of outer hair cells. Proc Natl Acad Sci U S A. 1999;96:4420–4425. doi: 10.1073/pnas.96.8.4420. [DOI] [PMC free article] [PubMed] [Google Scholar]
- 28.Nuttall AL, Ren T. Electromotile hearing: evidence from basilar membrane motion and otoacoustic emissions. Hear Res. 1995;92:170–177. doi: 10.1016/0378-5955(95)00216-2. [DOI] [PubMed] [Google Scholar]
- 29.Zheng J, et al. Prestin is the motor protein of cochlear outer hair cells. Nature. 2000;405:149–155. doi: 10.1038/35012009. [DOI] [PubMed] [Google Scholar]
- 30.Chan DK, Hudspeth AJ. Ca2+ current-driven nonlinear amplification by the mammalian cochlea in vitro. Nat Neurosci. 2005;8:149–155. doi: 10.1038/nn1385. [DOI] [PMC free article] [PubMed] [Google Scholar]
- 31.Kennedy HJ, Crawford AC, Fettiplace R. Force generation by mammalian hair bundles supports a role in cochlear amplification. Nature. 2005;433:880–883. doi: 10.1038/nature03367. [DOI] [PubMed] [Google Scholar]
- 32.Denk W, Webb WW. Forward and reverse transduction at the limit of sensitivity studied by correlating electrical and mechanical fluctuations in frog saccular hair cells. Hear Res. 1992;60:89–102. doi: 10.1016/0378-5955(92)90062-r. [DOI] [PubMed] [Google Scholar]
- 33.Jaramillo F, Wiesenfeld K. Mechanoelectrical transduction assisted by Brownian motion: a role for noise in the auditory system. Nat Neurosci. 1998;1:384–388. doi: 10.1038/1597. [DOI] [PubMed] [Google Scholar]
- 34.Ruggero MA, Temchin AN. Unexceptional sharpness of frequency tuning in the human cochlea. Proc Natl Acad Sci U S A. 2005;102:18614–18619. doi: 10.1073/pnas.0509323102. [DOI] [PMC free article] [PubMed] [Google Scholar]
- 35.de Boer E, Nuttall AL. The mechanical waveform of the basilar membrane. III. Intensity effects. J Acoust Soc Am. 2000;107:1497–1507. doi: 10.1121/1.428436. [DOI] [PubMed] [Google Scholar]
- 36.Allen JB. Cochlear micromechanics - A physical model of tranduction. J Acoust Soc Am. 1980;68:1660–1670. doi: 10.1121/1.385198. [DOI] [PubMed] [Google Scholar]
- 37.Gummer AW, Hemmert W, Zenner HP. Resonant tectorial membrane motion in the inner ear: its crucial role in frequency tuning. Proc Natl Acad Sci U S A. 1996;93:8727–8732. doi: 10.1073/pnas.93.16.8727. [DOI] [PMC free article] [PubMed] [Google Scholar]
- 38.Zwislocki JJ, Kletsky EJ. Tectorial membrane: a possible effect on frequency analysis in the cochlea. Science. 1979;204:639–641. doi: 10.1126/science.432671. [DOI] [PubMed] [Google Scholar]
- 39.Dallos P. Some pending problems in cochlear mechanics. In: Gummer AW, editor. Biophysics of the cochlea: molecules to models. World Scientific; Titisee, Germany: 2002. pp. 97–109. [Google Scholar]
- 40.Ruggero MA, Rich NC. Furosemide alters organ of corti mechanics: evidence for feedback of outer hair cells upon the basilar membrane. J Neurosci. 1991;11:1057–1067. doi: 10.1523/JNEUROSCI.11-04-01057.1991. [DOI] [PMC free article] [PubMed] [Google Scholar]
- 41.Narayan SS, Temchin AN, Recio A, Ruggero MA. Frequency tuning of basilar membrane and auditory nerve fibers in the same cochleae. Science. 1998;282:1882–1884. doi: 10.1126/science.282.5395.1882. [DOI] [PMC free article] [PubMed] [Google Scholar]
- 42.Fridberger A, de Monvel JB. Sound-induced differential motion within the hearing organ. Nat Neurosci. 2003;6:446–448. doi: 10.1038/nn1047. [DOI] [PubMed] [Google Scholar]
- 43.Tomo I, Boutet de Monvel J, Fridberger A. Sound-Evoked Radial Strain in the Hearing Organ. Biophys J. 2007;93:3279–3284. doi: 10.1529/biophysj.107.105072. [DOI] [PMC free article] [PubMed] [Google Scholar]
- 44.Khanna SM, Hao LF. Amplification in the apical turn of the cochlea with negative feedback. Hear Res. 2000;149:55–76. doi: 10.1016/s0378-5955(00)00162-3. [DOI] [PubMed] [Google Scholar]
- 45.Baden-Kristensen K, Weiss TF. Receptor potentials of lizard hair cells with free-standing stereocilia: responses to acoustic clicks. J Physiol (Lond) 1983;335:699–721. doi: 10.1113/jphysiol.1983.sp014559. [DOI] [PMC free article] [PubMed] [Google Scholar]