Abstract
Among the best characterized of the transcription factors are the b/HLH/z proteins: USF, Max, Myc and Mad. These proteins bind to the DNA E-box, a six base pair sequence, CACGTG. Max and Myc form a heterodimer that has strong oncogenic potential but can also repress transcription, while Mad and Max form a heterodimer that acts as a transcription repressor. We have used fluorescence anisotropy to measure protein-protein and protein-DNA affinity. The specific binding between MLP DNA and Max (K = 2.2 ± 0.5 nM) is about 10-fold higher affinity than LCR DNA and about 100-fold higher than for a non-specific DNA. USF has a similar binding affinity as Max to MLP DNA (K = 15 ± 10 nM), but Max binds more tightly to LCR and non-specific DNA. The series of oligonucleotides designated E-box, half-E-box and non-E-box were constructed to examine the effects of DNA sequence. The binding results indicate that for Max protein most of the binding energy can be attributed to individual elements with little cooperativity among the two halves of the E-box. Further studies measured the equilibria for the entire thermodynamic cycle of monomer-dimer-DNA interactions. Surprisingly, the affinity of the Max monomer-DNA for the second monomer was greatly reduced (K for the first monomer nM, second monomer μM). Looked at from the perspective of Max protein, the binding of DNA to Max significantly reduces the affinity of Max protein for the second monomer, whether the second monomer is Myc, Mad, or Max. These data suggest the importance of protein-protein interactions in assembly of a transcription initiation complex.
Max belongs to the basic-helix-loop-helix leucine zipper (b/HLH/z) class of mammalian proteins that bind to CACGTG sequences (E-box); this class includes USF (upstream stimulatory factor)(1), (2), as well as c-Myc (3,4), TFEB (5,6); TFE3(7); Mxil (8); Mix (9); MondoA (10); and Mnt (11) among others. The Myc gene is an oncogene and overexpression of Myc occurs in a wide variety of human cancer cells (12–16). It is now well established that the deregulated expression of c-Myc plays a significant role in human cancer development. The Myc protein family including C-Myc, N-Myc, and L-Myc were indicated as direct regulators of gene expression. Although C-Myc, N-Myc, and L-Myc have different transcription activity in transformation, immortalization, blockage of cell differentiation and induction of apoptosis (6,17–19), they have similar DNA binding properties. As basic helix-loop-helix leucine zipper proteins (b/HLH/z), the Myc family specifically binds the DNA sequence CACGTG (E-box) when dimerized with Max (20,21). The crystal structure of Myc-Max, as well as Mad-Max, bound to DNA has been determined and suggested that a head to tail pair of Myc-Max dimers may, in turn, form a heterotetramer capable of bridging distant E-boxes (22). Max protein is not only the partner of Myc but can heterodimerize with competing Mad family members or with Mnt. All of these heterodimers also bind E-boxes, as do Max homodimers. The basic-helix-loop-helix-zipper (b/HLH/z) motif of these proteins is a conserved region of approximately 70 amino acids shown to be responsible for dimerization (6,19) and the conserved region at the N-terminal side is believed to be required for DNA binding to the protein dimer (23). A heptad repeat of leucine residues called the leucine zipper (Z or zip) at the C-terminal is required for high binding affinity and specificity of the protein for DNA and for dimerization stability (1,6,24,25).
After the identification of Max as a binding partner of different Myc proteins, including c-Myc, N-Myc, and L-Myc, there began a search for additional b/HLH/z dimerization partners. The search led to the discovery of the Mad family proteins Mad1, Mxi1, Mad3, and Mad4, as interaction partners of Max and together these factors define the Myc/Max/Mad network (26,27). Later two additional Max partners, Mnt and Mga, were found (28,29). Recently the identification of Mlx, a Max-like protein that can heterodimerize with Mad1, Mad4, and Mnt, but not with the other Mad proteins nor with Myc or Max, has been reported (9,30). The most recent extensions of the network are the cloning of MondoA as an Mlx binding partner (10) and the identification of WBSCR14 that also interacts with Mlx (31). Both Max and Mlx are the central components of the network. It is possible that not all members of this network have been discovered and it will be of interest to detail additional components that may further expand the network.
Numerous studies have highlighted the importance of the Myc/Max/Mad network in regulating cell behavior (27). The formation of Myc-Max heterodimers is required for a number of biological activities such as transcriptional activation of promoters, cell transformation, proliferation, metabolism and differentiation (2,3,9,32–34). Myc does not easily form homodimers, nor does the homodimer readily bind to DNA except at high concentrations under in vitro conditions (23,35,36). In contrast, Max can homodimerize and bind to the E-box of DNA. The Mad-Max heterodimer has the opposite function to Myc-Max and acts as a transcriptional repressor (37). Mad proteins inhibit reporter genes that are activated by Myc, interfere with transformation of rat embryo fibroblasts, block cell growth, inhibit cell proliferation and prevent apoptosis (27,38). Although the function of Max homodimers is still not clear, formation of different Max heterodimers determines transcription activation or repression. Max protein plays a key role in the Myc-Max-Mad transcription regulation pathway.
While there have been a number of studies on the DNA sequence preferences of the b/HLH/z proteins, there has been very little quantitative data on protein-protein and protein-DNA interactions. An understanding of protein interactions with DNA is the first step in understanding the mechanism of action of this important biological process. In this work, we have investigated the binding of Max, Max-c-Myc and Max-Mad1 to DNA oligomers containing the E box and to other oligomers with various base substitutions. We have determined protein-protein interactions as well. The binding properties of Max to DNA are also compared to those of USF. USF has a biphasic binding mode representing a tetramer binding to two duplex DNA molecules (1,25). The results from direct fluorescence anisotropy titration measurements showed a single binding mode for Max binding to DNA that is attributed to a dimer-DNA interaction. Binding energy changes calculated from the equilibrium constants showed that the binding to the two halves of the E-box by each monomer in the dimer protein was nearly independent and had little cooperativity. Further analyses of the energy contributions from other steps in the assembly process suggest the relative importance of protein-protein and protein-DNA interactions. The equilibrium constants for the complete thermodynamic cycle for assembly of dimer-DNA from monomer DNA have been determined. These data give insight into the assembly of the protein-DNA scaffolding and serve as the basis to investigate the effects of other members of this complex network.
Materials and Methods
Protein purification
The expression vectors Max/pET3a and c-Myc/pGex2T were obtained from S.K. Burley, Rockefeller University. The expression vector Mad1/pET30a was constructed using Mad cDNA (purchased from Open Biosystems, Huntsville, AL). The Max, Mad1 and c-Myc proteins were all expressed in E. coli BL21-pLys cells containing the DE3 promoter. In order to obtain soluble proteins, Max consisted of amino acids (22–113), c-Myc (aa 347–439) and Mad1 was the full length protein. These constructs contained the functional b/HLH/z domains of the proteins. Cells containing pET-Max or pGEX-Myc were selected by colony selection and inoculated into one liter LB media with 50 ug/mL ampicillin. After being grown into 0.6 OD600, the cells were induced with 1 mM isopropyl β-D-thiogalactopyranoside (IPTG) and further incubated for 6 hrs. Cells containing pET-Mad vectors were also selected by colony selection. Ten mL of transformed E. coli cells were inoculated into one liter LB media with 50 ug/mL kanamicin and grown to 0.6–0.8 OD600. The cells were induced with IPTG and continued to grow for 6 hours. The pellets were collected by centrifugation for 20 min and 6000 rpm and resuspended in HEPESbuffer (pH 7.6) (for Myc PBS, pH 7.4 was used) with protease inhibitor cocktail and lysozyme. The cells were stored on ice for one hour and then sonicated twice for one minute with a 30 sec interval between sonication. The supernatant was used for chromatography and purification of the proteins. For Mad1 and c-Myc, the pellets were also saved for treatment of inclusion bodies.
The inclusion bodies for Mad1 were washed twice with 10 mL of 20 mM HEPES buffer (pH 7.6) containing 1% triton X100 followed by centrifugation at 18000 rpm for 30 min at 4° C. The pellet (inclusion bodies) was dissolved in 2 mL 50 mM HEPES buffer pH 7.6, 6M guanidine HCl, 25 mM DTT and incubated for one hour at 4 °C. Insoluble material was removed by centrifugation (18000 rpm, 10 min) and the supernatant was diluted into 20 mL cold 50 mM HEPES pH 7.6.
The inclusion bodies for c-Myc were washed as described above for Mad1. The pellet was dissolved in 10 mL PBS Buffer, pH 7.4 containing 1% Triton x-100 and incubated overnight with gentle stirring. Insoluble material was removed as described above and the supernatant was diluted into 20 mL cold 20 mM PBS pH 7.4.
Max was purified by HiTrap SP ionic exchange chromatography using the same protocol as described elsewhere (21,25). c-Myc was purified by GST affinity chromatography (Amersham Biosciences) using 20 mM PBS pH 7.4 as the wash buffer and 50 mM glutathione, 200 mM Tris-HCl pH 8.5 as the elution buffer. Mad1 was purified on Ni2+-His Trap affinity column (Novagen). Depending on the concentration of protein in the sample and the His-bind resin capacity, the proper volume of resin was packed under gravity flow. Resin was washed with 10 volumes of binding buffer (0.5 M NaCl, 20 mM Tris-HCl, 5 mM imidazole, pH 7.9) and the protein samples loaded onto the column. The column was washed with additional binding buffer and 3–10 volumes of wash buffer (0.5 M NaCl, 60 mM imidazole, 20 mM Tris-HCl, pH 7.9) and the protein was eluted with the same buffer containing 1M imidazole. The protein fractions were collected, extensively dialyzed in HEPES buffer pH 7.6, purity analyzed by SDS-Page, concentrated and the concentrations were determined using a Bio-Rad protein assay kit (Bio-Rad Laboratories, CA, USA).
Fluorescent labeling of Max protein
The N-terminus of Max protein was labeled with tetramethylrhodamine-5-isothiocyanate (5-TRITC). Because 5-TRITC reacts only with uncharged primary amines, under mild conditions, the N-terminus of Max was labeled. Max protein concentration was adjusted to ~ 1.0 mg/mL in 50 mM HEPES buffer (pH 7.6) and a total volume of 5.0 mL. 100 uL of TRITC dissolved in anhydrous DMSO (1.5 mg/mL) was added per one mL of protein solution. The protein-dye mixture was incubated overnight in the dark at 4 °C with continuous gentle agitation. Labeled protein was separated from free rhodamine compounds by Sephadex G-15 gel filtration eluted with HEPES buffer. The collected fractions were concentrated with Centricon YM filters (Amicon Corp) by centrifugation for 6 hours at 4000 rpm. The final protein concentration and fluorophore/protein (F/P) ratio was determined by measuring absorbance at 280 nm and 555 nm. The following formula was used to obtain F/P ratios:
where CF = (A280 free dye)/(A555 free dye) = 0.30 for TRITC and [Protein] = Aprotein/(1.4 mg/ml) and the F/P ratio was calculated using ε = 93000 for TRITC.
The site of protein labeling was confirmed by enzymatic digestion. Approximately 90% of the protein was labeled (1 dye/monomer). Labeling at sites other than the N-terminus was not detected.
DNA oligonucleotides
DNA binding was measured using synthetic oligonucleotides purchased from GeneLink (Hawthorne, NY). The 21- or 16-bp oligonucleotides used in this study contained the sequence derived from the adenovirus major late promoter (MLP) containing the E-box (CACGTG). Sequences with three bases that are different from the MLP sequence are based on the human globin locus control region (LCR) transcription complex which contains the USF binding site. A modified LCR (mLCR) sequence with three other mutations and a base mismatch in the E-box was also used. Three 21-mer oligonucleotides were used to measure the difference in binding for variations in the E-box sequence. Sequences of the oligonucleotides used are listed below:
| Oligonucleotides | DNA sequences (complementary strand not shown) |
|---|---|
| 16-mer MLP | 5′TAGGCCACGTGACCGG3′ |
| 16-mer LCR | 5′TAGACCACCTGACTGG3′ |
| 16-mer mLCR | 5′TAGGCCACCTGCCTCG3′ |
| 21-mer E-Box | 5′GTGTAGGCCACGTGACCGGGT3′ |
| 21-mer Half-Ebox | 5′GTGTAGGCCAGGTGACCGGGT3′ |
| 21-mer Non-Ebox | 5′GTGTAGGCCAGCTGACCGGGT3′ |
The oligonucleotides were hybridized together to form double-stranded DNA before titrations. Equal concentrations (10–20 μM) of labeled oligonucleotides and their unlabeled complements were dissolved in nuclease free water, heated to 75–80 °C for 30 min and allowed to cool slowly overnight. The DNA oligonucleotide was purchased either as an unlabeled oligonucleotide (and its complement) or with a 5′ fluorescein isothiocyanate derivative.
Fluorescence Methods
Fluorescence polarization and anisotropy have been used extensively to monitor protein-protein and protein-DNA interactions (cf (39) and references therein). For globular proteins, the rotational correlation time, φ, is approximately related to the molecular weight of the protein (M) and is given by (eq.1):
where ν is the specific volume of the protein, R is the gas constant, T is the temperature, η is the viscosity, and h is the hydration, typically 0.2 g H2O per gram protein, although in practice usually somewhat larger due to the nonspherical shape of proteins. From the above equation the predicted anisotropy can be related to the molecular weight for each species by
where robs is the observed anisotropy, r0 is the anisotropy in the absence of ligand, τ is the fluorescence lifetime and other parameters are as defined in equation 1.
For interactions where the fluorescence intensity does not change, robs is related to Σ ciri where ci and ri represent the concentration and anisotropy of the ith species, respectively.
The equation used for data fitting to obtain monomer-dimer dissociation equilibrium constants was (40,41):
where robs is the observed anisotropy for any point in the titration curve, rMax is the maximum observed anisotropy, rmin is the minimum observed anisotropy, [Myc] and [Max] are the equilibrium protein concentrations, and KD is the dissociation equilibrium constant. Theoretically, once rmin and rMax are known, any single point will give the KD value, therefore there is considerable redundancy in the data collection. The rmin values are determined from low concentration of protein and the rMax value is the value at the end of the titration. Usually titrations with two different starting concentrations of proteins are fit simultaneously and rMax is fit as another variable. This reduces any errors from choosing the wrong endpoint of the curve.
Protein dimer binding to DNA oligonucleotides
Fluorescently labeled DNA oligonucleotides were titrated with unlabeled protein. The resulting anisotropy change was used to calculate the dissociation equilibrium constant according to equations described previously (40,42). Fluorescence measurements were performed with a SPEX 2 spectrophotometer and data were fit with the KaleidaGraph data analysis program.
Oligonucleotide concentrations were 15–50 nM. Titrations were carried out in 25 mM HEPES-KOH buffer, pH 7.6 containing 50 mM KCl, 10 mM DTT, 5 mM MgCl2, and 0.5 mM EDTA. for heterodimer titrations, Myc or Mad concentrations were in 5–10 fold excess of Max. Max was pre-incubated with the Myc or Mad protein prior to titration.
Results and Discussion
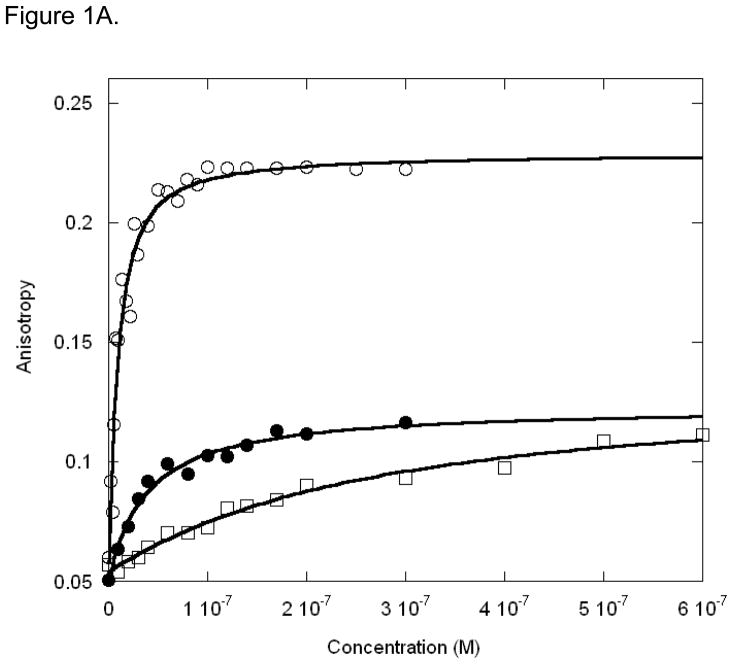
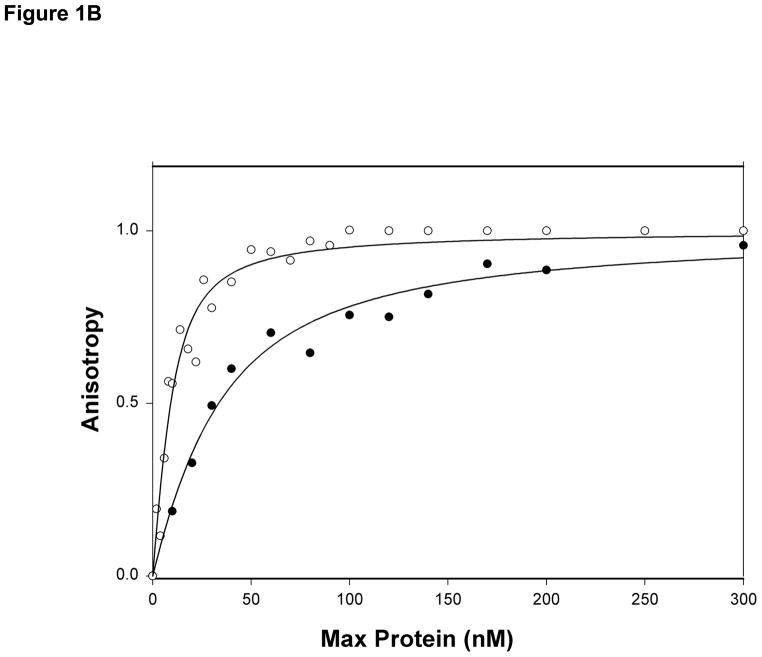
The binding affinity of Max protein for LCR and MLP DNA oligonucleotides were measured in order to compare the binding with USF protein and structural data. The MLP sequence was also used in the x-ray crystallographic structure determination of Max2-DNA (21). Our previous studies of USF (25) indicated that a biphasic mode of binding occurred with a high degree of specificity for MLP compared to LCR or mLCR (orginally designated nonspecific DNA). The titration data shown in Figure 1A and B demonstrate that there are significant differences in the binding affinity of Max protein to MLP and LCR DNA. The specific binding between MLP DNA and Max is about 10-fold higher affinity than LCR DNA and about 100-fold tighter binding than for the mLCR sequence (Table 1). An interesting observation is that the final anisotropy of the bound DNA is considerably higher for the MLP DNA than for mLCR or LCR DNA (0.223 ± 0.01 and 0.116 ± 0.01, respectively). In the case of mLCR DNA, this may be partially due to the contribution of free labeled DNA. Because of the low binding affinity, it is difficult to saturate the DNA with protein. The final anisotropy was extrapolated from the binding curve and obtained as a fitting parameter. Using the same final anisotropy obtained for MLP DNA in the fitting could not adequately fit the data. The final anisotropy is lower for the nonspecific sequences. This suggests that the binding mode may lock the DNA into a more rigid conformation for the specific binding, allowing less rotation even at the terminus where the fluorescent label is attached. This could be accomplished by interactions outside the E-box binding region such as a hydrogen bond between an amino acid in the loop region of the protein and the flanking sequence of the DNA(43). It is also possible that there could be a charge interaction between an amino acid side chain such as Lys 57 and a residue in the flanking sequence. We have determined the pH dependence of the binding between pH 6.5 and 8.5 (data not shown). No significant changes in binding affinity as a function of pH were found. This would indicate that if a charge residue is involved, it does not have a pK near this pH range. Cave et al. (44) used NMR to study Pho4 b/HLH domain binding to E-box and nonspecific DNA. They concluded that there was little difference in protein backbone dynamics, but that the protein may slide along the nonspecific target sequence. Such motion would contribute to a lower overall anisotropy for LCR and mLCR DNA binding.
Figure 1.
Figure 1A. MLP DNA oligonucleotide (○), LCR DNA oligonucleotide (●) and mLCR DNA oligonucleotide (□) titrated with Max Protein. The concentration of MLP was 20nM, LCR and mLCR were 100nM. Anisotropy change was shown as Y value by increasing the Max protein concentration (X value). The temperature was 22 °C. The titration curves indicate stronger binding affinity for MLP than LCR.
Figure 1B. Normalized binding of Max protein to MLP (○) and LCR (●) DNA oligonucleotides. The normalized values represent the fraction bound. Experimental conditions are as described for Figure 1A.
Table 1.
Equilibrium binding constants and specificities of USF and MAX with DNA
| Oligos (12mers) | Keq (nM) USF |
Specificity | Keq (nM) MAX |
Specificity |
|---|---|---|---|---|
| MLP | 15±10 | 1090 | 2.2±0.5 | 104 |
| LCR | 3133±570 | 3.0 | 33.3±7.7 | 9.6 |
| mLCR | 9820±2680 | 1.0 | 230±10 | 1.0 |
The data in Figure 1A and B show a single binding mode for Max binding to DNA. The Max-DNA binding profiles indicated Max dimer binding to DNA and did not show a biphasic binding mode which has been observed with USF (25). USF, another b/HLH/Z protein, recognizes the same E-box sequence and binds as two dimers (homotetramer) to two duplex DNA molecules (or to two E-box sites on the same DNA which forms a loop). A comparison of the binding constants (Table 1) for Max and those of USF to MLP DNA shows that both bind with similar affinities (nM) but USF has 10 times higher specificity of binding to MLP DNA than Max. Max binds both LCR and mLCR DNA more tightly than USF. The lower specificity of binding of Max to MLP DNA suggests differences in transcriptional regulatory functions between Max and USF. USF is believed to mediate DNA looping by binding to two E-box sites in a biphasic mode--the first USF dimer binding tightly to one E-box and a second dimer binds with 10-fold lower affinity to the second E-box. The formation of a DNA loop is thought to be necessary for stimulating transcription and requires a high degree of specificity of USF for DNA. On the other hand, Max is known to activate transcription by binding to Myc oncoprotein and to cause repression of Myc transcriptional activities in high concentrations by forming homodimers which are believed to block the E-box site. Max function may be more important in determining the formation of heterodimers than in the selection of DNA.
It has been shown that Max binds as a dimer to the E-box with each monomer interacting with one half of the E-box (21). Similar binding is observed for the Myc-Max and Max-Mad1 heterodimer binding to E-box DNA(22). The series of oligonucleotides described in Materials and Methods as E-box, Half-E-Box and Non-E-Box were constructed to examine the contribution of each half of the E-box to dimer binding affinity and stability. The non-E-box has only altered the two central bases and is still considered an E-box, however lacking two essential interactions (see below). Table 2 shows the equilibrium dissociation constants and corresponding ΔG values for Max homodimer and the two heterodimers. These oligonucleotides also allow an evaluation of the extent to which there is cooperativity between the two E box half-sites. The cooperativity between these two sites can be determined by the free energy differences in binding. For binding of two different ligands to a macromolecule, Weber (45) has proposed a simple procedure for depicting the heterotropic free energy of interaction, the “coupling energy”. This quantity indicates by how much and in what direction there is error in estimating the overall free energy of binding from knowledge of the separate binding free energies. At equilibrium, the free energy change for specific binding is given by:
Table 2.
Dissociation Constants (Kd) and ΔG for the protein binding with different oligonucleotides.
| Oligos (21mers) | Max2 Kd (nM) | ΔG(kJ) | Max-c-Myc Kd (nM) |
ΔG (kJ) | Max-Mad Kd (nM) |
ΔG (kJ) |
|---|---|---|---|---|---|---|
| Ebox | 19.2±4.4 | 43.3±0.5 | 90.5±25.4 | 39.6±0.8 | 192±48 | 37.7±0.6 |
| Half-Ebox | 48.7±8.3 | 41.1±0.3 | 229±35 | 37.3±0.3 | 315±83 | 36.5±0.6 |
| Non-Ebox | 87.0±20 | 39.0±0.4 | ------ | ------ | ------ | ------ |
Consider binding by each half-site and determine the cooperativity:
| (1) |
| (2) |
Where ΔGE-site is the additional free energy due to the specific site.
| (3) |
These equations partition the free energy to that associated with the optimum E box sequence and that associated with the “non-E box” sequence which retains some binding affinity.
Looked at from the perspective of DNA, one can determine two ΔΔG functions. These functions determine how much binding at one site can be said to influence the binding at the second site. These functions are:
This ΔΔG represents the additional free energy for the specific site (1/2 E Box)
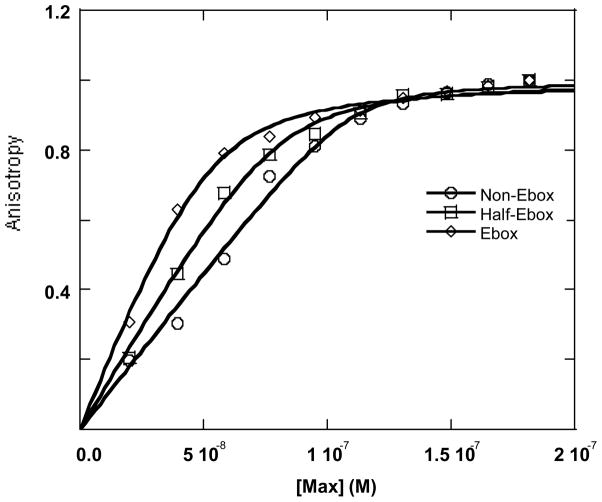
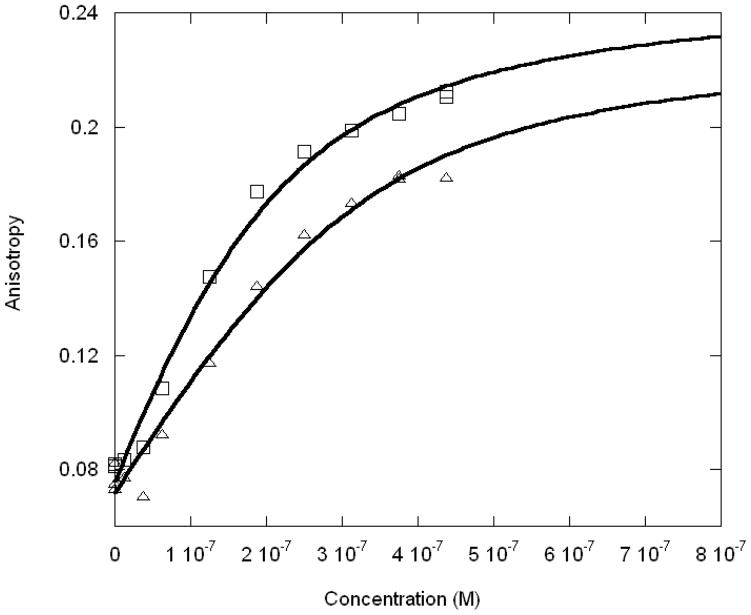
The extent to which these two numbers are different indicates cooperativity, non-cooperative or anti-cooperative binding. The binding curves for Max2-DNA are shown as Figure 2. Mad-Max and Myc-Max binding to oligonucleotides are shown as Fig. 3 and 4, respectively. A comparison of the equilibrium values in Table 2 shows that for Max homodimer, ΔΔG3,2 = 2.2kJ and ΔΔG2,1 = 2.0 kJ. There is an 0.2 KJ/mol ΔG difference between these two numbers, showing there may be a slight cooperativity in the Max binding with DNA to the two sites. Thus binding to one site only slightly, if at all, stabilizes the second binding site. However, the effects are very small and binding can be interpretted to be independent within experimental error. This indicates that the affinity of the second monomer for DNA, at least in the case of Max, is not greatly affected by the presence of Max already bound at one-half the E-box. Each half of the E-box contributes 2–3 kJ/mol to the binding free energy. However, it should be emphasized that this partitioning of the free energy relates to the effects of DNA sequence. The half-E-box and “non-E-box” oligonucleotides remove specific interactions. An H-bond between a conserved Arg in the basic region and a C=O in the base of C is removed in the case of half E-box and the second corresponding interaction is removed in the case of “non E-box” DNA. The protein-protein interactions have significant contributions to the overall binding energy.
Figure 2.
Anisotropy change for the interaction between Max protein and 3 different oligonucleotides. The concentration of Ebox (◇), half-Ebox (□) and non-Ebox (○) oligonucleotides were 50 nM. Temperature was 21 °C. The base sequences for the oligonucleotides are given in Material and Methods. The equilibrium constants obtained from the anisotropy change were listed in Table 2.
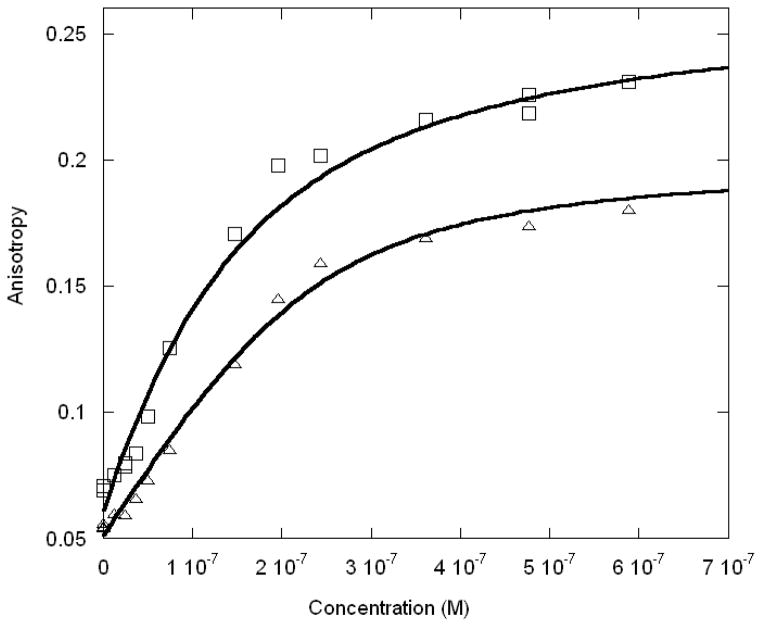
Figure 3.
Anisotropy change for the interaction between Myc-Max protein and Ebox (□) and half-Ebox (△) oligonucleotides. The experimental conditions are the same as for Figure 2.
Figure 4.
Anisotropy change for the interaction between Mad-Max protein and Ebox (□) and half-Ebox (△) oligonucleotides. The experimental conditions are the same as for Figure 2.
Titration experiments have been performed with Max-c-Myc and Max-Mad1 heterodimers to detect the free energy contribution of their interactions with the same E box, half E box and non-E box DNA sequences. The results showed the similarity Iin binding between these two heterodimers but very different binding from the Max homodimer (Table 2, Figures 3 and 4). For the heterodimers, the free energy differences between non-specific binding and E-box binding were much larger than for the Max homodimer interacting with DNA. We were unable to accurately measure binding of the heterodimers to the non-E box sequences. These results support the hypothesis that in the Myc/Max/Mad network, Max contributes more to the high binding affinity to the DNA, however recognition of DNA sequences is more likely contributed by Max’s partner, Myc or Mad. These results also support previous studies of binding preference that suggest Myc-Max heterodimers bind only a subset of the sites bound by Max homodimers, due to a differential recognition of the flanking sequences (46–48). O’Hagan et al. (47) argue that the basic regions of Myc and Mad are not functionally equivalent in oncogenesis, however James and Eisenman (49) suggest that Myc and Mad have identical DNA binding activities but the in vivo functions are different, presumably due to other factors. It will be interesting to determine the effects of other proteins on these interactions.
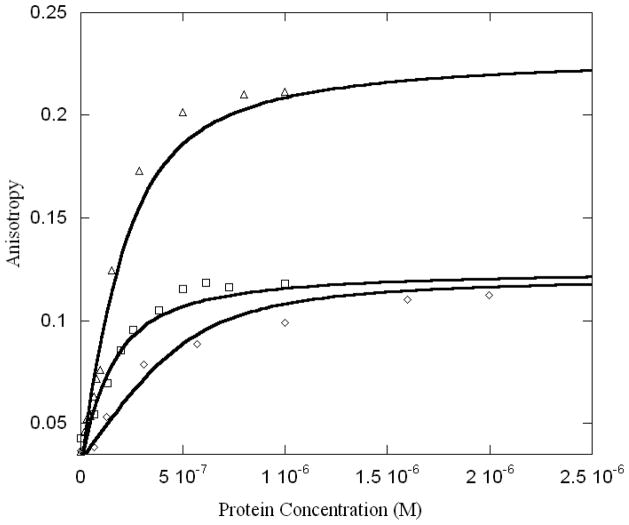
In order to determine monomer-dimer equilibrium constants, Max was fluorescently labeled at the N-terminus. The labeling site was confirmed by protein digestion. Max protein was labeled with fluorescein or TRITC, both dyes react covalently with uncharged amines. By using low pH, the N-terminus is the only site labeled. These fluorescent probes allow excitation in the 520–640 nm range which is well away from protein or DNA absorbance, thus minimizing inner-filter and other artifacts. Because anisotropy depends on the rotational relaxation time, an increase in molecular weight, such as dimer formation, is expected to increase the anisotropy. If there is no change in fluorescence lifetime and the limiting anisotropy is not reached, the change is directly proportional to the molecular weight change. Thus when labeled Max is titrated with unlabeled Max, Myc or Mad an increase in fluorescence anisotropy is expected. Figure 5 shows the anisotropy change observed. The larger anisotropy change for Mad (left curve) is due to the larger molecular weight of the heterodimer. The Max homodimer has a mw of ~ 20 kDa, Myc- Max heterodimer is ~23 kDa with GST removed from Myc, and Mad-Max is ~ 42 kDa. Tetramer formation of Myc-Max as reported from x-ray crystallography (22) would result in substantially higher values for the anisotropy. The stoichiometry of these reactions was determined by analysis of the anisotropy, which is related to the molecular weight as described above. When Max was titrated with a larger species (Mad or GST-Myc) the anisotropy was substantially higher. In addition, non-denaturing gel electrophoresis (data not shown) was consistent with dimer formation. There was no evidence of tetramer formation under these experimental conditions. Table 3 shows the binding constants obtained from fitting the anisotropy data.
Figure 5.
Dimerization of Max-Max (◇), Myc-Max (□), and Mad-Max (○). Max was labeled with TRITC. Labeled Max (100 nM) was titrated with increasing concentrations of unlabeled Max, Myc or Mad. For these experiments, GST was enzymatically removed from Myc. The temperature was 20 °C. The larger anisotropy change for Mad is attributed to the larger molecular mass.
Table 3.
Binding constants (Kd) for protein-protein interaction between Max-Max, Max-c-Myc and Max-Mad proteins.
| Max-Max (nM) | Max-c- Myc (nM) | Max-Mad (nM) |
|---|---|---|
| 680±44 | 176±12 | 320±25 |
Recently Park et al. (50) determined the kinetic rate constants for Myc-Max and Max-Max binding to an E-box oligonucleotide by gel electrophoresis. From the kinetic data, they obtained equilibrium constants for dimer binding to DNA and monomer-dimer equilibria. Park et al. (50) equilibrium constants for dimer binding were similar to our results for Myc-Max binding to DNA (Keq = 145 nM, our data 90.5 nM). The data presented here, however, for Max dimer binding, show an almost 7-fold tighter binding to DNA compared to the values obtained by Park et al. Similarly Park et al. show lower monomer-dimer affinity for Myc-Max interaction (78 μM compared to 176 nM). The differences in monomer-dimer equlibria may result from slightly different experimental conditions or from the difficulty in obtaining monomer-dimer values from gel electrophoresis experiments.
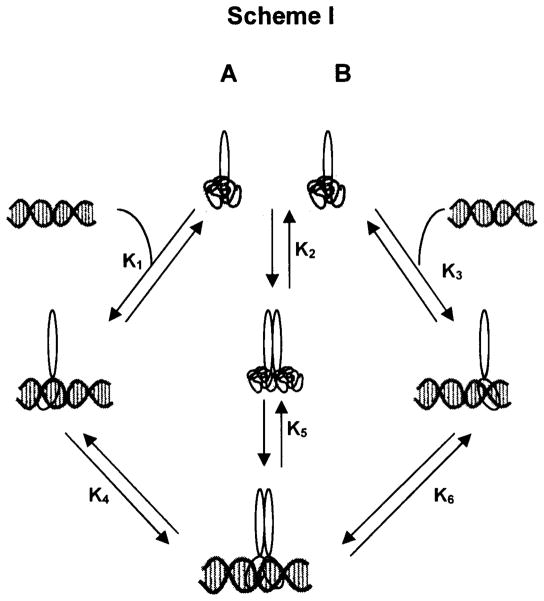
Assembly of the dimer-DNA complex for the Myc/Max/Mad proteins can be described by the cartoon shown in Fig 6. This cartoon represents the case for heterodimer-DNA formation where A and B are different monomers. The unstructured monomers interact with DNA (K1, K3) or each other (K2). The monomer pathway (K1, K4 or K3, K6) predicts the sequential addition of the second monomer. (For steps K4 and K6, the second monomer is not shown). The dimer binding pathway (K2, K5) is also included. In the case of homodimer formation, A and B are identical and therefore K1 = K3 and K4 = K6, thus simplifying the scheme. The protein monomer-dimer equilibrium (K2) is listed in Table 3. Dimer binding to DNA was also determined. For homodimers, it has been reported (35,35,51) that neither Myc nor Mad binds DNA very well. Consequently, if a solution is composed of Max and excess of either Myc or Mad as described in Methods, the predominant species will be Myc2 and Max-Myc. Using Myc-Max as an example, data indicate that the Myc-Max monomer-dimer equilibrium constant is around 0.2 micromolar and the Myc-Max-DNA binding is around 5 nanomolar. There is one important observation, however, that will allow us to determine the dimer-DNA equilibrium constant and that is the fact that Myc2 binds DNA poorly and that Myc forms a homodimer only weakly. We find that by having Max at low nanomolar concentrations and Myc at low micromolar concentration, essentially all of the Max is in the desired Myc-Max complex. At these low concentrations, there is negligible Max dimer present.
Figure 6.
Schematic diagram of monomer, dimer and DNA interactions.
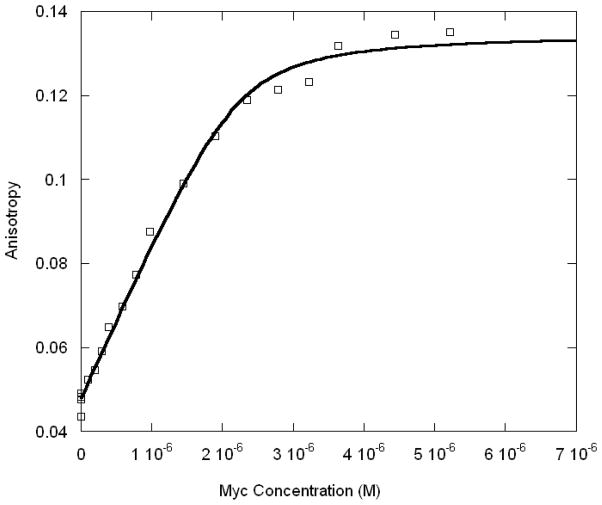
Given the equilibrium data, assembly of dimer-DNA complexes must follow a monomer pathway because binding to DNA occurs in the nanomolar range and monomer-dimer association occurs in the micromolar range. Therefore, there is virtually no dimer present initially when DNA is titrated with protein and the initial binding must be a monomer. A titration of DNA with low concentrations of Max, followed by Myc yields a fluorescence titration curve shown in Fig. 5. The Kobs is K1K4 in Scheme I (monomer binding to DNA followed by second monomer binding) where
Because of the low affinity of homodimeric Myc or Mad for DNA (27), binding of these monomers to DNA can be neglected. For all three proteins, K1 will be the same because Max binds first and is the only monomer protein that has a significant affinity for DNA.
The following expressions can be written:
where Kobs is the experimentally determined equilibrium constant from the binding curve, K1 is the monomer binding of Max to DNA and K4 is the sequential addition for each of the proteins as indicated. From these data one can obtain the relative affinity of Myc or Mad for Max-DNA (K4Myc/K4Mad).
The above relationships give three equations and four unknowns. However, we can use the thermodynamic cycle to write two additional expressions: K1 = K2MycK5Myc/K4Myc and K1 = K2MadK5Mad/K4Mad. K5, the dimer binding to DNA, was determined as described above for both Mad-Max and Myc-Max and the monomer-dimer equilibrium, K2 was determined for both proteins. By titration of a solution of labeled Max and excess DNA with either Myc or Mad, K4 was measured and using the above equations, K1 was also be obtained. Table 4 gives the relevant equilibrium values for the entire pathway. The values for K1 obtained by using the Myc equilibrium constants and the Mad equilibrium constants are different by less than a factor of two. This redundancy gives good agreement in the final parameters.
Table 4.
| Protein | K1 (K3) (nM) | K2 (nM) | K4 (K6) (uM) | K5 (nM) |
|---|---|---|---|---|
| cMyc | 6.8 ± 1.6 | 176 ± 12 | 2.2 ± 0.1 | 84 ± 10 |
| Mad | 10.2 ± 1.8 | 320 ± 25 | 5.3 ± 0.2 | 168 ± 14 |
| Max | 8.1 ± 1.2 | 680 ± 44 | 2.1 ± 0.1 | 15 ± 2 |
The values for K1 are for the first Max monomer binding to DNA as calculated from data for the binding of the Myc, Mad, or Max hetero- or homodimer as described in results.
Based on the equilibrium values obtained, the in vitro pathway during a titration follows a monomer pathway which is consistent with kinetic data (41). The binding of Max monomer occurs at concentrations well below the formation of dimers. The pathway forms a thermodynamic cycle and therefore the stability of the final complex will not depend on the pathway followed. These equilibrium data suggest that at physiological conditions, most of the DNA would have Max homodimer bound. Displacement and binding of the second (different) monomer to form a heterodimer-DNA complex may serve to aid in selection of DNA. The heterodimer binding affinity to non-E-box DNA is much lower. Therefore, if Max2-DNA is bound to a less favorable site, the displacement by Myc or Mad may well cause release of the protein. However, it is interesting to observe that the second monomer has much lower affinity for the monomer-DNA than the first monomer binding to DNA (micromolar compared to nanomolar affinity). It is clear from these data that binding of DNA to the Max monomer reduces the affinity for the second monomer. Looked at from the perspective of the Max protein, DNA binding reduces the affinity of Max for its partner protein. This is true whether Max forms heterodimers with Myc or Mad or forms a homodimer with a second Max monomer. Comparing K2 with K4, the second monomer is destabilized by 6.2 and 6.8 kJ/mole for Myc-Max or Mad-Max, respectively. These results are somewhat surprising given the stability of the dimer-DNA complex. The destabilization or anticooperative binding may result from the conformational change that monomers are believed to undergo upon binding. The basic region is largely unstructured in solution, but folds to an alpha helix upon binding to DNA. Whether this change occurs on the monomer level or only after the dimer has formed has not been determined. The effects of this conformational change on equilibria may be to destabilize non-specific interactions. The monomers are believed to have a fast on and off rate. A second monomer association may induce the conformational change which results in a more rigid conformation that interacts more precisely with the E-box. This dimer may have slower on and off rates. The equilibria predicts that the binding of the second monomer reduces the site occupancy, but the kinetics may determine the rate of formation of the complex.
The data reported here give new insight into the assembly of protein-DNA scaffolding and support the importance of protein-protein interactions in determining the selection and stability of dimer-DNA complexes. Further interactions of other protein factors such as Mnt and Mxl are likely to alter the stability of these complexes, largely through the protein-protein interactions. Such changes in stability are predicted to be important in regulation of the transcription complex composition and function and are possible targets for therapeutic intervention.
Figure 7.
Titration of Max-DNA (50 nM) with increasing concentrations of Myc protein. The E-box oligonucleotide labeled with 5′ FITC was used for the titration. Temperature was 21 °C.
Acknowledgments
This work was supported in part by NIH SCORE Grant (SO6 GM 60654) Research Centers in Minority Institutions Award RR-03037 from the National Center for Research Resources of the NIH supports infrastructure at Hunter College.
Abbreviations used
- b/HLH/z
basic helix-loop-helix/leucine zipper
- USF
upstream stimulatory factor
- DNA E-box
six base pair double stranded DNA sequence CACGTG known as enhancer box
- MLP
major late promoter
- LCR
human β-globin locus control region
- FITC
fluorescein isothiocyanate
- TRITC
tetramethylrhodamine isothiocyanate
- IPTG
isopropyl β-D-thioglalactopyranoside
- HEPES
4-(2-hydroxyethyl)-1-piperazineethanesulfonic acid
- EDTA
ethylenediaminetetraacetic acid
- DTT
dithiothreitol
- PBS
phosphate buffered saline
Reference List
- 1.Ferre-D’Amare AR, Pognonec P, Roeder RG, Burley SK. Structure and Function of the b/HLH/z Domain of USF. EMBO J. 1994;13:180–9. doi: 10.1002/j.1460-2075.1994.tb06247.x. [DOI] [PMC free article] [PubMed] [Google Scholar]
- 2.Ayer DE, Eisenman RN. A switch from Myc:Max to Mad:Max heterocomplexes accompanies monocyte/macrophage differentiation. Genes Dev. 1993;7:2110–9. doi: 10.1101/gad.7.11.2110. [DOI] [PubMed] [Google Scholar]
- 3.Amati B, Littlewood TD, Evan GI, Land H. The c-Myc protein induces cell cycle progression and apoptosis through dimerization with Max. EMBO J. 1993;12:5083–7. doi: 10.1002/j.1460-2075.1993.tb06202.x. [DOI] [PMC free article] [PubMed] [Google Scholar]
- 4.Littlewood TD, Amati B, Land H, Evan GI. Max and c-Myc/Max DNA-binding activities in cell extracts. Oncogene. 1992;7:1783–92. [PubMed] [Google Scholar]
- 5.Carr CS, Sharp PA. A helix-loop-helix protein related to the immunoglobulin E box-binding proteins. Mol Cell Biol. 1990;10:4384–8. doi: 10.1128/mcb.10.8.4384. [DOI] [PMC free article] [PubMed] [Google Scholar]
- 6.Muhle-Goll C, Nilges M, Pastore A. The leucine zippers of the HLH-LZ proteins Max and c-Myc preferentially form heterodimers. Biochemistry. 1995;34:13554–64. doi: 10.1021/bi00041a035. [DOI] [PubMed] [Google Scholar]
- 7.Beckmann H, Kadesch T. The Leucine Zipper of TFE3 Dictates Helix-Loop-Helix Dimerization Specificity. Genes Dev. 1991;5:1057–66. doi: 10.1101/gad.5.6.1057. [DOI] [PubMed] [Google Scholar]
- 8.Atchley WR, Fitch WM. Myc and Max: molecular evolution of a family of proto-oncogene products and their dimerization partner. Proc Natl Acad Sci USA. 1995;92:10217–21. doi: 10.1073/pnas.92.22.10217. [DOI] [PMC free article] [PubMed] [Google Scholar]
- 9.Billin AN, Eilers AL, Queva C, Ayer DE. Mlx, a novel Max-like BHLHZip protein that interacts with the Max network of transcription factors. J Biol Chem. 1999;274:36344–50. doi: 10.1074/jbc.274.51.36344. [DOI] [PubMed] [Google Scholar]
- 10.Billin AN, Eilers AL, Coulter KL, Logan JS, Ayer DE. MondoA, a novel basic helix-loop-helix-leucine zipper transcriptional activator that constitutes a positive branch of a Max-like network. Mol Cell Biol. 2000;20:8845–54. doi: 10.1128/mcb.20.23.8845-8854.2000. [DOI] [PMC free article] [PubMed] [Google Scholar]
- 11.Hurlin PJ, Queva C, Eisenman RN. Mnt: a novel Max-interacting protein and Myc antagonist. Curr Top Microbiol Immunol. 1997;224:115–21. doi: 10.1007/978-3-642-60801-8_11. [DOI] [PubMed] [Google Scholar]
- 12.Askew DS, Ashmun RA, Simmons BC, Cleveland JL. Constitutive c-myc expression in an IL-3-dependent myeloid cell line suppresses cell cycle arrest and accelerates apoptosis. Oncogene. 1991;6:1915–22. [PubMed] [Google Scholar]
- 13.Cole MD. Myc meets its Max. Cell. 1991;65:715–6. doi: 10.1016/0092-8674(91)90377-b. [DOI] [PubMed] [Google Scholar]
- 14.Evan GI, Littlewood TD. The role of c-myc in cell growth. Curr Opin Genet Dev. 1993;3:44–9. doi: 10.1016/s0959-437x(05)80339-9. [DOI] [PubMed] [Google Scholar]
- 15.Cerni C, Bousset K, Seelos C, Burkhardt H, Henriksson M, Luscher B. Differential effects by Mad and Max on transformation by cellular and viral oncoproteins. Oncogene. 1995;11:587–96. [PubMed] [Google Scholar]
- 16.Austen M, Cerni C, Henriksson M, Hilfenhaus S, Luscher-Firzlaff JM, Menkel A, Seelos C, Sommer A, Luscher B. Regulation of cell growth by the Myc-Max-Mad network: role of Mad proteins and YY1. 1997;224:123–30. doi: 10.1007/978-3-642-60801-8_12. [DOI] [PubMed] [Google Scholar]
- 17.McMahon SB, Wood MA, Cole MD. The Essential Cofactor TRRAP Recruits the Histone Acetyltransferase HGCN5 to cMyc. Mol Cell Biol. 2000;20:556–62. doi: 10.1128/mcb.20.2.556-562.2000. [DOI] [PMC free article] [PubMed] [Google Scholar]
- 18.Bouchard C, Dittrich O, Kiermaier A, Dohmann K, Menkel A, Eilers M, Luscher B. Regulation of cyclin D2 gene expression by the Myc/Max/Mad network: Myc-dependent TRRAP recruitment and histone acetylation at the cyclin D2 promoter. Genes Dev. 2001;15:2042–7. doi: 10.1101/gad.907901. [DOI] [PMC free article] [PubMed] [Google Scholar]
- 19.Murre C, McCam PS, Baltimore D. A New DNA Binding and Dimerization Motif in Immunoglobulin Enhancer bindng, Daughterless, MyoD and Myc Proteins. Cell. 1989;56:777–83. doi: 10.1016/0092-8674(89)90682-x. [DOI] [PubMed] [Google Scholar]
- 20.Amin C, Wagner AJ, Hay N. Sequence-specific transcriptional activation by Myc and repression by Max. Mol Cell Biol. 1993;13:383–90. doi: 10.1128/mcb.13.1.383. [DOI] [PMC free article] [PubMed] [Google Scholar]
- 21.Ferre-D’Amare AR, Prendergast GC, Ziff EB, Burley SK. Recognition by Max of its cognate DNA through a dimeric b/HLH/Z domain. Nature. 1993;363:38–45. doi: 10.1038/363038a0. [DOI] [PubMed] [Google Scholar]
- 22.Nair SK, Burley SK. X-ray structures of Myc-Max and Mad-Max recognizing DNA. Molecular bases of regulation by proto-oncogenic transcription factors. Cell. 2003;112:193–205. doi: 10.1016/s0092-8674(02)01284-9. [DOI] [PubMed] [Google Scholar]
- 23.Prendergast GC, Lawe D, Ziff EB. Association of Myn, the Murine Homolog of Max with c-Myc Stimulates Methylation-Sensitive DNA Binding and Ras Cotransformation. Cell. 1991;65:395–407. doi: 10.1016/0092-8674(91)90457-a. [DOI] [PubMed] [Google Scholar]
- 24.Wechsler DS, Dang CV. Opposite orientations of DNA bending by c-Myc and Max. Proc Natl Acad Sci USA. 1992;89:7635–9. doi: 10.1073/pnas.89.16.7635. [DOI] [PMC free article] [PubMed] [Google Scholar]
- 25.Sha M, Ferre-D’Amare AR, Burley SK, Goss DJ. Anti-Cooperative Biphasic Equlibrium Binding of Transcription Factor Upstream Stimulatory Factor to Its Cognate DNA Monitored by Protein Fluorescence Changes. J Biol Chem. 1995;270:19325–29. doi: 10.1074/jbc.270.33.19325. [DOI] [PubMed] [Google Scholar]
- 26.Xu D, Popov N, Hou M, Wang Q, Bjorkholm M, Gruber A, Menkel AR, Henriksson M. Switch from Myc/Max to Mad1/Max binding and decrease in histone acetylation at the telomerase reverse transcriptase promoter during differentiation of HL60 cells. Proc Natl Acad Sci USA. 2001;98:3826–31. doi: 10.1073/pnas.071043198. [DOI] [PMC free article] [PubMed] [Google Scholar]
- 27.Grandori C, Cowley SM, James LP, Eisenman RN. The Myc/Max/Mad network and the transcriptional control of cell behavior. Annu Rev Cell Dev Biol. 2000;16:653–99. doi: 10.1146/annurev.cellbio.16.1.653. [DOI] [PubMed] [Google Scholar]
- 28.Hurlin PJ, Queva C, Eisenman RN. Mnt, a novel Max-interacting protein is coexpressed with Myc in proliferating cells and mediates repression at Myc binding sites. Genes Dev. 1997;11:44–58. doi: 10.1101/gad.11.1.44. [DOI] [PubMed] [Google Scholar]
- 29.Hurlin PJ, Steingrimsson E, Copeland NG, Jenkins NA, Eisenman RN. Mga, a dual-specificity transcription factor that interacts with Max and contains a T-domain DNA-binding motif. EMBO J. 1999;18:7019–28. doi: 10.1093/emboj/18.24.7019. [DOI] [PMC free article] [PubMed] [Google Scholar]
- 30.Meroni G, Cairo S, Merla G, Messali S, Brent R, Ballabio A, Reymond A. Mlx, a new Max-like bHLHZip family member: the center stage of a novel transcription factors regulatory pathway? Oncogene. 2000;19:3266–77. doi: 10.1038/sj.onc.1203634. [DOI] [PubMed] [Google Scholar]
- 31.Cairo S, Merla G, Urbinati F, Ballabio A, Reymond A. WBSCR14, a gene mapping to the Williams-Beuren syndrome deleted region, is a new member of the M1x transcription factor network. Hum Mo Genet. 2001;10:617–27. doi: 10.1093/hmg/10.6.617. [DOI] [PubMed] [Google Scholar]
- 32.Kretzner L, Blackwood EM, Eisenman RN. Transcriptional activities of the Myc and Max proteins in mammalian cells. Curr Top Microbiol Immunol. 1992;182:435–43. doi: 10.1007/978-3-642-77633-5_55. [DOI] [PubMed] [Google Scholar]
- 33.Wechsler DS, Papoulas O, Dang CV, Kingston RE. Differential binding of c-Myc and Max to nucleosomal DNA. Mol Cell Biol. 1994;14:4097–107. doi: 10.1128/mcb.14.6.4097. [DOI] [PMC free article] [PubMed] [Google Scholar]
- 34.Dang CV. c-Myc target genes involved in cell growth, apoptosis, and metabolism. Mol Cell Biol. 1999;19:1–11. doi: 10.1128/mcb.19.1.1. [DOI] [PMC free article] [PubMed] [Google Scholar]
- 35.Amati B, Dalton S, Brooks MW, Littlewood TD, Evan GI, Land H. Transcriptional activation by the human c-Myc oncoprotein in yeast requires interaction with Max. Nature. 1992;359:423–6. doi: 10.1038/359423a0. [DOI] [PubMed] [Google Scholar]
- 36.Berberich SJ, Cole MD. Casein kinase II inhibits the DNA-binding activity of Max homodimers but not Myc/Max heterodimers. Genes Dev. 1992;6:166–76. doi: 10.1101/gad.6.2.166. [DOI] [PubMed] [Google Scholar]
- 37.Pulverer B, Sommer A, McArthur GA, Eisenman RN, Luscher B. Analysis of Myc/Max/Mad network members in adipogenesis: inhibition of the proliferative burst and differentiation by ectopically expressed Mad1. J Cell Physiol. 2000;183:399–410. doi: 10.1002/(SICI)1097-4652(200006)183:3<399::AID-JCP13>3.0.CO;2-7. [DOI] [PubMed] [Google Scholar]
- 38.Roussel MF, Ashmun R, Sherr C, Eisenman R, Ayer D. Inhibition of Cell Proliferation by the Mad1 Transcriptonal Repressor. Mol Cell Biol. 1996;16:2796–801. doi: 10.1128/mcb.16.6.2796. [DOI] [PMC free article] [PubMed] [Google Scholar]
- 39.Lakowicz JR. Principles of Fluorescence Spectroscopy. New York: Plenum Publishing Corp; 1983. [Google Scholar]
- 40.Sha M, Wang Y, Xiang T, van Heerden A, Browning K, Goss DJ. Interaction of wheat germ protein synthesis initiation factor eIF-(iso)4F and its subunits p28 and p86 with m7GTP and mRNA analogs. J Biol Chem. 1995;270:29904–9. doi: 10.1074/jbc.270.50.29904. [DOI] [PubMed] [Google Scholar]
- 41.Kohler J, Schepartz A. Kinetic Studies of Fos-Jun-DNA Complex Formation: DNA Binding Prior to Dimerization. Biochemistry. 2001;40:130–42. doi: 10.1021/bi001881p. [DOI] [PubMed] [Google Scholar]
- 42.Wei C-C, Balasta ML, Ren J, Goss DJ. Wheat germ poly(A) binding protein enhances the binding affinity of eukaryotic initiation factor 4F and (iso)4F for cap analogs. Biochemistry. 1998;37:1910–6. doi: 10.1021/bi9724570. [DOI] [PubMed] [Google Scholar]
- 43.Winston R, Gottesfeld J. Rapid identification of key amino-acid-DNA contacts through combinatorial peptide synthesis. Chem Biol. 2000;7:245–51. doi: 10.1016/s1074-5521(00)00099-5. [DOI] [PubMed] [Google Scholar]
- 44.Cave JW, Kremer W, Wemmer DE. Backbone dynamics of sequence specific recognition and binding by the yeast Pho4 bHLH domain probed by NMR. Protein Science. 2000;9:2354–65. doi: 10.1110/ps.9.12.2354. [DOI] [PMC free article] [PubMed] [Google Scholar]
- 45.Weber G. Energetics of Ligand Binding to Proteins. Adv Protein Chem. 1975;29:2–78. doi: 10.1016/s0065-3233(08)60410-6. [DOI] [PubMed] [Google Scholar]
- 46.Blackwell TK, Huang J, Ma A, Kretzner L, Alt FW, Eisenman RN, Weintraub H. Binding of myc proteins to canonical and noncanonical DNA sequences. Mol Cell Biol. 1993;13:5216–24. doi: 10.1128/mcb.13.9.5216. [DOI] [PMC free article] [PubMed] [Google Scholar]
- 47.O’Hagan RC, Schreiber-Agus N, Chen K, David G, Engelman JA, Schwab R, Alland L, Thomson C, Roning DR, Scchettini JC, et al. Gene Target Recognition Among Members of the Myc Superfamily and Implications for Oncogenesis. Nat Genet. 2000;24:113–19. doi: 10.1038/72761. [DOI] [PubMed] [Google Scholar]
- 48.Solomon DL, Amati B, Land H. Distinct DNA binding preferences for the c-Myc/Max and Max/Max dimers. Nucleic Acids Res. 1993;21:5372–6. doi: 10.1093/nar/21.23.5372. [DOI] [PMC free article] [PubMed] [Google Scholar]
- 49.James L, Eisneman R. Myc and Mad bHLHZ domains posses identical DNA-binding specificities but only partially overlapping functions in vivo. Proc Natl Acad Sci USA. 2002;99:10429–34. doi: 10.1073/pnas.162369299. [DOI] [PMC free article] [PubMed] [Google Scholar]
- 50.Park S, Chung S, Kim K-M, Jung K-C, Park C, Hahm E-R, Yang C-H. Determination of binding constant of transcription factor myc-max/max-max and E-box DNA: the effects of inhibitors on the binding. Biochim Biophys Acta. 2004;1670:217–28. doi: 10.1016/j.bbagen.2003.12.007. [DOI] [PubMed] [Google Scholar]
- 51.Blackwood EM, Luscher B, Eisenman RN. Myc and Max associate in vivo. Genes Dev. 1992;6:71–80. doi: 10.1101/gad.6.1.71. [DOI] [PubMed] [Google Scholar]


