

Abstract
We analyzed temporal changes in spatial patterns of active Schistosoma haematobium infection in different age groups and associated them with ponds infested with Bulinus snails. A major drought between 2001 and 2009 resulted in drying of ponds that were known sources of infection, and we detected very few or no snails in ponds that were infested in the past. The household-level spatial pattern of infection for children of various age groups in 2009 was contrasted with historical data from 2000. The significant local clustering of high- and low-infection levels among school-aged children that occurred in 2000 was absent in 2009. We attribute the disappearance of significant clustering around historical transmission hot spots to a decade-long drought in our study area. The implications of extreme weather and climate conditions on risk and transmission of S. haematobium and their relevance to control strategies are discussed.
Introduction
Urinary schistosomiasis remains a significant public health problem, especially in sub-Saharan Africa.1–4 In Kenya, the coastal strip is hyperendemic for urinary schistosomiasis but with substantial spatial and temporal heterogeneities.5 Local water use behavior and proximity of snail intermediate host breeding sites typically drive the focal distribution of schistosomiasis.6,7 Schistosoma haematobium has been studied in the Msambweni area since 1984.8 Prevalence has remained high (> 50%) over the years, despite introduction of alternative water sources (boreholes) and chemotherapy programs targeting school children.7,9,10
The intermediate host in coastal Kenya is Bulinus nasutus snails that are commonly found breeding in rain-fed ponds.11,12 Because most of the important transmission foci are rain-fed, rainfall is the key abiotic factor. Prolonged droughts can drastically curtail the survival and reproduction of snail intermediate hosts and eliminate transmission sites.11,12 In the Msambweni study area, human infection clusters were detected primarily around one transmission site, Nimbodze pond (Figure 1) which is located within Milalani village.12,13 Based on data from 2000 parasitological survey, we previously reported the presence of spatial clustering of S. haematobium infection around Nimbodze pond and then studied the influence of multiple transmission sources on infection patterns and their changing effect over time in Msambweni District, Coast Province, Kenya.5 Now, a decade later, we revisited the same study area and applied similar spatial analyses after a decade-long drought to detect changes in spatial clustering of infections at the household level.
Figure 1.
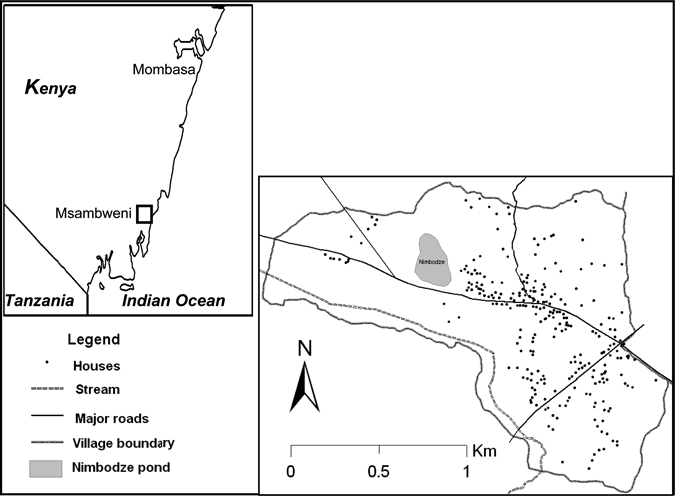
Milalani village households that were included in spatial analyses and Nimbodze pond.
Methods
Study area and population.
This study was carried out in Milalani village, Msambweni division, Msambweni district (formerly Msambweni Division, Kwale District) of the Coast Province of Kenya. It is located (4.47°S and 39.45°E) approximately 50 km south of Mombasa on the coastal plain along the Indian Ocean, with an approximate area of 2.37 km2 (Figure 1). In 2000 and 2003, parasitological surveys and treatment of schistosomiasis were done in Milalani, and this area was revisited in 2009. In 2009, there were 409 households in Milalani with a total of 1,645 people, of whom 47% participated in the parasitology survey (777 people in 240 households). The extent of the village differed slightly in 2009 compared with 2000; only houses within the 2009 extent were included in the analysis for the two study periods. With the new extent, we considered 269 of 279 houses that were analyzed in 2000 and a total of 1,074 people that were tested for S. haematobium.13 The area, population, and water sources have been described previously.5,12,13 Of the water sources mapped and studied in 2000, the spring-fed rivers and boreholes remained active, but the ponds were most often dry because of insufficient rainfall through 2009. Historically, despite the availability of clean water through boreholes and piped water supply, residents in the area prefer pond and stream/river water for laundry over the hard water from boreholes and open wells. They also use these surface sources for swimming and bathing.10,14
Of the water resources that have been monitored in the past from the Msambweni study area, we consider here the Nimbodze pond, which is located within Milalani village and was the subject of intensive study in 2000–2003; it was historically the most heavily infested with infected B. nasutus in 2000 data.
Snail sampling.
Five of six ponds in the Msambweni area (described in the work by Kariuki and others)12 were monitored for presence of S. haematobium intermediate host snails starting in July of 2008. These ponds (Bovo, Mwamagongo, Maridzani, Kiziamkala, and Nimbodze)12 had been studied in 2001–2003, and at that time, Nimbodze was the most heavily infested. In addition, we included a temporary pond, Chiziani, near Nganja village. The five known ponds were dry from July of 2008 to June of 2010, even during the long rains. However, B. nasutus snails were observed during both the long and short rains of 2009 in Chiziani pond. We initiated ongoing biweekly snail sampling in nine sites in the six ponds starting in June of 2010; snails were taken to the laboratory at Msambweni Hospital, separated by species, and tested for cercarial shedding.12,15
Ethical oversight.
Before collecting urine samples for determining S. haematobium infection status, informed consent was obtained from area residents (or their parents). These studies were performed under human investigations protocols approved by the Ethical Review Board of Kenya Medical Research Institute (Nairobi, Kenya; Non-SSC protocol 087) and the Human Investigations Review Board of University Hospitals (Cleveland, OH; 11-07-42) and Emory University (Atlanta, GA; IRB00009219).
Infection prevalence and intensity.
Residents of Milalani village submitted two midday urine specimens for examination for S. haematobium infection from 2000 to 2003; in 2009, they submitted one midday sample. Ten-milliliter aliquots from well-mixed urine samples were subjected to standard Nuclepore filtration,13,16 and individual infectious burden was determined by microscopic counting of the parasite eggs recovered on the filters. Urine tests during both study periods were conducted in a parasitology laboratory situated within Msambweni District Hospital. Milalani residents had been surveyed before 2000 and were treated with praziquantel in 2000, 2003, and September of 2009.
Aggregated household infection levels are reported as geometric mean density (number of parasites per 10 mL urine per person in a household, regardless of infection status), which is a function of both prevalence (the proportion of people infected in a household) and geometric mean intensity (the geometric mean number of parasites for only infected people infected in a household).13,17 We used mean density rather than mean intensity to allow for comparison with S. haematobium infection patterns in 2000.13 However, results were similar when only intensity was considered, because the household-level prevalence is high, resulting in similar patterns of mean intensity and mean density.
Statistical analysis.
We analyzed the pattern of infections in children 6–17 years of age, the age group that exhibits the highest infection levels.18 Differences in prevalence between age groups were tested using the homogeneity χ2 test. The Mann–Whitney U and Kruskal–Wallis tests were used for comparing distributions of infection intensity and density for two demographic groups and three or more demographic groups, respectively. These non-spatial statistical analyses were performed using SPSS version 17.0 software (SPSS Inc., Chicago, IL; www.spss.com).
Geospatial processing.
Households and water sources were mapped as described by Clennon and others5,13 using an Ikonos high-resolution satellite image comprised of 1-m2 panchromatic and 4-m2 multispectral images of Msambweni complemented by global positioning system (GPS) readings. During the 2001 and 2009 demographic surveys, each household was assigned the same village-affiliated household identification (HID), and each person was assigned an individual identification (ID) number incorporating the HID.5,13 Houses from 2000 that were still standing in 2009 and new houses were recorded, and information about movement of residents was collected.5 We were able to locate 269 homes from 2000 and 139 new homes in Milalani in 2009.
Household and water source locations were joined with demographic, parasitologic, malacologic, environmental (hydrological and topographical), and weather (rainfall) data. Location data were georectified to the Universal Transverse Mercator (UTM) zone 37S projection (1984 datum) in the GIS software package ArcGIS 9.3 (Environmental Systems Research Institute, Redlands, CA).
Spatial statistics.
For spatial analyses, children were grouped by age (6–9, 10–13, and 14–17 years). Global, local, and focal spatial analyses were used to examine the spatial structure of S. haematobium infection patterns and identify significant clustering of elevated infection levels in the study area. To allow for comparison with the 2000 infection pattern, we applied the spatial extent of Milalani village in 2009 to the more extensive coverage of Milalani in 2000 (we also considered houses in neighboring villages that were not studied in 2009).5,13
We initially tested for global clustering (i.e., to determine whether there is clustering anywhere in the study area) of households and intensity of infection by household using global second-order spatial analysis, global Ripley's K function,19 and global weighted K function.20 Details about these global spatial analysis tools were detailed in the work by Clennon and others.5,13 After determination of global clustering patterns, we applied local and focal clustering measures to detect specific locations where households with high-infection intensity were clustered and whether these high-intensity households were clustered around a suspected source of infection (pond containing infected snails).
We applied statistics developed by Getis and others,21 Getis and Ord,22, 23 and Ord and Getis,24 Gi*(d)/Gi(d), to test for local and focal clustering of the human infection patterns using Point Pattern Analysis software.25 The Gi*(d)/Gi(d) statistic was applied both as local and focal measures of clustering of infection around each household and around the centroid of Nimbodze Pond, which was considered the source point for potential focal clustering analyses. Clustering was considered up to a realistic walking distance of 1,500 m surrounding the potential transmission focus (Nimbodze Pond). The 2009 data were compared with data from the 2000–2003 survey,5 where more details about these statistics are provided.
Rainfall data.
Daily rainfall data were retrieved from the Ministry of Agriculture rain gauge located near Msambweni Hospital, which is ∼2.5 km from Milalani village.
Results
Snail collections.
In 2010, B. nasutus snails were only recovered from three of five large ponds studied in 2000–2003. In two of these ponds, Mwamagongo and Maridzani, 20 and 4 B. nasutus, respectively, were recovered before drying. Six B. nasutus were recovered for the first time from the third pond, Nimbodze, which has water to date (March of 2011), 10 months after the sampling was started. One snail from Maridzani shed S. haematobium cercariae, but no cercariae shedding was observed in any snail from Mwamagongo and Nimbodze. B. nasutus were consistently found in the Chiziani temporary pond every fortnight between June of 2010 and September of 2010. In total, 156 snails were recovered from Chiziani, and 6 of 156 snails shed S. haematobium cercariae. Among other snails, Lanistes purpureus was collected from all ponds except Kiziamkala, whereas B. forskalii was only found in Kiziamkala and Mwamagongo. B. forskalii snails were not shed in this study, because they have not been historically incriminated in urinary schistosomiasis transmission in the study area12 or elsewhere in east Africa.26 These findings are in sharp contrast to 2001–2003, when B. nasutus snails were found in all the large ponds (often in large numbers) as well as rice fields, and cercariae shedding B. nasutus snails were collected from Kiziamkala, Maridzani, Bovo, Mwamagongo, and in the highest proportion (2.5%), Nimbodze pond, where the highest number of Bulinus snails was also collected.12 In 2000, other snails (L. purpureus, B. forskalii, and Melanoides tuberculata) were collected from several ponds.12
Infection prevalence and intensity.
In 2009, we were able to determine the locations of 409 households with 1,645 residents (Figure 1). From those households, 777 (47.2%) residents submitted urine samples that were tested for S. haematobium eggs, and 336 (43.2%) of these samples were positive. Among the tested individuals, the age distribution was ≤ 5 years (31), 6–9 years (135), 10–13 years (152), 14–17 years (101), 18–21 years (48), and ≥ 22 years (310). The overall geometric mean infection intensity was 28.9 eggs/10 mL urine. The mean ± standard deviation (SD) number of school-aged children tested per household was 1.61 ± 0.67. When all age groups were considered, infection prevalence and mean intensity varied significantly by age group (homogeneity χ2 = 201, P < 0.001; Kruskal–Wallis χ2 = 134, P < 0.001) (Figure 2). Infection levels were highest in individuals 6–21 years, with infection prevalence peaking from 10 to 17 years and intensity peaking from 10 13 years.
Figure 2.
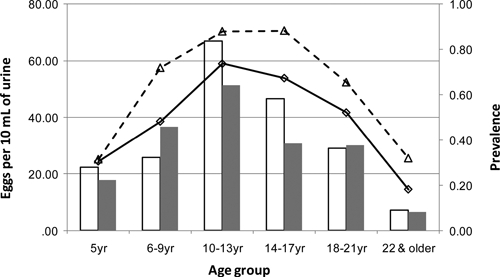
Prevalence of infection in Milalani village in 2000 (---Δ---) and 2009 (––□––) and geometric mean intensity of eggs/10 mL urine in 2000 (open bars) and 2009 (shaded bars).
In 2000, 269 households were located within the same village extent as the 2009 data. From those households, 1,053 residents submitted urine samples that were tested for S. haematobium eggs, and 587 (55.7%) of these samples were positive, with geometric mean infection intensity of 25.9 eggs/10 mL urine. Among the tested individuals, the age distribution was 5 years (35), 6–9 years (153), 10–13 years (158), 14–17 years (128), 18–21 years (87), and ≥ 22 years (492). Within age groups, infection intensity levels were comparable between the two study periods, with most age groups recording higher infection intensity levels in 2000 (Figure 2). However, the overall infection intensity was lower in 2000 compared with 2009 because of the lower proportion of children among those people tested in 2009. Infection prevalence was lower across all age groups in 2009, with an overall decline in prevalence of 12.5% (χ2 = 28.0, P < 0.0001).
Spatial infection patterns.
Global patterns.
In 2009, the significantly high spatial aggregation (K function) of households with high-intensity (> 100 eggs/10 mL urine) infection observed in 20005 was not repeated when all ages were pooled, indicating that heavy household-level infections were distributed more randomly throughout Milalani village. When the effect of age was considered and different ages were considered separately, a small significant peak in global clustering at 300–400 m was detected for 10- to 13-year-old children. In contrast, when applied to the same spatial extent for the 2000 Milalani infection data, weighted K function revealed global clustering of household infection density, with peak clustering at around distances of 150 m for the pooled data and each age group, indicating tight clustering of households with high intensity of infection.
Local patterns.
When we tested for local clusters of infection using the Gi(d) statistic, we detected no significant local clusters in 2009, either for the pooled data or when age groups were considered separately. This lack of local clustering stands in sharp contrast to the 2000 Milalani data (again using the 2009 spatial extent), when significant local clusters of households with high-infection levels were detected for all age groups at distances of 500 m from Nimbodze pond.
Focal clustering of infection.
Focal clustering of infection density around Nimbodze pond varied by age and between the two study periods. In 2009, there were no noticeable infection clusters in children 6–9 and 10–13 years, and the only significant clustering of infection was found in adolescents (14–17 years) at a distance of 300 m from Nimbodze (Figure 3A). When patterns of infection density are compared with data from 2000, differences in the patterns of clustering are apparent. In 2000, significant clustering of high-infection density for all age groups of children was detected starting at different distances from Nimbodze (Figure 3B). Clustering of infection levels in 6- to 9-year-old children was significant starting at 350 m, and for children 10–13 and 14–17 years, significance was from 600 to 700 m. In all age groups in 2000, clustering was significant up to a distance of 1,100 m. High-infection levels for all age groups were significantly clustered at a range of 400–800 m, but the degree and extent of clustering were higher for 6–9 and 10–13 years than for the older children (14–17 years). Infections were not clustered around any other permanent or temporary pond in either 2000 or 2009.
Figure 3.
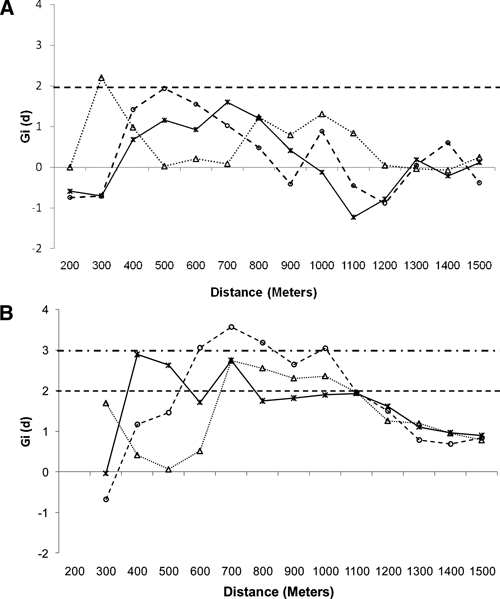
Focal clustering (Gi[d] > 1.96, P < 0.05) detected around Nimbodze Pond in different age groups of children in (A) 2009 and (B) 2000 for children 6–9 (___X___), 10–13 (--○--), and 14–17 (……Δ……) years. Dashed line is 0.05 significance level. Alternating small and long dashed lines is 0.01 significance level.
Rainfall patterns.
In general, rainfall followed the typical bimodal pattern of the Kenyan coast.11,27 The long rainy season usually occurs from April to June, and the short rainy season occurs between October and December. There is also a short dry season between July and September and a long dry season between January and March (Table 1). The classification of seasons on the coast is not fixed; sometimes, overlaps of about 1 month may occur. Major peaks in the amount of rainfall were usually reported in April through June from 2001 to 2010, with the exception of 2006, when the major peaks were seen in October/November (Table 1).
Table 1.
Seasonal rainfall (in millimeters) patterns of the Msambweni area from 2001 to 2010
| Year | January to March | April to June | July to September | October to December | Total | Pond* |
|---|---|---|---|---|---|---|
| 2001 | 150.5 | 1,145 | 118 | 57 | 1,470.5 | Water/dry |
| 2002 | 186.8 | 336.2 | 401.9 | 353.2 | 1,278.1 | Dry |
| 2003 | 63.9 | 865.1 | 183.9 | 212.3 | 1,325.2 | Water/dry |
| 2004 | 128.4 | 279.4 | 113.4 | 256.7 | 777.9 | Dry |
| 2005 | 109.3 | 533 | 279.8 | 250.4 | 1,172.5 | Dry |
| 2006 | 94.9 | 625.6 | 340.8 | 727.3 | 1,788.6 | Water/dry |
| 2007 | 132 | 902.6 | 236.7 | 147 | 1,418.3 | Water |
| 2008 | 59.8 | 413.9 | 143.5 | 264.2 | 881.4 | Dry |
| 2009 | 56.8 | 417.8 | 210.9 | 335.9 | 1,021.4 | Dry |
| 2010 | 135.6 | 1,514.7 | 218.7 | 265.1 | 2,134.1 | Water/dry |
| Average rainfall | 111.8 | 703.3 | 224.8 | 286.9 | 1,326.8 |
Water/dry denotes that most ponds did not have water throughout the year; dry denotes that most ponds were dry throughout the year, whereas water means that most ponds had water throughout the year.
In 2001 and 2003, after sufficient rains during the long rainy season, all the ponds were filled but were not sustained throughout the year, because the short rains failed (Table 1). The rainfall pattern experienced in 2002 (small amounts of rain over a long period of time) did not allow accumulation of sufficient amounts of water to fill most ponds. There was insufficient rainfall in both of the rainy seasons to fill most ponds in 2004, 2005, 2008, and 2009 (Table 1). Thus, our study area has experienced two cycles of drought over the 2001–2010 decade: from 2002 to 2006 and from 2008 to 2010 (Figure 4).
Figure 4.
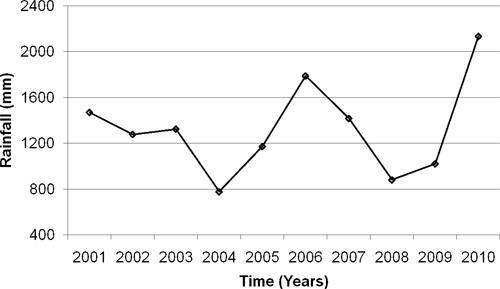
Rainfall at the Msambweni District agricultural office from 2001 to 2009.
Although we characterize the decade of 2001–2010 as a drought period, rainfall patterns for the period varied, and heavy rains did fill up the transmission sites in April–June of 2001, 2003, 2006, 2007, and 2010. However, lack of sufficient rains after these rainfall events resulted in the transmission sites drying up within a few months, even in the years with average amounts of total rainfall, resulting in no long-term establishment of infected B. nasutus snail populations.
Discussion
In our previous studies in Milalani village, we detected highly significant spatial clusters of infected school children on the household level in 1984 and 2000.5,13 No mass drug administration for schistosomiasis has taken place in the village during the last decade, and routinely, only a small proportion of those people infected seek treatment (data not shown). Thus, the disappearance of schistosomiasis infection clusters and the relatively modest (although significant) 12.5% decline in prevalence from 55.7% to 43.2% during the current study period are noteworthy. We attribute these changes to the disappearance of the most influential transmission sites and resulting changes in water contact. The transmission sites in Msambweni area, including Nimbodze pond, which is described extensively elsewhere,12 have largely remained dry during the course of the study period and short-lived when available because of unstable rains. Marked declines in infection prevalence after prolonged droughts have been reported from Ethiopia,28 Nigeria,29 and Zimbabwe.30
Rainfall patterns have changed considerably in the study area, with two drought cycles reported over the last 10 years (Figure 4 and Table 1). Not only did the transmission sites remain mostly dry during the drought years, but also, even in the few years with average rainfall (except for 2006), the short rains (October and November) that fill the ponds in preparation for the long dry season (December to March) failed. Snails survive the seasonal drying out of habitats by aestivation, but they are likely to die when drought conditions persist for more than 8 months and when these conditions are more frequent.31 This condition is precisely the situation that has been ubiquitous in our study area over the last 10 years, and it is a likely explanation for the continuing absence of intermediate host snails from the relatively large ponds that were historically the important transmission foci (i.e., Nimbodze, Kiziamkala, and Maridzani). Indeed, this condition is still the situation in March of 2010, 10 months after being refilled by the heavy 2010 April to May rains.
Bulinus snails usually aestivate around the margins of the transmission sites and only emerge when the sites are flooded. As a result of this strategy, it seems that, although in the relatively large ponds, most of the aestivating snails and especially those snails that were infected died, because the ponds remained dry for 12 months or more, some snails did survive in temporary ponds, such as Chiziani, that are more frequently filled, even when the rains are insufficient to fill the larger ponds.26 In aestivation, uninfected snails usually survive longer than the infected snails, and therefore, snails that do survive the drought are likely not infected.26 These findings also suggest that transmission is currently sustained by temporary snail habitats rather than the more permanent ones that were in the past foci of transmission, although spatial analysis did not detect clustering of infection around the temporary pond, which is > 1 km from Milalani. Whether this relatively high importance of ephemeral habitats will hold in the future is a subject for additional investigations.
Overall, the loss of local/focal clustering of infection in the community that continues to maintain high-infection prevalence and intensity indicates that the process of schistosomes' transmission is more uniformly distributed across the community. This shift in spatial infection pattern from clustering around well-defined transmission hot spots means that, in this setting, there is a need to consider the value of community-wide interventions rather than just those measures concentrated on focalized efforts aimed at only a few hot spots that may not drive transmission at all times.
The absence of snails in Nimbodze pond for 9 months after being refilled may be explained in part by the destruction of the well-defined dispersal corridors among irrigation scheme and stream/rivers described by us elsewhere.32 Since 2008, there is a shift from rice cultivation (2000–2007) to sugar cane cultivation in the western parts of Nimbodze, especially near the Koromonjo reservoir, the main source of reflooding of Nimbodze and other ponds after sufficient rains. Sugar cane cultivation may have impeded snail dispersal through the two routes, which was identified by Clennon and others.32 Unlike rice cultivation, sugar cane cultivation reduces water pooling, subsequently restricting habitat connectivity.32
In conclusion, inadequate and unpredictable precipitation in Msambweni area during the study period has diminished the historical importance of Nimbodze as a focus for urinary schistosomiasis transmission. The long-term drought and hydrological changes have resulted in the absence of Bulinus intermediate host snails in the pond for at least 9 months after the refilling of the pond. Our current findings point to the potential impact of climatic variability and anthropogenic changes on transmission patterns of S. haematobium. Such changes need to be considered when implementing urinary schistosomiasis surveillance and control programs.
ACKNOWLEDGMENTS
The authors want to acknowledge the residents of Milalani village for their participation. We are grateful to the community health workers in Milalani village Khalfan Kisira and Jamhuri Ubao. The authors thank all Division of Vector Borne Neglected and Tropical Diseases laboratory technicians who provided parasitology results. Julie Clennon and Donal Bisanzio provided assistance with data analysis.
Footnotes
Financial support: This work was supported by National Institutes of Health Research Grant R01 TW 008067 funded by the National Institutes of Health/National Science Foundation Ecology of Infectious Diseases Program through the Fogarty International Center.
Authors' addresses: Francis M. Mutuku and Uriel Kitron, Department of Environmental Studies, Emory University, Atlanta, GA, E-mails: fmutuku73@gmail.com and ukitron@emory.edu. Charles H. King, Center for Global Health and Diseases, Case Western Reserve University School of Medicine, Cleveland, OH, E-mail: chk@case.edu. Amaya L. Bustinduy, Center for Global Health and Diseases, Case Western Reserve University School of Medicine, Cleveland, OH, and Department of Paediatrics, Great Ormond Street Hospital for Children, London, United Kingdom, E-mail: BustiA@gosh.nhs.uk. Peter L. Mungai, Filariasis-Schistosomiasis Research Unit, Division of Vector Borne Neglected and Tropical Diseases, Case Western Reserve University, Msambweni, Kenya, E-mail: plmungai@yahoo.com. Eric M. Muchiri, Division of Vector Borne Neglected and Tropical Diseases, Ministry of Public Health and Sanitation, Nairobi, Kenya, E-mail: ericmmuchiri@gmail.com.
References
- 1.Chitsulo O, Engels D, Montresor A, Savioli L. The global status of schistosomiasis and its control. Acta Trop. 2000;77:41–51. doi: 10.1016/s0001-706x(00)00122-4. [DOI] [PMC free article] [PubMed] [Google Scholar]
- 2.Stothard JR, Chitsulo O, Kristensen TK, Utzinger J. Control of schistosomiasis in sub-Saharan Africa: progress made, new opportunities and remaining challenges. Parasitology. 2009;136:1665–1675. doi: 10.1017/S0031182009991272. [DOI] [PubMed] [Google Scholar]
- 3.van der Werf MJ, de Vlas SJ, Brooker S, Looman CW, Nagelkerke NJ, Habbema JD, Engels D. Quantification of clinical morbidity associated with schistosome infection in sub-Saharan Africa. Acta Trop. 2003;86:125–139. doi: 10.1016/s0001-706x(03)00029-9. [DOI] [PubMed] [Google Scholar]
- 4.World Health Organization . Prevention and Control of Schistosomiasis and Soil Transmitted Helminthiasis: Report of a WHO Expert Committee. World Health Organ Technical Report Series 912. Geneva, Switzerland: World Health Organization; 2002. pp. 2–5. [PubMed] [Google Scholar]
- 5.Clennon JA, Mungai P, Muchiri EM, King CH, Kitron U. Spatial and temporal variations in local transmission of Schistosoma haematobium in Msambweni, Kenya. Am J Trop Med Hyg. 2006;75:1034–1041. [PubMed] [Google Scholar]
- 6.Rudge JW, Stothard JR, Basáñez M, Mgeni AF, Khamis IS, Khamis AN, Rollinson D. Micro-epidemiology of urinary schistosomiasis in Zanzibar: local risk factors associated with distribution of infections among schoolchildren and relevance for control. Acta Trop. 2008;105:45–54. doi: 10.1016/j.actatropica.2007.09.006. [DOI] [PubMed] [Google Scholar]
- 7.Satayathum SA, Muchiri EM, Ouma JH, Whalen CC, King CH. Factors affecting infection or reinfection with Schistosoma haematobium in coastal Kenya: survival analysis during a nine-year, school-based treatment program. Am J Trop Med Hyg. 2006;75:83–92. [PMC free article] [PubMed] [Google Scholar]
- 8.King CH. Long-term outcomes of school-based treatment for control of urinary schistosomiasis: a review of experience in Coast Province, Kenya. Mem Inst Oswaldo Cruz. 2006;101:299–306. doi: 10.1590/s0074-02762006000900047. [DOI] [PubMed] [Google Scholar]
- 9.King CH, Muchiri EM, Ouma JH, Koech D. Chemotherapy-based control of schistosomiasis haematobia. IV. Impact of repeated annual chemotherapy on prevalence and intensity of Schistosoma haematobium infection in an endemic area of Kenya. Am J Trop Med Hyg. 1991;45:498–508. doi: 10.4269/ajtmh.1991.45.498. [DOI] [PubMed] [Google Scholar]
- 10.Muchiri EM, Ouma J, King CH. Dynamics and control of Schistosoma haematobium transmission in Kenya: an overview of the Msambweni project. Am J Trop Med Hyg. 1996;55:127–134. doi: 10.4269/ajtmh.1996.55.127. [DOI] [PubMed] [Google Scholar]
- 11.Sturrock RF, Kinyanjui H, Thiongo FW, Tosha S, Ouma JH, King CH, Koech D, Siongok TK, Mahmoud AAF. Chemotherapy-based control of schistosomiasis haematobia. 3. Snail studies monitoring the effect of chemotherapy on transmission in the Msambweni area, Kenya. Trans R Soc Trop Med Hyg. 1990;84:257–261. doi: 10.1016/0035-9203(90)90278-m. [DOI] [PubMed] [Google Scholar]
- 12.Kariuki HC, Clennon JA, Brady MS, Kitron U, Sturrock RF, Ouma JH, Ndzovu M, Mungai P, Hoffman O, Hamburger J, Pellegrini C, Muchiri EM, King CH. Distribution patterns and cercarial shedding of Bulinus nasutus and other snails in the Msambweni area, Coast Province, Kenya. Am J Trop Med Hyg. 2004;70:449–456. [PubMed] [Google Scholar]
- 13.Clennon JA, King CH, Muchiri EM, Kariuki HC, Ouma JH, Mungai P, Kitron U. Spatial patterns of urinary schistosomiasis infection in a highly endemic area of coastal Kenya. Am J Trop Med Hyg. 2004;70:443–444. [PubMed] [Google Scholar]
- 14.el Kholy H, Siongok TK, Koech D, Sturrock RF, Houser H, King CH, Mahmoud AAF. Effects of borehole wells on water utilization in Schistosoma haematobium endemic communities in Coast province, Kenya. Am J Trop Med Hyg. 1989;41:212–219. doi: 10.4269/ajtmh.1989.41.212. [DOI] [PubMed] [Google Scholar]
- 15.Ouma JH, Sturrock RF, Klumpp RK, Kariuki HC. A comparative evaluation of snail sampling and cercariometry to detect Schistosoma mansoni transmission in a large-scale, longitudinal field-study in Machakos, Kenya. Parasitology. 1989;99:349–355. doi: 10.1017/s0031182000059060. [DOI] [PubMed] [Google Scholar]
- 16.Peters PAS, Kazura JW. In: Balliere's Clinical Tropical Medicine and Communicable Diseases, Schistosomiasis. Maa F, editor. London, United Kingdom: Bailliere Tindall; 1987. pp. 419–433. (Update on diagnostic methods for schistosomiasis). [Google Scholar]
- 17.Kitron UD, Higashi GI. Schistosoma haematobium in Upper Egypt: analysis of dispersion patterns. Am J Trop Med Hyg. 1985;34:331–340. doi: 10.4269/ajtmh.1985.34.331. [DOI] [PubMed] [Google Scholar]
- 18.King CH, Lombardi G, Lombardi C, Greenblatt R, Hodder S, Kinyanjui H, Ouma J, Odiambo O, Bryan PJ, Muruka J. Chemotherapy-based control of schistosomiasis haematobia. I. Metrifonate versus praziquantel in control of intensity and prevalence of infection. Am J Trop Med Hyg. 1988;39:295–305. doi: 10.4269/ajtmh.1988.39.295. [DOI] [PubMed] [Google Scholar]
- 19.Ripley BD. The second-order analysis of stationary point processes. J Appl Probab. 1976;13:255–266. [Google Scholar]
- 20.Getis A. Interaction modeling using second-order analysis. Environ Plan A. 1984;16:173–183. [Google Scholar]
- 21.Getis A, Morrison AC, Gray K, Scott TW. Characteristics of the spatial pattern of the dengue vector, Aedes aegypti, in Iquitos, Peru. Am J Trop Med Hyg. 2003;69:494–505. [PubMed] [Google Scholar]
- 22.Getis A, Ord JK. The analysis of spatial association by use of distance statistics. Geogr Anal. 1992;24:189–206. [Google Scholar]
- 23.Getis A, Ord JK. Local spatial autocorrelation statistics: distributional issues and an application. Geogr Anal. 1995;27:286–306. [Google Scholar]
- 24.Ord JK, Getis A. In: Spatial Analysis: Modeling in a GIS Environment. Longley P, Batty M, editors. Cambridge, United Kingdom: Geoinformation International; 1996. pp. 261–277. (Local spatial statistics: an overview). [Google Scholar]
- 25.Chen D, Getis A. Point Pattern Analysis. San Diego, CA: Department of Geography, San Diego State University; 1998. [Google Scholar]
- 26.Webbe G. The transmission of Schistosoma haematobium in an area of Lake Province, Tanganyika. Bull World Health Organ. 1962;27:59–85. [PMC free article] [PubMed] [Google Scholar]
- 27.Williams GB. The rainfall of the British East Africa Protectorate. Geogr J. 1907;29:654–660. [Google Scholar]
- 28.Zein AZ. Spontaneous reduction in Schistosoma mansoni infection in endemic communities of the lake Tana basin, north-western Ethiopia. Trans R Soc Trop Med Hyg. 1989;83:656–658. doi: 10.1016/0035-9203(89)90389-1. [DOI] [PubMed] [Google Scholar]
- 29.Pugh RNH, Gilles HM. Malumfashi endemic diseases project. III. Urinary schistosomiasis: a longitudinal study. Ann Trop Med Parasitol. 1978;72:471–482. doi: 10.1080/00034983.1978.11719347. [DOI] [PubMed] [Google Scholar]
- 30.Chandiwana SK, Makaza D, Taputaira A. Variations in the incidence of schistosomiasis in the highveld regions of Zimbabwe. Trop Med Parasitol. 1987;39:313–319. [PubMed] [Google Scholar]
- 31.Rollinson D, Stothard JR, Southgate VR. Interactions between intermediate snail hosts of the genus Bulinus and schistosomes of the Schistosoma haematobium group. Parasitology. 2001;123:S245–S260. doi: 10.1017/s0031182001008046. [DOI] [PubMed] [Google Scholar]
- 32.Clennon JA, King CH, Muchiri EM, Kitron U. Hydrological modelling of snail dispersal patterns in Msambweni, Kenya and potential resurgence of Schistosoma haematobium transmission. Parasitology. 2007;134:683–693. doi: 10.1017/S0031182006001594. [DOI] [PubMed] [Google Scholar]