

Abstract
Tanzania implemented artemether-lumefantrine (AL) as the first-line treatment for uncomplicated malaria in November of 2006 because of resistance to sulfadoxine-pyrimethamine. AL remains highly efficacious, but widespread use may soon facilitate emergence of artemisinin tolerance/resistance, which initially may be detected at the molecular level as temporal changes in the frequency of single nucleotide polymorphisms (SNPs) in the Pfmdr-1 gene associated with AL resistance. In Tanzania, 830 Plasmodium falciparum-positive samples collected between 2003 and 2010 were examined for SNPs of Pfmdr-1 at codons 86, 184, and 1246. Both the N86 and 184F increased from 2006 to 2010 (logistic regression; N86: odds ratio [95% confidence interval] = 1.35 [1.07–1.71], P = 0.01; 184F: odds ratio = 1.42 [1.07–1.88], P = 0.02), and no change was found for D1246 (odds ratio = 1.01 [0.80–1.28], P = 0.9). The observed changes may be because of introduction of AL, and if so, this finding gives cause for concern and argues for continued surveillance of these molecular markers.
Introduction
Malaria remains a major cause of morbidity and mortality today, especially in children under the age of 5 years in sub-Saharan Africa. According to the World Malaria Report in 2009,1 one-half of the world's population is at risk of malaria, and an estimated 243 million cases led to nearly 863,000 deaths in 2008.1 Over 90% of the mortalities were caused by infections with Plasmodium falciparum, which accounted for 80% of all malaria cases.1 A major reason for the continuing scourge of malaria is the development of resistance to antimalarial drugs, where drugs such as chloroquine (CQ), amodiaquine (AQ), and sulfadoxine-pyrimethamine (SP) have become obsolete in malaria-endemic countries.2,3 The World Health Organization (WHO) has introduced the concept of artemisinin-based combination therapies (ACTs) as replacements for CQ, AQ, and SP in treatment of uncomplicated malaria infections. ACTs have consecutively been shown to be highly efficacious and until recently, without signs of drug resistance. As P. falciparum resistance developed to CQ, AQ, and SP, the primary cause for resistance development was identified as single nucleotide polymorphisms (SNPs) in P. falciparum genes. Moreover, the level of resistance in vivo is reasonably reflected in the prevalence of SNPs, which has enabled the development of molecular maps of global drug resistance (see, for instance, www.drugresistancemaps.org); these maps provide a tool to monitor the emergence and spread of antimalarial drug resistance.4
The P. falciparum multi-drug resistance gene 1 (Pfmdr-1) has been associated with resistance to different drugs, and particularly, SNPs resulting in an amino acid change in codons 86 (N86Y), 184 (Y184F), and 1246 (D1246Y) have been related to CQ and AQ resistance. For instance, the Pfmdr-1 86Y mutation has been associated with high CQ resistance if present along with the P. falciparum chloroquine resistance transporter (Pfcrt) K76T genotype,5,6 whereas two studies have shown that the combination of Pfmdr-1 86Y, Y184, and 1246Y was selected by AQ monotherapy and increased the risk of treatment failure.7,8 Conversely, when artesunate-AQ or artemether-lumefantrine (AL) was administered7,8 the N86, 184F, and D1246 were selected. Similarly, in vivo selection of SNPs N86,7,9,10 184F,7,10 and D12467 of Pfmdr-1 after AL treatment has been reported. Contrarily, in vitro studies have shown that parasites expressing the Pfmdr-1 combination N86-Y184 were significantly less sensitive to lumefantrine, artemether, and dihydroartemisinin compared with parasites bearing 86Y or 184F.11 Recently, ACT drug resistance has been reported at the Thai–Cambodian border.12,13 Surveillance of changes in prevalence of SNPs in the Pfmdr-1 gene may serve as an early warning tool of emerging P. falciparum tolerance/resistance to ACTs.14 This finding is especially important in Eastern Africa, which has previously been a major focus area of drug resistance development in sub-Saharan Africa.15,16
In this study, the prevalence of SNPs in the Pfmdr-1 gene at codons 86, 184, and 1246 in two villages of Korogwe, Tanzania was examined for changes in their distribution over time (2003–2010). Although SNPs at codons 1034 and 1042 have also been implicated in ACT drug resistance development, these SNPs were not studied here. Tanzania changed its drug policy for the treatment of uncomplicated malaria from CQ to SP in 2001 and then, from SP to AL in late 2006. In the two study villages, AL was distributed through mobile clinics starting in January of 2007. During the SP era, AQ was used as a second-line antimalarial drug. As previously described,17 the study area has experienced a dramatic reduction in the prevalence of malaria parasitemia, which in Mkokola, dropped from 78% in 2003 to 13% in 2008, whereas in Kwamasimba, the prevalence of parasitemia dropped from 25% to 3%. In 2009, point prevalence in children under 5 years of age was 0% in Kwamasimba, and for Mkokola, it was 4%; in 2010, it was 0% and 3%, respectively (unpublished data). Such a significant improvement in the control of malaria in this particular area has most likely been driven by the implementation of efficacious ACTs; thus, a sustained success in malaria control is strongly dependent on a continued effectiveness of the first-line treatment.
Materials and Methods
Sample collection.
As part of an annual cross-sectional study, blood samples were collected from all residents in the two villages of Mkokola and Kwamasimba, Korogwe District in northeastern Tanzania from 2003 to 2010. Out of these samples, a total of 830 was positive for P. falciparum by blood smear microscopy. The study area has previously been described.17,18 Finger-prick blood samples were collected on Whatman filter paper number 3 from individuals aged 0–20 years. Collection was performed annually except in 2004, when collection was done two times; in this case, the samples were pooled after statistical analysis showed no difference in distribution between collections (data not shown). In 2005, collection was done, but samples were unavailable. Because of the dramatic reduction in malaria parasite prevalence, available sample sizes for 2008, 2009, and 2010 were greatly reduced, and samples from the two villages were pooled for all years. Analysis of variation between the villages was, however, performed, and differences are explained in Results. Samples were collected in May of 2003 (N = 176), March of 2004 (N = 176), September of 2004 (N = 164), May of 2006 (N = 88), May of 2007 (N = 136), May of 2008 (N = 55), May of 2009 (N = 17), and May of 2010 (N = 18). For the analysis of SNPs in Pfmdr-1, P. falciparum laboratory parasite isolates 3D7, FCR3, Dd2, and 7G8 were used as positive controls, whereas negative controls were from Danish donors never exposed to malaria.
DNA extraction.
The extraction of DNA was performed by Chelex-100 method.19,20 Laboratory isolate DNA was extracted using the NucleoSpin Blood QuickPure Kit (Macherey-Naegl GmbH & Co, Düren, Germany).
Polymerase chain reaction procedures.
Outer and nested polymerase chain reaction (PCR) were performed for codons 86, 184, and 1246 of Pfmdr-1 on all microscopically positive samples and controls based on previous protocols (Table 1).7,21 PCR master mix contained 1 μM of each set of primers and 1:1 Hot-Start TEMPase polymerase (including buffer and dNTP; Ampliqon III; VWR-Bie, Berntsen, Denmark) to a final volume of 19 μL/sample. To 19 μL master mix, a 1-μL sample of DNA solution was added. After the initial outer PCR, nested PCR in equivalent volumes as above was carried out using the following programs: codons 86 and 184 outer: 94°C for 15 minutes followed by 30 cycles at 94°C for 30 seconds, 55°C for 60 seconds, and 72°C for 90 seconds and a final cycle at 72°C for 5 minutes; nested PCR: 94°C for 15 minutes followed by 30 cycles at 94°C for 30 seconds, 60°C for 60 seconds, 72°C for 90 seconds, and finally, 1 cycle at 72°C for 5 minutes; codon 1246 PCR cycling conditions, Pfmdr-1 outer PCR: 94°C for 15 minutes for 34 cycles followed by 94°C for 30 seconds, 55°C for 1 minute, 72°C for 1.5 minutes, and 1 cycle at 72°C for 5 minutes; fragment 2 nested: 94°C for 15 minutes, 30 cycles at 94°C for 30 seconds, 60°C for 30 seconds, 72°C for 1 minute, and 1 cycle at 72°C for 5 minutes. PCR was run on a VWR Thermal Duo-Cycler. (VWR-Bie, Berntsen, Denmark).
Table 1.
PCR-RFLP
| Codon | Primer | Primer sequence | Size (bp) | Codon genotype and enzyme for digestion of nested PCR | |||||
|---|---|---|---|---|---|---|---|---|---|
| 86N Apo-I | 86Y Afl-III | 184Y Dra-I | 184F Dra-I | 1246 BGl-II | 1246Y EcoRV | ||||
| Outer | |||||||||
| c86 and c184 | FN 1/17 and REV/C17 | FW: 5′-AGGTTGAAAAAGAGTTGAAC-3′ and RV: 5′-ATGACACCACAAACATAAAT-3′ | 578 | ||||||
| c1246 | MDRFR2F17 and MDRFR2R17 | FW: 5′-GTGTATTTGCTGTAAGAGCT-3′ and RV: 5′-GACATATTAAATAACATGGGTTC-3′ | 958 | ||||||
| Nested | |||||||||
| c86 | MDR2/17 and NEWREV17 | FW: 5′-ACAAAAAGAGTACCGCTGAAT-3′ and RV: 5′-AAACGCAAGTAATACATAAAGTC-3′ | 534 | 250, 185, 99 | 353, 181 | ||||
| 184 | A221 | FW: 5′-CGTTTAAATGTTTACCTGCACAACATA-3′ and RV: 5′GTCAAACGTGCATTTTTTATTAATGACCATTTA-3′ | 451 | 242, 204, 5 | 242, 32, 5, 172 | ||||
| 1246 | RFLPn2f7 and MDRFR2R27 | FW: 5′-GAATTTTCAAACCAATCTGGA-3′ and RV: 5′-TAAATAACATGGGTTCTTGACT-3′ | 151 | 49, 102 | 48, 103 | ||||
The first column shows the outer or nested PCR fragment sizes in base pairs indicated. The second column shows the list of previously used primer names with references. The third column shows primer sequences. FW = forward; RV = reverse. The fourth column shows PCR fragment sizes in base pairs. The last six columns show genotypes and enzymes for digestion and fragment sizes of nested products when digested.
SNP determination at codons 86, 184, and 1246 by restriction fragment length polymorphism.
SNP detection by PCR-restriction fragment length polymorphism (RFLP) was performed by digestion of nested PCR products in volumes of 22 μL; 17 μL restriction enzyme mixture were used with 5 μL DNA from nested PCR added, and the mixture was incubated overnight at the respective enzymes optimum temperatures according to the manufacturer's instructions (New England Biolabs, Ipswich, MA) (Table 1). The Afl-III enzyme recognizes and digests both 86Y and 86F, thereby not differentiating, but because the 86F genotype has only been found in one report from Swaziland,22 all digestions with Afl-III were considered to be 86Y isolates. Digests were analyzed by gel electrophoresis on 1.5–2.5% agarose. Of a total of 830 samples confirmed by microscopy to be P. falciparum-positive, 695 (83%), 676 (81%), and 610 (74%) samples were successfully amplified and genotyped at codons 86, 184, and 1246, respectively. PCR-negative samples were run two times, and samples that had been positive at only one codon but not other codons were run a third time.
Ethical considerations.
Ethical clearance for the study was granted by the Medical Research Coordinating Committee of the National Institute for Medical Research and Ministry of Health, Tanzania. Informed consent was obtained from all participants, or their parents or legal guardians in case of infants, children, and adolescents.
Statistics.
SNP prevalence and frequencies were examined for temporal changes by logistic regression using STATA 10 statistical software (StataCorp LP, College Station, TX). Prevalence analysis included mixed infections to evaluate total percentage of infections carrying the various genotypes, whereas frequency analysis excluded mixed infections, because mixed infections cannot be differentiated into major/minor alleles using PCR-RFLP; this analysis was performed to look for dominance of genotype in infections. P values ≤ 0.05 were considered to be significant. To analyze the data for changes after introduction of AL in late 2006, logistic regression was performed from 2006 to 2010. Results of logistic regression are provided as odds ratios (ORs; 95% confidence interval [CI], P values). Furthermore, we analyzed the data pre-AL introduction by logistic regression on data before 2007. A χ2 test was used for comparison of genotype frequencies between two individual years and between the two villages in the same year.
Results
Prevalence of SNPs at codons 86, 184, and 1246 of the Pfmdr1 gene.
The temporal prevalence distribution of SNPs at codons 86, 184, and 1246, including mixed codon infections, is shown in Figure 1. To analyze temporal changes in codon 86 SNP distribution, samples containing N86 wild types, including mixed N86/86Y infections, were set against single mutant-type 86Y infections. The N86-carrying infections remained at a low and stable prevalence from 2003 to 2006 (20–25%), whereas from 2006 to 2010, N86-carrying infections rose to 59% (OR = 1.35 [1.07–1.71], P = 0.01) (Figure 1A). The prevalence analysis of SNPs at codon 184 compared the mutant 184F, including mixed (184F/Y184), with single Y184 wild types. Although no difference was found between 2003 and 2006 (OR = 1.05 [0.79–1.40], P = 0.73), a significant increase in 184F-carrying infections from 2006 to 2010 was found (OR = 1.42 [1.07–1.88], P = 0.02) (Figure 1B). No statistical difference could be shown in the prevalence of codon 1246 SNPs during the period of 2006–2010 (OR = 1.01 [0.08–1.27], P = 0.9) and the period of 2003–2006 (OR = 0.93 [0.77–1.11], P = 0.42) (Figure 1C). Finally, there was inter-village variation, with a higher prevalence of SNP 184F in Mkokola in 2003 compared with Kwamasimba (χ2 P = 0.03) because of larger quantities of mixed infections and a higher prevalence of D1246 in Mkokola in 2004 (χ2 P = 0.002) because of a larger fraction of mixed genotype infections. No difference was observed in the other years.
Figure 1.
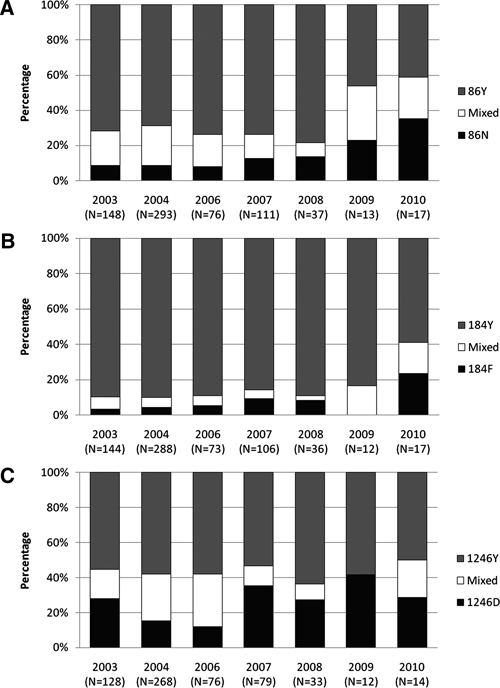
Prevalence of molecular markers at codons 86, 184, and 1246 of Pfmdr-1. Temporal prevalence of SNP at codons 86 (A), 184 (B), and 1246 (C) given as fractions of sample sizes.
Frequency of SNPs at codons 86, 184, and 1,246 of the Pfmdr1 gene.
To examine for temporal changes in frequency of SNPs at codons 86, 184, and 1246 in the Pfmdr1 gene, mixed genotype infections were omitted from the analysis. The N86 wild type remained at a low level in the period of 2003–2006 (5–10%) (OR = 0.98 [0.72–1.34], P = 0.93), but from 2006 to 2010, it increased to 46% (OR = 1.62 [1.62–2.20], P = 0.002). Likewise, regarding the frequency of 184F mutant type, it remained at a low level (0–10%) from 2003 to 2006 (OR = 1.12 [0.74–1.70], P = 0.58) but showed a tendency to increase from 2006 to 2010 (OR = 1.38 [0.96–1.98], P = 0.08). Finally, the D1246 wild type decreased in frequency in the years 2003–2006 from 34% to 17% (OR = 0.71 [0.55–0.93], P = 0.01) but increased from 2007 to a level ranging from 30% to 42%. This trend was not statistically significant by logistic regression (OR = 1.25 [0.95–1.65], P = 0.10); however, the increase from 2006 to 2007 in frequency was significant (χ2 P = 0.01).
Haplotype distribution.
Haplotypes were compared on a two-codon basis rather than on a three-codon basis because of limited sample sizes; mixed genotype infections were excluded as well. The haplotypes codons c86–c184 and c86–c1246 were analyzed for frequency changes and are shown (Figure 2). From 2006 to 2010, the N86-184F combination showed tendencies to increase from 8% to 33% (OR = 1.49 [0.99–2.24], P = 0.05) on the expense of the 86Y-Y184 combination, whereas no changes were found from 2003 to 2006 (OR = 1.21 [0.78–1.87], P = 0.40) (Figure 2A). Comparison of the c86–c1246 combination showed a significant increase of the N86-D1246 haplotype from 2006 to 2010 (OR = 1.82 [1.22–2.73], P = 0.004), with no changes in the period from 2003 to 2006 (OR = 0.72 [0.41–1.26], P = 0.25) (Figure 2B).
Figure 2.
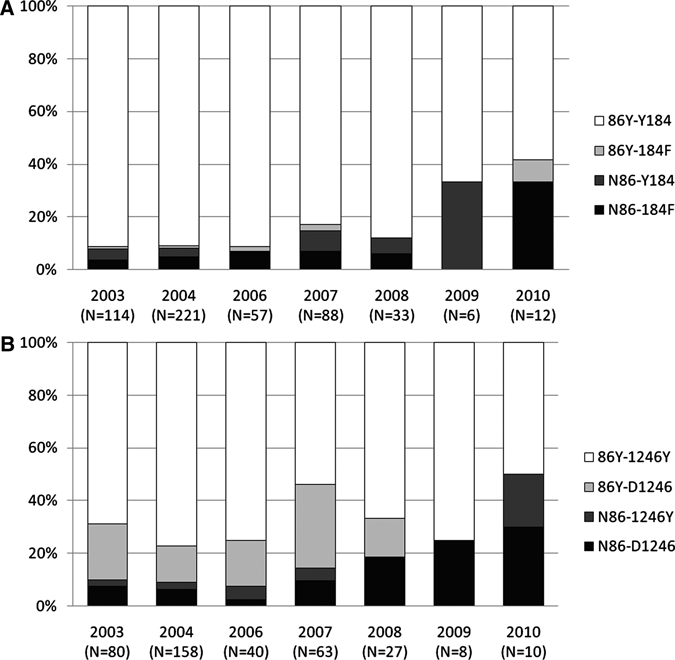
Two-codon haplotype distribution from 2003 to 2010. Haplotypes as fractions of total sample size per year. (A) c86–184 combination and (B) c86–1246 combination.
Discussion
Continued surveillance of molecular markers of drug resistance and particularly, potential markers of ACT drug tolerance/resistance are important tools for the continued success in control of malaria, especially if prompt treatment with efficacious drugs is to be maintained. Historical evidence has repeatedly shown that the emergence of drug resistance in P. falciparum has originated in Southeast Asia and then, spread to Africa.16 Because signs of ACT drug resistance have been observed on the Thai–Cambodian border,23 it is crucial to monitor the potential emergence of ACT resistance in areas known to be hotspots for the spread of antimalarial drug resistance in Africa, such as East Africa.3,15,24 SNPs at codons 86, 184, and 1246 of the Pfmdr-1 gene has been suggested to be markers of changes in parasite susceptibility to various drugs, including ACTs.7–10 Initially, SNPs in Pfmdr-1 were associated with CQ and AQ resistance.25 However, recent studies have suggested a relationship between SNPs in Pfmdr-1 and ACT drugs. Studies in Tanzania have shown that Pfmdr-1 N86 or 184F was selected in reinfections after AL treatment10; furthermore, AL selected Pfcrt K76 and to a lesser extent, the Pfmdr-1 N86 in recurrent infections.26 In another study performed in Muheza district of Tanzania in 2006, it was reported that 86Y, 184Y, and 1246Y occur more frequently after AQ monotherapy, whereas pre-treatment carriage of N86 or 184F was associated with an increased risk of AL treatment failure.7 A study from Thailand showed haplotype prevalence of the N86-184F haplotype at 40% in 1988–1993, which increased to 95% in 2003.27 Because Thailand changed from mefloquine (MQ) monotherapy to artesunate-MQ in the late 1990s, this finding suggests that the selection of N86-184F was likely caused by artesunate.27
In Tanzania, CQ was replaced by SP in 2001, with AQ used as the second-line drug, and SP was followed by AL in 2006 because of high levels of SP resistance in the country. The present study found a high prevalence of mutant type 86Y and wild-type Y184 from 2003 to 2006 at 80–90%. This finding is in concordance with two studies performed in Tanzania in Muheza in 2006, where the prevalence was 85% and 90%, respectively,7 and another Tanzanian study performed in Masasi District in 2002 with frequencies of 86Y at 77%28; overall, these results suggest that the prevalence of 86Y and Y184 was high, when SP and AQ were used on a large-scale basis.
In the present study, after the introduction of AL in Tanzania in late 2006, the prevalence of SNPs N86 and 184F increased over time. This finding may be related to implementation of AL, whereby parasites expressing N86 and 184F are intrinsically more tolerant to ACT drugs and have a survival advantage during AL drug pressure, which was suggested by others.7,22 Similarly, this study also showed that the frequency of the N86-184F haplotype showed tendencies to increase, and N86-D1246 haplotypes increased in the years after AL introduction, largely supporting previous studies from Tanzania.7,10,22 However, one study found recrudescent infections after artemisinin-AQ (ACT) treatment selected for 86Y, Y184, and 1246Y combinations,8 indicating differences in selection by various ACT combination therapies.
The prevalence of mixed genotype infections decreased from 2003 to 2008, but in 2009 and 2010, there was raised prevalence of mixed infections at c86 and c184, although the general prevalence of malaria infections remained low. The reason for this prevalence change is unknown, but we suspect that this is probably because of the small sample size skewing the data.
The study presented here was performed in an area where malaria burden has been reduced dramatically in the last decade,17 and therefore, our sample sizes in the latter years were very small; conclusions should be interpreted cautiously. However, our results are in line with data found recently in Gabon,14 where the N86 showed raised prevalence after introduction of AL. Furthermore, we show a temporal increase of 184F mutant type after introduction of AL, and therefore, there is cause for concern and continued surveillance of prevalence of SNPs in Pfmdr-1, which remains highly relevant as a marker of reduced susceptibility to AL.
ACKNOWLEDGMENTS
The study participants, including their parents or guardians, village leaders, and District Health authorities in Korogwe, are kindly acknowledged. Furthermore, we wish to acknowledge the survey teams in Tanga and Korogwe and Ulla Abildtrup at Centre for Medical Parasitology (CMP) for excellent technical assistance. Finally, we thank Helle Holm Hansson, Mette Leth Schousboe, and Christian Wang for commenting on the manuscript. Permission to publish this paper was obtained from the Director General of the National Institute for Medical Research (Tanzania).
Footnotes
Financial support: The field study was supported by the Tanzania–Denmark Enhancement of Research Capacity (ENRECA) program (104.Dan.8.L.312) and Project 91106 by the Danish International Development Agency (DANIDA).
Authors' addresses: Thomas T. Thomsen, Lasse S. Vestergaard, Thor G. Theander, Ib C. Bygbjerg, and Michael Alifrangis, Centre for Medical Parasitology, Department of International Health, Immunology and Microbiology, University of Copenhagen, Copenhagen, Denmark, E-mails: thyge666@gmail.com, lvestergaard@sund.ku.dk, thor@sund.ku.dk. iby@sund.ku.dk and micali@sund.ku.dk. Deus S. Ishengoma, Bruno P. Mmbando, John P. Lusingu, and Martha M. Lemnge, National Institute for Medical Research, Tanga Medical Research Centre, Tanga, Tanzania, E-mails: dishengoma@tanga.mimcom.net, Pbruno@amani.mimcom.net, jpalusingu@yahoo.co.uk, and mlemnge@tanga.mimcom.net.
References
- 1.World Health Organization World Malaria Report 2009. 2009. http://www.who.int/malaria/world_malaria_report_2009/en/index.html Available at. Accessed May 10, 2010.
- 2.Wernsdorfer WH. Epidemiology of drug resistance in malaria. Acta Trop. 1994;56:143–156. doi: 10.1016/0001-706x(94)90060-4. [DOI] [PubMed] [Google Scholar]
- 3.Wongsrichanalai C, Pickard AL, Wernsdorfer WH, Meshnick SR. Epidemiology of drug-resistant malaria. Lancet Infect Dis. 2002;2:209–218. doi: 10.1016/s1473-3099(02)00239-6. [DOI] [PubMed] [Google Scholar]
- 4.Plowe CV, Roper C, Barnwell JW, Happi CT, Joshi HH, Mbacham W, Meshnick SR, Mugittu K, Naidoo I, Price RN, Shafer RW, Sibley CH, Sutherland CJ, Zimmerman PA, Rosenthal PJ. World Antimalarial Resistance Network (WARN) III: molecular markers for drug resistant malaria. Malar J. 2007;6:121. doi: 10.1186/1475-2875-6-121. [DOI] [PMC free article] [PubMed] [Google Scholar]
- 5.Khalil IF, Alifrangis M, Tarimo DS, Staalso T, Satti GM, Theander TG, Ronn AM, Bygbjerg IC. The roles of the pfcrt 76T and pfmdr1 86Y mutations, immunity and the initial level of parasitaemia, in predicting the outcome of chloroquine treatment in two areas with different transmission intensities. Ann Trop Med Parasitol. 2005;99:441–448. doi: 10.1179/136485905X46441. [DOI] [PubMed] [Google Scholar]
- 6.Duraisingh MT, Cowman AF. Contribution of the pfmdr1 gene to antimalarial drug-resistance. Acta Trop. 2005;94:181–190. doi: 10.1016/j.actatropica.2005.04.008. [DOI] [PubMed] [Google Scholar]
- 7.Humphreys GS, Merinopoulos I, Ahmed J, Whitty CJ, Mutabingwa TK, Sutherland CJ, Hallett RL. Amodiaquine and artemether-lumefantrine select distinct alleles of the Plasmodium falciparum mdr1 gene in Tanzanian children treated for uncomplicated malaria. Antimicrob Agents Chemother. 2007;51:991–997. doi: 10.1128/AAC.00875-06. [DOI] [PMC free article] [PubMed] [Google Scholar]
- 8.Holmgren G, Hamrin J, Svard J, Martensson A, Gil JP, Bjorkman A. Selection of pfmdr1 mutations after amodiaquine monotherapy and amodiaquine plus artemisinin combination therapy in East Africa. Infect Genet Evol. 2007;7:562–569. doi: 10.1016/j.meegid.2007.03.005. [DOI] [PubMed] [Google Scholar]
- 9.Sisowath C, Stromberg J, Martensson A, Msellem M, Obondo C, Bjorkman A, Gil JP. In vivo selection of Plasmodium falciparum pfmdr1 86N coding alleles by artemether-lumefantrine (Coartem) J Infect Dis. 2005;191:1014–1017. doi: 10.1086/427997. [DOI] [PubMed] [Google Scholar]
- 10.Sisowath C, Ferreira PE, Bustamante LY, Dahlstrom S, Martensson A, Bjorkman A, Krishna S, Gil JP. The role of pfmdr1 in Plasmodium falciparum tolerance to artemether-lumefantrine in Africa. Trop Med Int Health. 2007;12:736–742. doi: 10.1111/j.1365-3156.2007.01843.x. [DOI] [PubMed] [Google Scholar]
- 11.Nkhoma S, Nair S, Mukaka M, Molyneux ME, Ward SA, Anderson TJ. Parasites bearing a single copy of the multi-drug resistance gene (pfmdr-1) with wild-type SNPs predominate amongst Plasmodium falciparum isolates from Malawi. Acta Trop. 2009;111:78–81. doi: 10.1016/j.actatropica.2009.01.011. [DOI] [PMC free article] [PubMed] [Google Scholar]
- 12.Lim P, Alker AP, Khim N, Shah NK, Incardona S, Doung S, Yi P, Bouth DM, Bouchier C, Puijalon OM, Meshnick SR, Wongsrichanalai C, Fandeur T, Le BJ, Ringwald P, Ariey F. Pfmdr1 copy number and arteminisin derivatives combination therapy failure in falciparum malaria in Cambodia. Malar J. 2009;8:11. doi: 10.1186/1475-2875-8-11. [DOI] [PMC free article] [PubMed] [Google Scholar]
- 13.Alker AP, Lim P, Sem R, Shah NK, Yi P, Bouth DM, Tsuyuoka R, Maguire JD, Fandeur T, Ariey F, Wongsrichanalai C, Meshnick SR. Pfmdr1 and in vivo resistance to artesunate-mefloquine in falciparum malaria on the Cambodian-Thai border. Am J Trop Med Hyg. 2007;76:641–647. [PubMed] [Google Scholar]
- 14.Lekana-Douki JB, Dinzouna Boutamba SD, Zatra R, Zang Edou SE, Ekomy H, Bisvigou U, Toure-Ndouo FS. Increased prevalence of the Plasmodium falciparum Pfmdr1 86N genotype among field isolates from Franceville, Gabon after replacement of chloroquine by artemether-lumefantrine and artesunate-mefloquine. Infect Genet Evol. 2011;11:512–517. doi: 10.1016/j.meegid.2011.01.003. [DOI] [PubMed] [Google Scholar]
- 15.Clarke VD. Chloroquine-resistant malaria acquired in Kenya and Tanzania–Denmark, Georgia, New York. Cent Afr J Med. 1979;25:39–40. [PubMed] [Google Scholar]
- 16.Naidoo I, Roper C. Following the path of most resistance: dhps K540E dispersal in African Plasmodium falciparum. Trends Parasitol. 2010;26:447–456. doi: 10.1016/j.pt.2010.05.001. [DOI] [PubMed] [Google Scholar]
- 17.Mmbando BP, Vestergaard LS, Kitua AY, Lemnge MM, Theander TG, Lusingu JP. A progressive declining in the burden of malaria in north-eastern Tanzania. Malar J. 2010;9:216. doi: 10.1186/1475-2875-9-216. [DOI] [PMC free article] [PubMed] [Google Scholar]
- 18.Lusingu JP, Jensen AT, Vestergaard LS, Minja DT, Dalgaard MB, Gesase S, Mmbando BP, Kitua AY, Lemnge MM, Cavanagh D, Hviid L, Theander TG. Levels of plasma immunoglobulin G with specificity against the cysteine-rich interdomain regions of a semiconserved Plasmodium falciparum erythrocyte membrane protein 1, VAR4, predict protection against malarial anemia and febrile episodes. Infect Immun. 2006;74:2867–2875. doi: 10.1128/IAI.74.5.2867-2875.2006. [DOI] [PMC free article] [PubMed] [Google Scholar]
- 19.Pearce RJ, Drakeley C, Chandramohan D, Mosha F, Roper C. Molecular determination of point mutation haplotypes in the dihydrofolate reductase and dihydropteroate synthase of Plasmodium falciparum in three districts of northern Tanzania. Antimicrob Agents Chemother. 2003;47:1347–1354. doi: 10.1128/AAC.47.4.1347-1354.2003. [DOI] [PMC free article] [PubMed] [Google Scholar]
- 20.Wooden J, Kyes S, Sibley CH. PCR and strain identification in Plasmodium falciparum. Parasitol Today. 1993;9:303–305. doi: 10.1016/0169-4758(93)90131-x. [DOI] [PubMed] [Google Scholar]
- 21.Duraisingh MT, Roper C, Walliker D, Warhurst DC. Increased sensitivity to the antimalarials mefloquine and artemisinin is conferred by mutations in the pfmdr1 gene of Plasmodium falciparum. Mol Microbiol. 2000;36:955–961. doi: 10.1046/j.1365-2958.2000.01914.x. [DOI] [PubMed] [Google Scholar]
- 22.Dlamini SV, Beshir K, Sutherland CJ. Markers of anti-malarial drug resistance in Plasmodium falciparum isolates from Swaziland: identification of pfmdr1-86F in natural parasite isolates. Malar J. 2010;9:68. doi: 10.1186/1475-2875-9-68. [DOI] [PMC free article] [PubMed] [Google Scholar]
- 23.Dondorp AM, Nosten F, Yi P, Das D, Phyo AP, Tarning J, Lwin KM, Ariey F, Hanpithakpong W, Lee SJ, Ringwald P, Silamut K, Imwong M, Chotivanich K, Lim P, Herdman T, An SS, Yeung S, Singhasivanon P, Day NP, Lindegardh N, Socheat D, White NJ. Artemisinin resistance in Plasmodium falciparum malaria. N Engl J Med. 2009;361:455–467. doi: 10.1056/NEJMoa0808859. [DOI] [PMC free article] [PubMed] [Google Scholar]
- 24.Payne D. Spread of chloroquine resistance in Plasmodium falciparum. Parasitol Today. 1987;3:241–246. doi: 10.1016/0169-4758(87)90147-5. [DOI] [PubMed] [Google Scholar]
- 25.Duraisingh MT, Drakeley CJ, Muller O, Bailey R, Snounou G, Targett GA, Greenwood BM, Warhurst DC. Evidence for selection for the tyrosine-86 allele of the pfmdr1 gene of Plasmodium falciparum by chloroquine and amodiaquine. Parasitology. 1997;114:205–211. doi: 10.1017/s0031182096008487. [DOI] [PubMed] [Google Scholar]
- 26.Sisowath C, Petersen I, Veiga MI, Martensson A, Premji Z, Bjorkman A, Fidock DA, Gil JP. In vivo selection of Plasmodium falciparum parasites carrying the chloroquine-susceptible pfcrt K76 allele after treatment with artemether-lumefantrine in Africa. J Infect Dis. 2009;199:750–757. doi: 10.1086/596738. [DOI] [PMC free article] [PubMed] [Google Scholar]
- 27.Mungthin M, Suwandittakul N, Chaijaroenkul W, Rungsrihirunrat K, Harnyuttanakorn P, Seugorn A, Na BK. The patterns of mutation and amplification of Plasmodium falciparum pfcrt and pfmdr1 genes in Thailand during the year 1988 to 2003. Parasitol Res. 2010;107:539–545. doi: 10.1007/s00436-010-1887-x. [DOI] [PubMed] [Google Scholar]
- 28.Schneider AG, Premji Z, Felger I, Smith T, Abdulla S, Beck HP, Mshinda H. A point mutation in codon 76 of pfcrt of P. falciparum is positively selected for by Chloroquine treatment in Tanzania. Infect Genet Evol. 2002;1:183–189. doi: 10.1016/s1567-1348(01)00021-1. [DOI] [PubMed] [Google Scholar]