

Abstract
O-GlcNAc transferase (OGT) catalyzes the addition of N-acetylglucosamine (O-GlcNAc) onto a diverse array of intracellular proteins. Although hundreds of proteins are known to be modified by O-GlcNAc, a strict amino acid consensus sequence for OGT has not been identified. In this study, we describe the development of a high-throughput assay for OGT and use it to profile the specificity of the enzyme among a panel of peptide substrates.
The glycosylation of intracellular proteins with the monosaccharide β-N-acetylglucosamine (O-GlcNAc) is a posttranslational modification implicated in many vital cellular processes.1–4 To date, hundreds of nuclear and cytosolic proteins modified by O-GlcNAc have been identified. These proteins vary widely in structure and function and include RNA polymerase II,5 cell cycle regulators,6 heat shock proteins,7 nuclear pore complex proteins,8 transcription factors9 and cytoskeletal components.10,11 Furthermore, genetic studies have shown that the O-GlcNAc modification is required for survival of both embryonic stem cells and differentiated tissues, underscoring its critical biological significance.12,13 However, the regulation of the O-GlcNAc modification remains poorly understood.
The O-GlcNAc modification is initiated by a single enzyme, O-GlcNAc transferase (OGT), which transfers a GlcNAc residue from UDP-GlcNAc to select serine or threonine residues of target proteins. No consensus sequence has been identified that defines the specificity of OGT for its protein substrates, and thus the mechanism of substrate selection by OGT remains a mystery. Given the physiological significance of the O-GlcNAc modification, there is a pressing need for an assay that allows for interrogation of OGT's peptide specificity.
Screening of peptide libraries comprising combinatorial arrays of putative peptide targets has been an effective means for elucidating the sequence preferences of kinases and proteases.14 To perform such a study with OGT would require an assay that monitors O-GlcNAc transfer onto various peptide substrates in a high-throughput manner. Traditional assays for OGT activity utilize radiolabeled substrates, require product isolation and are not easily amenable for rapid screening.15,16 Although a high-throughput method that detects OGT binding to UDP-GlcNAc has been reported and used for small molecule screens, its adaptation to peptide specificity profiling is not straightforward.17
We recently reported an assay for polypeptidyl galactosaminyltransferases (ppGalNAcTs) that capitalizes on their tolerance for an azido substituent on the acetyl group of UDP-GalNAc.18,19 The azide provides a means to detect the glycopeptide products by Staudinger ligation with phosphine probes. We termed this assay architecture the azido-ELISA.
Similar to the substrate tolerance of the ppGalNAcTs, OGT will recognize an N-azidoacetyl analog of UDPGlcNAc (UDP-GlcNAz) in both biochemical assays and in cultured cells.20 In cells, the azide-modified substrate appears to be transferred to the same spectrum of proteins as the natural sugar.21,22 Here, we capitalize on this finding in the development of a high-throughput azido-ELISA for OGT and we employ the assay in a preliminary peptide substrate screen.
A schematic of the azido-ELISA is shown in Figure 1. Biotinylated peptide substrates are captured onto NeutrAvidin-coated 96-well plates and are subsequently covalently tagged by treatment with phosphine-FLAG.23 The FLAG-labeled epitopes are then treated with a horseradish peroxidase (HRP)-conjugated α-FLAG antibody that allows for colorimetric readout of HRP activity.
Figure 1.

High-throughput azido-ELISA for OGT activity.
We used a peptide from human α-A crystalline (NH2-AIPVSREEK(biotin)-COOH), a bona fide physiological OGT substrate,24 as the basis for the substrate library. We confirmed the activity the peptide by treatment with UDP-GlcNAz and purified OGT25 and analysis of the product by mass spectrometry (data not shown). For the azido-ELISA, enzymatic reactions were carried out under saturating conditions and were initiated with the addition of purified OGT (0.4 nM, 4 μL) to a solution containing the α-A crystallin peptide (125 μM), UDP-GlcNAz (62.5 μM), MgCl2 (12.5 μM), and β-mercaptoethanol (1 mM) in a total volume of 40 μL. Reactions were incubated at 37 °C for 4 h and were terminated with the addition of sodium acetate (0.4 M, 40 μL, pH 4.5). The reaction solutions were then transferred to a NeutrAvidin-coated 96-well plate (Pierce), and incubated at 25 °C for 1 h. The NeutrAvidin plate was then subsequently washed (3 × 100 μL) with phosphate buffered saline (PBS), and treated with a solution of phosphine-FLAG (0.2 mM, 200 μL in PBS) for 2 h at 37 °C. Each well was then washed (3 × 100 uL) with a BSA blocking buffer (PBS containing 0.1% BSA and 0.05 % tween, pH 7.2) followed by the addition of a solution of α-FLAG HRP (1 μg/5mL, 100 μL, in blocking buffer) and the plate was incubated for 1 h at 25 °C. After 3 washes with PBS (100 μL), the α-FLAG-HRP activity was then quantified by the addition of a Tetramethyl Benzidine (TMB) peroxide solution (100 μL, TMB Substrate Kit reagent from Pierce) for 5 min at 25 °C. Peroxidase activity was terminated upon treatment with H2SO4 (2N, 50 μL) and absorbance at 450 nm was monitored on a Molecular Devices SpectraMAX 190 microplate reader. The assay allowed for the calculation of kinetic parameters for UDP-GlcNAz (Km= 22 ± 4 μM, Vmax= 3.6 ± 0.3 μM/min) and the α-A crystallin peptide (Km = 8.7 ± 3.8 μM, Vmax= 3.9 ± 1.1 μM/min). These calculated kinetic parameters are consistent with previous reports.21,26,27
We then employed the assay to evaluate a series of peptides based on the α-A crystallin sequence that contained single amino acid substitutions at the −4 to +3 positions surrounding the modified serine residue (Table 1). As with the parent peptide, the carboxyl terminal lysine residue of each peptide was biotinylated to allow for capture. As shown in Table 1, five amino acids were substituted at each position of the parent peptide. The residues were chosen to assess the effects of variance in hydrophobicity, charge, and local structure on enzyme activity. The 28 peptides were synthesized using standard solid-phase methods.28
Table 1.
Library of α-A crystalline-derived peptides. Amino acid substitutions in the sequence of the parent peptide are shown in bold. Activities of the modified peptides are shown relative to the parent α-A-crystallin peptide.
| Peptide designation | Peptide sequencea | Relative activityb |
|---|---|---|
| α-A crystallin | AIPVSREEK | 1.0 ± 0.1 |
| −4I | IIPVSREEK | 1.6 ± 0.2 |
| −4E | EIPVSREEK | 1.0 ± 0.2 |
| −4R | RIPVSREEK | 2.0 ± 0.2 |
| −4P | PIPVSREEK | 1.8 ± 0.04 |
| −3A | AAPVSREEK | 0.4 ± 0.1 |
| −3E | AEPVSREEK | 0.5 ± 0.1 |
| −3R | ARPVSREEK | 0.0 ± 0.01 |
| −3P | APPVSREEK | 0.1 ± 0.01 |
| −2A | AIAVSREEK | 0.1 ± 0.01 |
| −2E | AIEVSREEK | 0.0 ± 0.01 |
| −2R | AIRVSREEK | 0.2 ± 0.04 |
| −1I | AIPISREEK | 0.3 ± 0.1 |
| −1A | AIPASREEK | 0.1± 0.1 |
| −1E | AIPESREEK | 0.2 ± 0.02 |
| −1R | AIPRSREEK | 0.0 ± 0.02 |
| −1P | AIPPSREEK | 0.1 ± 0.01 |
| +1I | AIPVSIEEK | 0.1 ± 0.1 |
| +1A | AIPVSAEEK | 0.0 ± 0.07 |
| +1E | AIPVSEEEK | 0.0 ± 0.05 |
| +1P | AIPVSPEEK | 0.0 ± 0.04 |
| +2A | AIPVSRAEK | 5.0 ± 0.06 |
| +2R | AIPVSRREK | 0.6 ± 0.02 |
| +2P | AIPVSRPEK | 4.7 ± 0.7 |
| +3I | AIPVSREIK | 0.1 ± 0.05 |
| +3A | AIPVSREAK | 0.6 ± 0.03 |
| +3R | AIPVSRERK | 0.2 ± 0.01 |
| +3P | AIPVSREPK | 0.3 ± 0.1 |
Lysine residue of each peptide is biotinylated.
Values shown are representative data from 3 separate experiments. Each independent experiment was performed in triplicate.
The results of the peptide screen are presented in Table 1. Transferase reactions were performed under saturating conditions and were terminated after 4 h by the addition of sodium acetate (as described above). Product turnover of each library member was normalized to the measured activity of the parent α-A crystalline peptide. A peptide containing an Ala in place of the Ser residue in the α-A crystalline peptide was used as a negative control that allowed for background subtraction. As shown in Table 1, the assay detected statistically significant activity differences among closely related peptide substrates. For example, substitution of residues at the −1, +1 and +2 positions (which are near the site of modification) consistently perturbed O-GlcNAc transfer, while OGT was more tolerant of substitution at the other positions. All modifications of the −4 Ala residue exhibited an approximate 2-fold increase in activity and substitution of the −3 and +3 positions produced slight reductions in activity, as did substitution of the Glu residue at the +2 position with a positively charged Arg residue. Strikingly, however, when the +2 Glu residue was replaced with either an Ala (+2A) or Pro (+2P), 5-fold activity enhancements were observed.
Kinetic analysis of the +2A and +2P peptides using the azido-ELISA (Table 2) supported this trend, as the calculated Km and Vmax values showed greater substrate affinity and turnover than with the parent α-A crystalline peptide. These preliminary results validate the assay as a robust means of detecting primary sequence preferences of OGT toward a library of peptide substrates. However, it should be pointed out that notable deviation in calculated Km values has been observed (Table 2), and although the assay is distinctive in its ability for rapid high-throughput screening, it should be used in conjunction with traditional assays for detailed kinetic analysis.
Table 2.
Kinetic analysis of representative peptides.
| Peptide designation | Km, μMa | Vmax, μM/mina | Rel. ELISA activity |
|---|---|---|---|
| α-A crystallin | 8.7 (±3.8) | 3.9 (±1.1) | 1 (±0.1) |
| +2A | 0.5 (±0.03) | 8.5 (±0.7) | 5.0 (±0.06) |
| +2P | 0.8 (±0.04) | 13.5 (±0.9) | 4.7 (±0.7) |
Values shown are the mean of three experiments; standard deviation is given in parenthesis.
Finally, we examined a representative sample of the peptides from our series using circular dichroism (CD) spectroscopy.29 As shown in Figure 2, peptides from the α-A crystallin series showed no defined secondary structure, suggesting that the differences in OGT activity listed in Table 1 solely reflect the enzyme's primary sequence preference.
Figure 2.
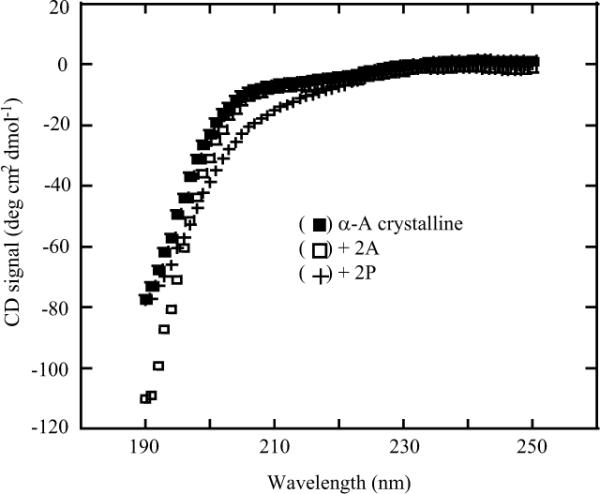
CD spectra of representative peptides.
In summary, we have developed the first high-throughput assay that can measure the activity of OGT toward small peptide substrates, setting the stage for high-throughput screening of larger peptide libraries or small molecule inhibitors. The assay can also be used to screen glycopeptide and phosphopeptide libraries, which may be important for understanding OGT site selection on multiply glycosylated and phosphorylated substrates such as RNA polymerase II.30
Acknowledgement
The authors thank Michael Boyce, Penelope Drake, Jennifer Czlapinski and Brian Carlson for comments on the manuscript. Howard Hang and Matthew Pratt provided biotinylated compounds for standard curve calculations. The plasmid used for OGT expression was a generous gift from John Hanover. This work was supported by NIH grant GM066047.
Footnotes
Publisher's Disclaimer: This is a PDF file of an unedited manuscript that has been accepted for publication. As a service to our customers we are providing this early version of the manuscript. The manuscript will undergo copyediting, typesetting, and review of the resulting proof before it is published in its final citable form. Please note that during the production process errors may be discovered which could affect the content, and all legal disclaimers that apply to the journal pertain.
References and notes
- 1.Jackson SP, Tjian R. Cell. 1988;55:125–133. doi: 10.1016/0092-8674(88)90015-3. [DOI] [PubMed] [Google Scholar]
- 2.Jackson SP, Tjian R. Proc Natl Acad Sci U S A. 1989;86:1781–1785. doi: 10.1073/pnas.86.6.1781. [DOI] [PMC free article] [PubMed] [Google Scholar]
- 3.Zhang F, Su K, Yang X, Bowe DB, Paterson AJ, Kudlow JE. Cell. 2003;115:715–725. doi: 10.1016/s0092-8674(03)00974-7. [DOI] [PubMed] [Google Scholar]
- 4.Han I, Kudlow JE. Mol Cell Biol. 1997;17:2550–2558. doi: 10.1128/mcb.17.5.2550. [DOI] [PMC free article] [PubMed] [Google Scholar]
- 5.Kelly WG, Dahmus ME, Hart GW. J. Biol. Chem. 1993;268:10416–10424. [PubMed] [Google Scholar]
- 6.Shaw P, Freeman J, Bovey R, Iggo R. Oncogene. 1996;12:921–930. [PubMed] [Google Scholar]
- 7.Roquemore EP, Chevrier MR, Cotter RJ, Hart GW. Biochem. 1996;35:3578–3586. doi: 10.1021/bi951918j. [DOI] [PubMed] [Google Scholar]
- 8.Holt GD, Snow DM, Senior A, Haltiwanger LG, Hart GW. J. Cell. Biol. 1987;104:1157–1164. doi: 10.1083/jcb.104.5.1157. [DOI] [PMC free article] [PubMed] [Google Scholar]
- 9.Chou TY, Dang CV, Hart GW. PNAS. 1995;92:4417–4421. doi: 10.1073/pnas.92.10.4417. [DOI] [PMC free article] [PubMed] [Google Scholar]
- 10.Holt G,D, Haltiwanger RS, Torres C, Hart GW. J. Biol. Chem. 1987;262:14847–14850. [PubMed] [Google Scholar]
- 11.Dong DL, Xu Z, Chevrier MR, Cotter RJ, Cleveland DW, Hart GW. J. Biol. Chem. 1993;268:16679–16687. [PubMed] [Google Scholar]
- 12.Shafi R, Iyer SP, Ellies LG, O'Donnell N, Marek KW, Chui D, Hart GW, Marth JD. Proc Natl Acad Sci U S A. 2000;97:5735–5739. doi: 10.1073/pnas.100471497. [DOI] [PMC free article] [PubMed] [Google Scholar]
- 13.O'Donnell N, Zachara NE, Hart GW, Marth JD. Mol Cell Biol. 2004;24:1680–1690. doi: 10.1128/MCB.24.4.1680-1690.2004. [DOI] [PMC free article] [PubMed] [Google Scholar]
- 14.Songyang Z. Methods Enzymol. 2001;332:171–183. doi: 10.1016/s0076-6879(01)32200-0. [DOI] [PubMed] [Google Scholar]
- 15.Kreppel LK, Hart GW. J Biol Chem. 1999;274:32015–32022. doi: 10.1074/jbc.274.45.32015. [DOI] [PubMed] [Google Scholar]
- 16.Haltiwanger RS, Blomberg MA, Hart GW. J Biol Chem. 1992;267:9005–9013. [PubMed] [Google Scholar]
- 17.Gross BJ, Kraybill BC, Walker S. J. Am. Chem. Soc. 2005;127:14588–14589. doi: 10.1021/ja0555217. [DOI] [PubMed] [Google Scholar]
- 18.Hang HC, Yu C, Pratt MR, Bertozzi CR. J. Am. Chem. Soc. 2004;126:6–7. doi: 10.1021/ja037692m. [DOI] [PubMed] [Google Scholar]
- 19.Pratt MR, Hang HC, Ten Hagen KG, Rarick J, Gerken TA, Tabak LA, Bertozzi CR. Chem Biol. 2004;11:1009–1016. doi: 10.1016/j.chembiol.2004.05.009. [DOI] [PubMed] [Google Scholar]
- 20.The synthesis of UDP-GlcNAz was carried out as reported previously (ref. # 21).
- 21.Vocadlo DV, Hang HC, Kim E, Hanover JA, Bertozzi CR. PNAS. 2003;100:9116–9121. doi: 10.1073/pnas.1632821100. [DOI] [PMC free article] [PubMed] [Google Scholar]
- 22.Nandi A, Sprung R, Barma DK, Zhao Y. Anal. Chem. 2006;78:452–458. doi: 10.1021/ac051207j. [DOI] [PubMed] [Google Scholar]
- 23.Kiick KL, Saxon E, Tirrell DA, Bertozzi CR. Proc Natl Acad Sci U S A. 2002;99:19–24. doi: 10.1073/pnas.012583299. [DOI] [PMC free article] [PubMed] [Google Scholar]
- 24.Roquemore EP, Dell A, Morris HR, Panico M, Reason AJ, Savoy L, Wistow GJ, Zinger S, Earles BJ, Hart GW. J. Biol. Chem. 1992;267:555–563. [PubMed] [Google Scholar]
- 25.The purification procedure for OGT was reported previously (ref. #21). Briefly, a plasmid encoding the human OGT gene was transformed into E. coli BL21 (DE3) cells that were grown at 25 °C to an OD595 of 0.8. The culture was then cooled to 18 °C, incubated for 12 h, and cells were subsequently pelleted. The cell pellet was then suspended in 50 mL of imidazole buffer A (50 mM imidazole, 500 mM NaCl, 20 mM Tris, pH 7.4) and sonicated on ice (5 × 15 s, power 70%, microtip Branson Digital Sonifier). Soluble cell extract was applied to a charged Ni column (Amersham Biosciences HiTrap Chealating HP) which was then washed with 10 bed volumes buffer A. OGT was eluted from the column using high imidazole buffer B (250 mM imidazole, 500 mM NaCl, 20 mM Tris, pH 7.4) and the protein eluent was concentrated into TRIS buffer (20 mM) using centrifugation in a microconcentrator. The enzyme solution was stored in 20 % glycerol at −80 C.
- 26.Lubas WA, Smith M, Starr CM, Hanover JA. Biochemistry. 1995;34:1686–1694. doi: 10.1021/bi00005a025. [DOI] [PubMed] [Google Scholar]
- 27.Torres CR, Hart GW. J Biol Chem. 1984;259:3308–3317. [PubMed] [Google Scholar]
- 28.Peptides were prepared on an Advanced Chemtech APEX-396 96-well automated synthesizer using Fmoc-Lys(bioton)-Wang resin (0.03 mmol scale). A 5-fold excess of N-A-Fmoc protected amino acids were coupled using DCC/HOBT in NMP in a single coupling step for each residue. Fmoc deprotection after each coupling step was carried out using a 20% piperidine solution in NMP. Peptides were globally deprotected and cleaved from resin over 4 h upon treatment with 1 mL of 95% TFA that was supplemented with 2.5% triisopropylsilane and 2.5% water. Crude peptides were concentrated in vacuo and purified by reverse-phase HPLC (varian ProStar 210 system) on a C18 column (semipreparative: 10 mm ID × 25 cm, 4 mL/min) using a gradient of acetonitrile:water over 60 min. Purity and structural identity of each library member were verified by LC-ESI-MS.
- 29.CD spectroscopy was carried out on an Aviv 62DS spectrometer with a Peltier temperature controlled cell holder. Samples for data collection were prepared in water and contained 0.5 mg peptide/mL. The CD signal at 25 °C was monitored in 1 nm steps from 200–260 nm, averaging each point for 1 second. Data represents an average of 3 separate experiments.
- 30.Comer FI, Hart GW. Biochem. 2001;40:7845–7852. doi: 10.1021/bi0027480. [DOI] [PubMed] [Google Scholar]