Abstract
The purpose of this research was to use inline real-time near-infrared (NIR) to measure the moisture content of granules manufactured using a commercial production scale continuous twin-screw granulator fluid-bed dryer milling process. A central composite response surface statistical design was used to study the effect of inlet air temperature and dew point on granule moisture content. The NIR moisture content was compared to Karl Fischer (KF) and loss on drying (LOD) moisture determinations. Using multivariate analysis, the data showed a statistically significant correlation between the conventional methods and NIR. The R2 values for predicted moisture content by NIR versus KF and predicted moisture values by NIR versus LOD were 0.94 (p < 0.00001) and 0.85 (p < 0.0002), respectively. The adjusted R2 for KF versus LOD correlation was 0.85 (p < 0.0001). Analysis of the response surface design data showed that inlet air temperature over a range of 35–55°C had a significant linear impact on granule moisture content as measured by predicted NIR (adjusted R2 = 0.84, p < 0.02), KF (adjusted R2 = 0.91, p < 0.0001), and LOD (adjusted R2 = 0.85, p < 0.0006). The inlet air dew point range of 10–20°C did not have a significant impact on any of the moisture measurements.
Key words: continuous granulation–drying–milling, near-infrared (NIR) spectroscopy, process analytical technology (PAT), real-time moisture determination
INTRODUCTION
The near-infrared (NIR) region (780–2,500 nm) was discovered by Herschel (1) almost 200 years ago and since then it has been explored for various applications making it an important process analytical technology (PAT) tool. Several reviews have been published that discuss the basic principles and pharmaceutical applications of NIR spectroscopy (2,3). The use of NIR has found increasing pharmaceutical analysis applications for the identification and quality testing of raw materials (2,3), monitoring of blending (4,5), roller compaction (5,6), and fluid-bed granulation and drying operations (7–9). It has also been used as a nondestructive technique to monitor tablet (10) and tablet-coating (11) manufacturing processes. NIR has been used to determine drug product authenticity (12). According to the Food and Drug Administration, “PAT is a system for designing, analyzing, and controlling manufacturing through timely measurements (i.e., during processing) of critical quality and performance attributes of raw and in-process materials and processes with the goal of ensuring final product quality” (13).
The NIR spectrum captures molecular vibrations of functional groups like O-H, C-H, and N-H. Water has five characteristic absorption maxima in the NIR region (760, 970, 1,190, 1,450, and 1,940 nm) and thus NIR can be effectively used to determine moisture content of pharmaceutical raw materials and granules (2).
Optimal granule moisture content is critical for production of tablets with desired performance. While too high a moisture content may lead to sticking and picking of the tablets during compression, low moisture content can result in tablet lamination or friability issues. Often, these granulations have very limited acceptable moisture ranges such as 1.0–1.2% loss on drying (LOD). In order to consistently manufacture granules to meet these moisture requirements, efficient drying processes such as fluid-bed drying will have very precise end points to ensure the granule meets the desired moisture specifications. Currently employed drying control schemes use a number of engineering algorithms that include inline measurement of process parameters such as exhaust air dew points and temperatures and rate of change of product temperatures. While these approaches meet production needs, the optimum system would include inline real-time measurement and process control feedback loops that measure moisture content directly. NIR fiber optic probes can be used to monitor the granule drying process noninvasively inline in real-time which can decrease analytical time and cost, decrease production cycle time, and increase material throughput.
The use of inline real-time PAT will become even more important as companies switch from batch processes to continuous manufacturing processes (14). This study is part of a larger program that involves the conversion of tablet wet granulation fluid-bed drying milling batch unit operations to a continuous process. The purpose of this research was to use inline real-time NIR to measure the moisture content of granules manufactured using a commercial production scale continuous twin-screw granulator fluid-bed dryer milling process. The overarching goal is to convert the LOD granule moisture measurements that are currently made on the manufacturing floor for the batch fluid-bed drying process to inline real-time NIR moisture determinations. A NIR moisture-content partial least squares (PLS) regression model was correlated to Karl Fischer (KF) moisture values. Since LOD measurements are the current in-process standard moisture measurement technique, a correlation between LOD and KF moisture content was also developed for this specific granulation. This is an important correlation to establish as it provides a link to improve process understanding for the established large historical LOD database and the recognized standard laboratory measure of moisture content analysis, KF. In addition, this relationship also provides a link to the NIR measurement because KF is used as the calibration standard for the NIR instrument. Another aim of this study was to investigate the effect of inlet air temperature and dew point on granule moisture content using a central composite response surface statistical design.
MATERIALS AND METHODS
Materials and Equipment
The bulk active pharmaceutical ingredient, povidone, hypromellose, and United States Pharmacopeia (USP) water were supplied by GlaxoSmithKline (GSK), Zebulon, NC, USA.
A production scale continuous granulation fluid-bed drying milling process utilized the ConsiGma™ system (by GEA Pharma Systems nv-Collette™). The ConsiGma system links a continuous corotating, nonintermeshing twin-screw granulator, a semi-continuous six-cell fluid-bed dryer, and a Quadro® Comil® through vacuum transfer connections.
The ABB-Bomem Networkir (NIR system), Computrac® 1000 LOD Analyzer, and Orion Turbo 2 Karl Fischer blending volumetric titrator were used to make moisture measurements. SIMCA-P version 11.5 (15) and JMP 8® software (16) were used for data generation and analysis.
Methods
Near Infrared
The NIR probe was calibrated using KF data as the reference standard. The NIR had an ABB process analyzer that averaged 32 full spectrum scans at a resolution of 6 nm. The spectra were preprocessed using the first derivative in conjunction with center scaling to remove baseline drift and other effects such as particle size and temperature. PLS modeling in SIMCA multivariate analysis software correlated the NIR–OH combination (∼1,940 nm) and first overtone (∼1,450 nm) to the KF values.
Karl Fischer
The KF titrator was calibrated with 25 μL of USP water. This was repeated to attain three readings within the calibration range. The water content of approximately 4 g of granules was determined. The KF analysis was performed in duplicate.
Loss on Drying
A Computrac was calibrated using certified calibration weights. Approximately 4 g of granulation was tested immediately on the manufacturing floor. The sample was dried at 80°C until the rate of change in moisture content was less than 0.1% LOD and the % LOD was then recorded. LOD test sample measurements were made in triplicate.
Experimental Design
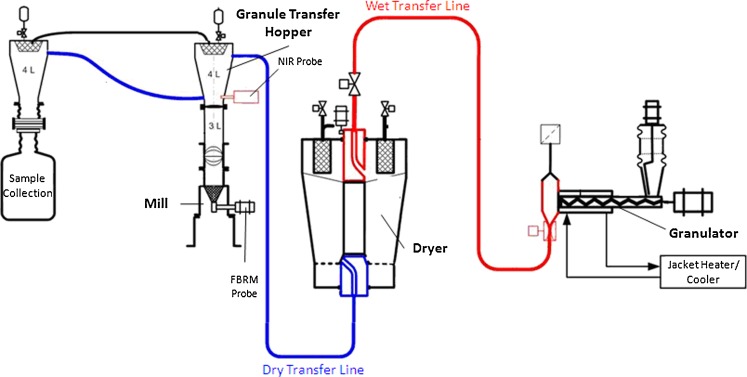
The continuous granulation–drying–milling manufacturing process involved a “kit” that connected the three unit operations through vacuum transfer of the processed material (ConsiGma™ by GEA Pharma Systems nv-Collette). Figure 1 depicts the kit layout where the continuous twin-screw granulator was linked to a six-cell fluid-bed dryer which was connected to a mill. The focus of this study was on the drying process, so other processing parameters such as powder feed rate, liquid addition rate, granulator screw speed and configuration, mill screen size, and speed were held constant. A number of drying process parameters were also held constant such as air flow rate, amount of granule material added to each cell, and drying residence time in each of the six drying cells. Based on learnings from previous experiments, a central composite response surface statistical design was used to study the effect of inlet air temperature and dew point on granule moisture content. The inlet air temperature and dew point were studied at 35°C, 45°C, and 55°C and 10°C, 15°C, and 20°C, respectively. The center point was replicated to provide an estimate of the experimental error and information on response curvature. The randomized run design is shown in Table I. Inline real-time NIR moisture content measurements were compared to offline KF and LOD analysis done on the manufacturing floor.
Fig. 1.
Flow diagram of ConsiGma™ continuous granulator–dryer–milling kit (Courtesy GSK Zebulon, NC, USA)
Table I.
Central Composite Response Surface Experimental Design
| Runs | Inlet air temperature (°C) | Inlet air dew point (°C) | KF (% w/w)a (% RSD)b | LOD (% w/w) (% RSD) | Predicted NIR (% w/w) |
|---|---|---|---|---|---|
| 1 Center point | 45 | 15 | 0.72 (5.9) | 0.54 (4.6) | 0.76 |
| 2 | 35 | 15 | 0.88 (4.8) | 0.74 (14) | 0.93 |
| 3 | 35 | 20 | 1.0 (2.8) | 0.85 (4.7) | 1.0 |
| 4 Center point | 45 | 15 | 0.68 (3.1) | 0.48 (1.2) | 0.60 |
| 5 | 55 | 15 | 0.54 (6.6) | 0.41 (10) | 0.56 |
| 6 | 55 | 10 | 0.43 (6.6) | 0.46 (26) | 0.46 |
| 7 | 35 | 10 | 1.06 (6.7) | 0.90 (3.3) | 0.98 |
| 8 | 45 | 20 | 0.69 (1.0) | 0.55 (11) | 0.76 |
| 9 | 45 | 10 | 0.71 (3.0) | 0.72 (4.3) | 0.67 |
| 10 | 55 | 20 | 0.46 (3.1) | 0.35 (0.0) | 0.43 |
a% w/w is percent weight–weight
b% RSD is percent relative standard deviation
Sampling
The semicontinuous fluid-bed dryer consisted of six drying chambers or cells with a rotating inlet and discharge valve. A predetermined amount of wet granulation was loaded into a drying cell via an inlet control valve, after which the valve moved to the next cell while the wet granulation in the first cell continued to dry. When the drying process was completed, a discharge valve rotated to allow the dried granulation to be vacuumed transferred to the mill for particle sizing. For purposes of this study, the dried granulation was diverted at pre-assigned intervals to prelabeled moisture-impermeable sample bins. These dried granulation samples were used for KF and LOD moisture analysis. This sample transfer line bypassed the mill. The NIR probe was located at the level of the sample transfer line and granule moisture measurements were made real-time. The time-stamped NIR sample was matched with the corresponding sample bins which were processed for moisture content analysis. LOD measurements were made immediately after sample collection. The KF moisture determinations were completed within 2 days of sampling.
RESULTS AND DISCUSSION
Granule Moisture Content
The KF, LOD, and predicted NIR results of the design of experiments (DoE) are provided in Table I. The time-stamped KF and LOD values were associated with the corresponding NIR spectra. PLS was used to construct predictive models capable of determining the moisture of the granulation inline during operation. Historically, granule drying endpoint was in part determined by the LOD value. However, with the application of PAT, the LOD value can be replaced with a model based on the more accurate KF moisture reference value. Therefore, both LOD and KF were investigated in this analysis. The data were analyzed using Simca P+ version 11.5.
Model analysis was complicated by several experimental constraints. These constraints are thought to have resulted in lower R2 values than are commonly achieved with PLS predictive modeling of moisture content using NIR. Acceptable tablet manufacture required fairly low moisture contents over a relatively narrow operating range. To build a good regression model, it is desirable to have a wide range of y-values which was not practical in this study. Even with the induced variability of the experimental design, the range of moisture values for the final granule was 0.43–1.06% w/w for KF and 0.35–0.90% w/w LOD. Also, a limited number of experimental runs was another constraint. The desire to curtail the interruption of routine manufacturing and experimental run time limited the number of trial runs that could be used to develop the PLS model. A DoE was used to minimize the number of experimental runs and material run time that were required to develop the PLS regression model. Because this process is run in a continuous manner, only one sample was acquired per run when the operation was at steady-state based on the DoE design conditions. Due to the limited number of samples, all ten samples were used in the calibration set for both models. Typically in the development of PLS models, the acquired data are separated into a calibration (training) set used to create the model and a prediction (validation) set used to independently verify the model. The risk of not using an independent prediction set to validate the model would be mitigated by collecting samples from future batches and continuously verifying the suitability of the model. Despite these limitations, to the best of the authors’ knowledge, this is the first research report that describes the use of inline real-time NIR to measure granule moisture content for a production scale continuous granulating–drying–milling process.
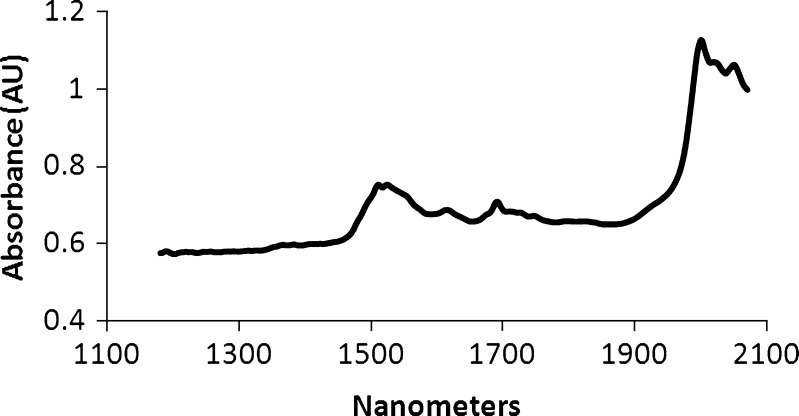
Individual PLS models based on KF and LOD values were created separately. Since NIR spectra can be sensitive to environmental (temperature) and sample (particle size) effects, it was necessary to apply a preprocessing technique to the data. An example spectrum is presented in Fig. 2. Absorption bands associated with water are not evident in the spectra due to the low amount of moisture present in the dried granulation. This further demonstrates the need to model the data using a multivariate technique such as PLS. In both PLS models, the spectral range from 1,176 to 2,083 nm containing the combination band and first overtone for the –OH bond was utilized. A first derivative pre-processing was applied and the two components were calculated based on cross-validation. As expected the models for KF and LOD were very similar. Table II provides summary statistics for each model.
Fig. 2.
Example near infra-red spectrum of API granule
Table II.
Summary Statistics of PLS Models
| Statistic | KF model | LOD model |
|---|---|---|
| Spectral range, nm | 1,176–2,083 | 1,176–2,083 |
| Components | 2 | 2 |
| Slope | 1.00 | 1.00 |
| Intercept | 0.00 | 0.00 |
| Root mean squared error of calibration (RMSEC) | 0.06 | 0.08 |
| R 2 | 0.94 | 0.85 |
| p value | <0.00001 | <0.0002 |
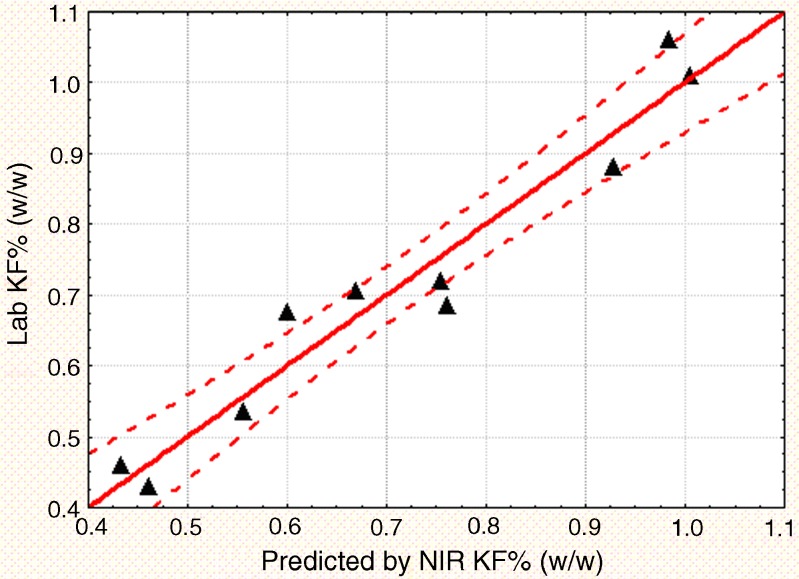
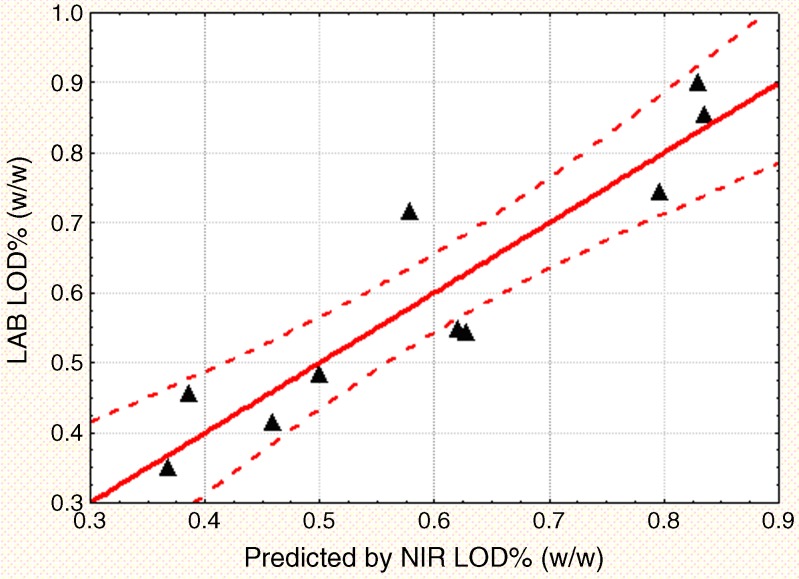
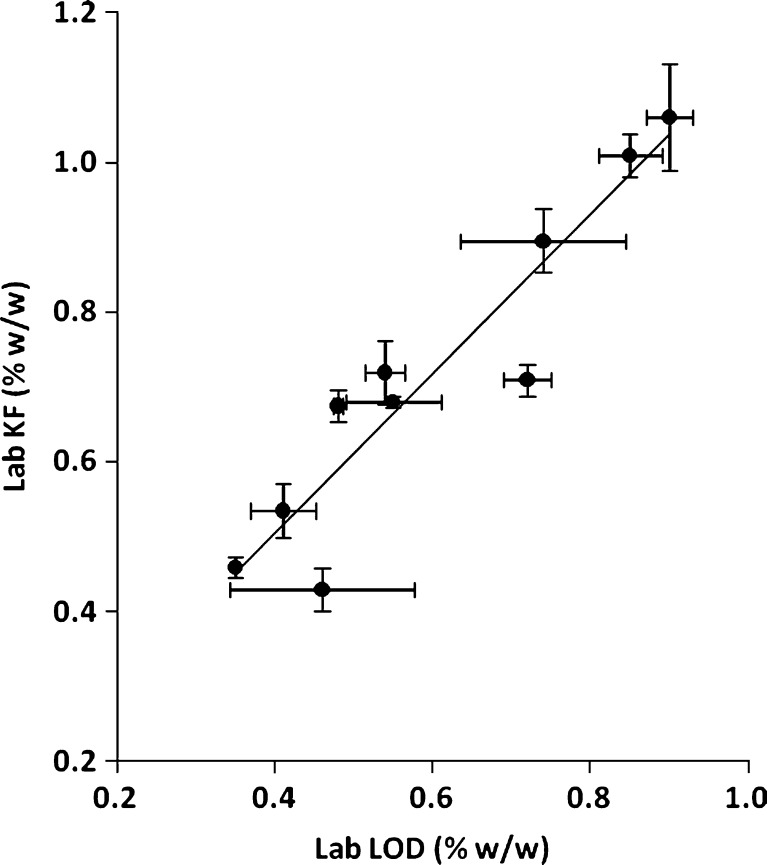
Figures 3 and 4 display the regression line and the 95% confidence intervals for the KF and LOD PLS models, respectively. As shown in the figures, KF is a more accurate and precise measurement of moisture compared to a gravimetric loss on drying methodology. Therefore, the KF PLS model provides a more precise measure of the moisture content. In order to replace the current LOD technique with an NIR method that uses KF as the calibration standard, a correlation between LOD and KF was established (Fig. 5). The correlation had an adjusted R2 of 0.85 and was statistically significant with a p value less than 0.0001. The correlation equation can be used to relate the established manufacturing LOD action limits and specifications to corresponding KF and NIR moisture values.
Fig. 3.
Regression line for the KF PLS model
Fig. 4.
Regression line for the LOD PLS model
Fig. 5.
Regression line for KF versus LOD (bars represent standard deviation)
Effect of Inlet Air Temperature and Dew Point on Granule Moisture Content
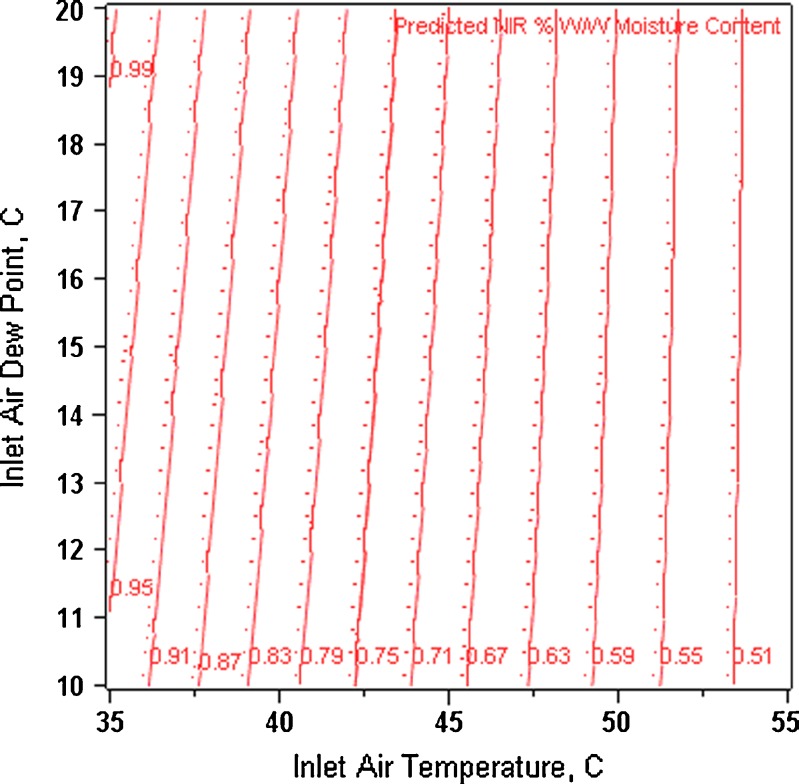
All three moisture measurement techniques provided a statistically significant linear model for granule moisture content. The coefficient of determinations and p values are NIR (adjusted R2 = 0.84, p < 0.02), KF (adjusted R2 = 0.91, p < 0.0001), and LOD (adjusted R2 = 0.85, p < 0.0006), respectively. Statistical analysis showed that inlet air temperature had a significant linear impact (NIR p < 0.002, KF p < 0.0001, and LOD p < 0.0002) on granule moisture content over the range of 35–55°C. The inlet air dew point range of 10–20°C did not have a significant impact on moisture measurements made by any of the methods studied. Figure 6 is a contour plot of the predicted NIR moisture content values as a function of inlet dew point and inlet air temperature. The plot shows that as the inlet air temperature increases the granule moisture content decreases. Even though inlet air dew point was shown to not have a statistically significant influence on granule moisture content, the contour plot suggests that there is a trend towards lower granule moisture content as the inlet air dew point is decreased. Intuitively, one would expect a higher inlet temperature and lower inlet air dew point to provide granules with lower moisture content. The DoE results are consistent with this notion. More importantly, the DoE results suggest that inlet air dew point should not be considered a critical process variable. Moreover, there is only an approximate 0.5% w/w change in the granule moisture content when the inlet air temperature and inlet dew point are varied from 35°C to 55°C and 10°C to 20°C, respectively. This indicates that the drying process is well controlled and robust over a relatively wide range of variable conditions.
Fig. 6.
Contour plot of predicted NIR moisture content as a function of inlet air temperature and dew point
CONCLUSION
Inline real-time, NIR was used to measure the moisture content of granules manufactured using a continuous twin-screw granulator fluid-bed dryer milling process. Statistically significant NIR moisture content PLS regression models were determined for KF and LOD moisture values. The KF model demonstrated that moisture measured by KF was a more effective reference technique for inline NIR measurements compared to LOD. A statistically significant correlation was found between KF and LOD moisture values. This correlation provided a link between the LOD historical database and KF which was used as the calibration standard for the NIR instrument. A central composite response surface experimental design was used to study the effect of inlet air temperature and dew point on granule moisture content. Inlet air temperature was found to have a significant effect on granule moisture content measured by NIR, KF, and LOD. At the inlet air dew point range studied, inlet air dew point did not have a significant impact on granule moisture content. Despite the study limitations, it is unique as it attempts to employ the application of NIR as a PAT tool for moisture content measurements during a continuous manufacturing process which has not been reported so far in the literature to the best of the authors’ knowledge (14).
Acknowledgments
We appreciate the generous support of GlaxoSmithKline (GSK). We also appreciate the support of Mr. Scott Staton, operation and formulation manager at Campbell University Pharmaceutical Sciences Institute for editing the flow diagram of ConsiGma™ kit provided by GSK (Zebulon).
References
- 1.Herschel W. Investigation of the powers of the prismatic colours to heat and illuminate objects; with remarks, that prove the different refrangibility of radiant heat, to which is added, an inquiry into the method of viewing the sun advantageously, with telescopes of large apertures and high magnifying powers. Phil Trans Roy Soc. 1800;90:255–83. doi: 10.1098/rstl.1800.0014. [DOI] [Google Scholar]
- 2.Reich G. Near-infrared spectroscopy and imaging: basic priniciples and pharmaceutical applications. Adv Drug Delivery Rev. 2005;57:1109–43. doi: 10.1016/j.addr.2005.01.020. [DOI] [PubMed] [Google Scholar]
- 3.Swarbrick B. Process analytical technology: a strategy for keeping manufacturing viable in Australia. Vib Spectrosc. 2007;44:171–8. doi: 10.1016/j.vibspec.2006.02.011. [DOI] [Google Scholar]
- 4.Ufret C, Morris K. Modeling of powder blending using on-line near-infrared measurements. Drug Dev Ind Pharm. 2001;27:719–29. doi: 10.1081/DDC-100107329. [DOI] [PubMed] [Google Scholar]
- 5.Gupta A, Peck GE, Miller RW, Morris KR. Real-time near-infrared monitoring of content uniformity, moisture content, compact density, tensile strength, and Young’s modulus of roller compacted powder blends. J Pharm Sci. 2005;94:1589–97. doi: 10.1002/jps.20375. [DOI] [PubMed] [Google Scholar]
- 6.Gupta A, Peck GE, Miller RW, Morris KR. Influence of ambient moisture on the compaction behavior of microcrystalline cellulose powder undergoing uni-axial compression and roller compaction: a comparative study using near-infrared spectroscopy. J Pharm Sci. 2005;94:2301–13. doi: 10.1002/jps.20430. [DOI] [PubMed] [Google Scholar]
- 7.Morris KR, Stowell JG, Byrn SR, Placette AW, Davis TD, Peck GE. Accelerated fluid bed drying using NIR monitoring and phenomenological modeling. Drug Dev Ind Pharm. 2000;26:985–8. doi: 10.1081/DDC-100101326. [DOI] [PubMed] [Google Scholar]
- 8.Findlay WP, Peck GE, Morris KR. Determination of fluidized bed granulation end point using near-infrared spectroscopy and phenomenological analysis. J Pharm Sci. 2005;94:604–12. doi: 10.1002/jps.20276. [DOI] [PubMed] [Google Scholar]
- 9.Nieuwmeyer FJS, Damen M, Gerich A, Rusmini F, van der Voort Maarschalk K, Vromans H. Granule characterization during fluid bed drying by development of a near infrared method to determine water content and median granule size. Pharm Res. 2007;24:1854–61. doi: 10.1007/s11095-007-9305-5. [DOI] [PubMed] [Google Scholar]
- 10.Tabasi SH, Fahmy R, Bensley D, O’Brien C, Hoag SW. Quality by design, part I: application of NIR spectroscopy to monitor tablet manufacturing process. J Pharm Sci. 2008;97:4040–51. doi: 10.1002/jps.21303. [DOI] [PubMed] [Google Scholar]
- 11.Tabasi SH, Fahmy R, Bensley D, O’Brien C, Hoag SW. Quality by design, part II: application of NIR spectroscopy to monitor the coating process for a pharmaceutical sustained release product. J Pharm Sci. 2008;97:4052–66. doi: 10.1002/jps.21307. [DOI] [PubMed] [Google Scholar]
- 12.Poli JE, Hoag SW, Flank S. Comparison of authentic and suspect pharmaceuticals. Pharm Technol. 2009;33:46–52. [Google Scholar]
- 13.U.S. FDA. Office of Pharmaceutical Science (OPS). Process analytical technology (PAT) initiative. http://www.fda.gov/cder/OPS/PAT.htm. Accessed 1 Mar 2011.
- 14.De Beer T, Burggraeve A, Fonteyne M, Saerens L, Remon JP, Vervaet C. Near infrared and Raman spectroscopy for the in-process monitoring of pharmaceutical production processes. Int J Pharm. 2010. doi:10.1016/j.ijphar.2010.12.012. [DOI] [PubMed]
- 15.Simca-P+ version 11.5. Umetrics AB. Umea, Sweden.
- 16.JMP® 8 Design of experiments software. SAS Institute Inc. Cary, NC: SAS Publishing, 2008.


