Abstract
Oral bioavailability of atorvastatin calcium (ATC) is very low (only 14%) due to instability and incomplete intestinal absorption and/or extensive gut wall extraction. When ATC is packed in the form of tablets, powders, etc., it gets destabilized as it is exposed to the oxidative environment, which is usually present during the production process, the storage of the substance, and the pharmaceutical formulation. Therefore, stabilized gastro-retentive floating tablets of ATC were prepared to enhance bioavailability. Water sorption and viscosity measurement studies are performed to get the best polymer matrix for gastro-retention. A 32 factorial design used to prepare optimized formulation of ATC. The selected excipients such as docusate sodium enhanced the stability and solubility of ATC in gastric media and tablet dosage form. The best formulation (F4) consisting of hypromellose, sodium bicarbonate, polyethylene oxide, docusate sodium, mannitol, crosscarmellose sodium, and magnesium stearate, gave floating lag time of 56 ± 4.16 s and good matrix integrity with in vitro dissolution of 98.2% in 12 h. After stability studies, no significant change was observed in stability, solubility, floating lag time, total floating duration, matrix integrity, and sustained drug release rates, as confirmed by DSC and powder X-ray diffraction studies. In vivo pharmacokinetic study performed in rabbits revealed enhanced bioavailability of F4 floating tablets, about 1.6 times compared with that of the conventional tablet (Storvas® 80 mg tablet). These results suggest that the gastric resident formulation is a promising approach for the oral delivery of ATC for improving bioavailability.
Key words: atorvastatin calcium, bioavailibility, floating tablets, gastro-retention, stabilization
INTRODUCTION
Atorvastatin calcium (ATC) is the most preferred molecule among statins, used to treat moderate to severe familial or non-familial hypercholesterolemia, and is introduced by Pfizer Inc., USA as Lipitor®. ATC is unstable and at risk to heat, light, and moisture when packed in the form of tablets, powders, granules, or within capsules; as a result, the hydroxy acid form (HF) is converted to lactone form (LF) (1,2). As the HF of ATC exists as free acid species, it is about 15 times more soluble than the LF since the carboxyl group of the hydroxyl acid ionizes; this difference in the solubility becomes even greater. The reaction mechanism is given in Fig. 1.
Fig. 1.
The mechanism for the specific acid-catalyzed lactonization of the hydroxy acid form of ATC (forward direction) and the specific acid-catalyzed hydrolysis of the lactone of ATC (reverse direction). R remainder of the molecule, and chemical structure of Atorvastatin Calcium
The physicochemical properties of the LF and HF of ATC impact their formulation and biologic performance, hence, it is an important consideration when developing ATC formulation (3). The acid and lactone forms of the drug have log D values (octanol/water coefficient) of 1.53 and 4.2 at pH 7.4, respectively (4). ATC is further destabilized by contact with the molecular moieties of other components present in the formulation. Since any of the excipients such as binders, diluents, anti-adherents, surfactants, and the like may negatively interact with the active ingredient, stabilizing means for effective pharmaceutical dosages of ATC is necessary. Therefore, Lipitor® consists of an alkaline earth metal salt such as calcium carbonate (5).
To overcome this instability, plentiful experiments were performed during the last decade which include ATC-cyclodextrin complexation, where the LF formed is 0.25% after 1 month of stability (6). A tablet formulation containing a complexing agent (cyclodextrins) and a surfactant (d-alpha tocopherol polyethylene glycol 1000 succinate) is reported (7). Self-microemulsifying drug delivery systems of ATC consisting of Labrafil (Linoleoyl polyoxylglycerides), propylene glycol, and Cremophor RH40 (Polyoxyl 40 hydrogenated castor oil) have been developed (8). Recently, another self-emulsifying drug delivery system of ATC in various vehicles, such as, Captex 355 (glyceryl triacetate), ethyl oleate, Capmul MCM (glyceryl monooleate), Gelucire 44/14 (lauroyl polyoxylglycerides), polysorbate 80 (polyoxyethylene sorbitan fatty acid esters), PEG 400 (polyethylene glycol), has been reported (9). Most of the drug delivery systems reported earlier lacks the degradation studies and higher dose (80 mg) formulation studies; these formulations also have the disadvantage of complex preparation procedure and the use of expensive additives with more equipment and apparatus.
This instability of ATC leading to poor solubility is the main cause for low bioavailability of the drug after oral administration as the absolute bioavailability of ATC is only 14%. The hepatic first-pass effect is too small to fully explain the low bioavailability of ATC; it might be a cause of incomplete intestinal absorption and/or extensive gut wall extraction (10). Since the drug escapes in unsolubilized form without absorption from the upper GI tract, the possible absorption area of the drug, the aim of the present study, therefore, was to improve the oral bioavailability of ATC in a stabilized gastro-retentive floating dosage form consisting of a polymer matrix, gas-generating agent, solubility, and stability enhancer. Floating formulations usually ensures a complete and constant drug release within a period of 12 h particularly for drugs that absorb in the particular gastric region, thereby enhancing bioavailability (11).
MATERIALS AND METHODS
Materials
ATC was a gift from Lupin India Ltd. Hypromellose (HPMC) K100LV, K4M, and K15M; carboxy methylcellulose codium (CMC); polyethylene oxide (PEO); and cross-linked carboxy methylcellulose sodium (CCMC) were obtained as gift samples from M/s Colorcon Asia Pvt Ltd. Docusate sodium (DSS) was received from Signet Corporation India as a gift sample. All other solvents and reagents were purchased from Ranbaxy Chemicals, India and were of analytical grade.
Methods
Initial Studies and Optimization Process
Floating matrix tablets was prepared by a gas generation technique for the retention of its dosage form in the stomach using polymers such as HPMC (K100LV, K4M, and K15M), Carbopol934p, and CMC so as to prevent the escape of gas generated by the system in acidic media. The polymers evaluated were with respect to some specific parameters that included:
Water Sorption and Viscosity Measurement Studies
For the water sorption study, pure polymer disk of 150 mg was prepared and placed on the weighing balance and tarred. A tarred polymer disk was placed on a 10-cm wet Whatman filter paper (previously soaked in distilled water) in a Petri dish for about 48 h. During this interval, the polymer disk reaches the equilibrium and shows swelling. The swollen disk was removed immediately and weighed on digital balance. The percentage of water absorbed was calculated using the following formula:
 |
- Ws
Weight of swollen disk
- Wd
Weight of dry disk
Determination of Viscosity
Polymeric solution of 1% (w/v) concentration was prepared in 100 ml of water. In the case of carbopol934p, sodium hydroxide was used to neutralize the solution. The viscosities of the prepared polymeric solution was determined by using Brookfield viscometer capacity 2000+. Suitable RMP and spindle were selected and viscosity was determined.
Stabilization and Solubilization of ATC
To develop ATC floating tablets, it was necessary to stabilize the drug in the presence of other excipients in the formulation and get the greatest solubility product in acidic media. Therefore, initial stability studies were performed by storing a mixture of ATC, HPMC, and other solubilizers Span 80 (sorbitan monooleate), polysorbate 80, PEG 4000, poloxamer 407 (polyoxyethylene-polyoxypropylene copolymer), sodium lauryl sulfate (SLS), DSS, etc., at 25 ± 0.5°C/60 ± 5% RH and analyzed after 1 month. Formulations AT01, AT05, AT07, and AT08, consisting of PEO, SLS, Poloxamer, and DSS, respectively, were able to enhance solubility of ATC (Table I).
Table I.
Influence of Various Stabilizers/Solubilizers on Physicochemical Properties of ATC; Samples Stored at 25 ± 0.5°C/60 ± 5% RH and Analyzed After 1 Month
| Formula code | Excipientsa | Drug dissolved at 6th hour (%) | Drug content (%) | FLT (s) | Lactone content (%) | MI |
|---|---|---|---|---|---|---|
| AT 01 | Polyox, 20 mg | 46 | 96.41 | 6 | 2.98 | + |
| AT 02 | Citric acid, 40 mg | 04 | 94.60 | 4 | 5.09 | +++ |
| AT 03 | PEG (4000), 120 mg | 26 | 94.33 | 15 | 3.73 | + |
| AT 04 | Span (60), 120 mg | 07 | 96.42 | 55 | 3.51 | +++ |
| AT 05 | SLS, 20 mg | 51 | 95.54 | 120 | 3.77 | + |
| AT 06 | Tween (80), 20 mg | 35 | 96.20 | 120 | 3.54 | ++ |
| AT 07 | Polaxomar (407), 80 mg | 52 | 96.39 | 1,200 | 2.99 | + |
| AT 08 | DSS, 200 mg | 55 | 99.64 | 300 | Nil | +++ |
(+) bad (matrix dissolves within 2 h of dissolution), (++) average (matrix dissolves within 4 h of dissolution), (+++) good (matrix remains intact for more than 8 h during dissolution)
aOther ingredients that are constant include, ATC = 80 mg, HPMC K15M = 160 mg, NaHCO3 = 200 mg, and magnesium stearate = 10 mg
Formulation and Optimization of Floating Tablets
Based on the water sorption and viscosity measurement study, HPMC K15M was selected as matrixing agent. ATC, HPMC K15M, PEO, sodium bicarbonate, and DSS were combined to produce tablets to check floating lag time (FLT; the time required for the tablet to rise to the surface and float), matrix integrity (MI; swollen mass of the tablet remains intact or not during dissolution), and total floating duration to set-up robust floating formulation. The direct compression method was employed to prepare 900-mg tablets and subjected to further evaluation. Individual powders, namely ATC, release-retarding polymer(s) HPMC K15M (15,000 cps), gas-forming agent such as sodium bicarbonate, solubilizers such as DSS, PEO-N10, water wicking agent CCMC, and diluent such as mannitol passed through sieve no. 60 and mixed in a polybag for 10 min; magnesium stearate was then added to the mixture. Mixing continued for another 3 min and finally, the mixed powder blend was compressed by using punches of 18.9 × 8.9 mm on eight-station single rotary “D” tooling compression machine (Make: Rimek, Model: R&D model), to produce the desired tablets. The hardness of the tablets was adjusted at 6 kg/cm2 using a Monsanto hardness tester. The effects of selected variables on various responses were studied by using 32 factorial design, in which the effect of the two variables, i.e., DSS and PEO on drug dissolution was observed. Other variables such as amount of ATC, HPMC, sodium bicarbonate, Pearlitol, CCMC, and magnesium stearate were kept constant. The three-level set include: lower level (−1), middle level (0), and upper level (+1).
In Vitro Evaluation of the Prepared Tablets
Tablet Weight Variation
Twenty tablets were randomly selected and accurately weighed. Results are expressed as mean values ± SD.
Tablet Thickness
A micrometer screw-gauge of 0–20 mm, RAC Exports Ltd., Haryana India, micrometer sand blast type, least count 0.01 mm was used to find the thickness of ten randomly selected tablets. Results are expressed as mean values ± SD.
ATC Content Uniformity
Ten tablets were individually weighed and crushed. A weighed measure of powder is equal to the mass of one tablet (900 mg) taken in 100-mL standard flask. This powder was dissolved in 10 ml of methanol and made up to a volume with 0.1 N HCl. The filtered solution through a Whatman filter paper diluted suitably and analyzed for drug content. The drug content was determined by high-performance liquid chromatography (HPLC).
Tablet Friability
According to the British Pharmacopeia specifications, ten tablets were randomly selected and placed in the drum of a tablet friability test apparatus, Veego Instruments Corporation, Mumbai India, model: VFT-2D. The drum was adjusted to rotate 100 times in 4 min. The tablets were removed, dedusted, and accurately weighed. The percent weight loss was calculated (12).
In Vitro Buoyancy Study
The floating behavior of the tablets was visually determined in triplicate. The tablets were placed in a glass beaker, containing 200 mL of 0.1 N HCl as a medium, maintained in a water bath at 37 ± 0.5°C. Floating lag time and total floating duration (time during which tablet remains buoyant) were recorded (13).
Differential Scanning Calorimetry
The differential scanning calorimetry (DSC) studies were carried out on the pure drug, with and without excipients. DSC measurements were performed on a Mettler-toledo 821 instrument, Switzerland. The amount of drug analyzed ranged from 3 to 5 mg and placed in a perforated aluminum-sealed 5-μl pans at a heating rate of 5°C/min ranging from 40°C to 250°C using nitrogen as blanket gas (20 ml/min) (14).
Powder X-ray Diffraction
The powder X-ray diffraction patterns of the pure drug and formulations were investigated by using an X-pert pro and Pro-Anac diffractometer, PANalytical India (West) Spectris Technologies Pvt. Ltd, Mumbai, India. The samples were irradiated with monochromatized CuKα radiation and the scanning range (2θ) was from 2 to 50. The voltage and current set was at 30 kV and 30 mA, respectively. X-ray patterns analyzed using X-Pert data collector and X-Pert data viewer V-1.0 software (15).
Drug Release Study
The in vitro dissolution rate was measured by using USP type II (USP 34) dissolution test apparatus, Electrolab Mumbai India, Model: TDT-06L. Dissolution medium consists of 0.1 N HCL (900 ml); the temperature adjusted at 37 ± 0.5°C with an agitation speed of 75 rpm. The collected samples were filtered and replaced with fresh media at predetermined time points. The drug release study was estimated by HPLC at 246 nm.
Stability Studies
Stability studies were carried out according to the International Conference on Harmonization (ICH) guidelines. The samples were stored at 40 ± 0.5°C/75 ± 5% and 25 ± 0.5°C/60 ± 5% RH for 6 months, Thermolab Scientific Equipments Pvt Ltd, Thane India, Stability Chamber TS90S. The samples were withdrawn and evaluated for FLT, MI, tablet friability, drug content, and dissolution rate (16). The percent LF content was determined by HPLC.
HPLC Analysis
Analysis of samples was performed with a Jasco HPLC system, Jasco Corporation Tokyo Japan, PU2080 isocratic pump, with reverse phase Hi Qsil, 250 mm × 0.45 ID, 5 μm C18 column, and mobile phase comprising acetonitrile and phosphate buffer at pH 3 in 70:30 ratio. The wavelength set was at 246 nm, at a flow rate of 1 ml/min. The calibration curve plots were between the concentration range 10–100 μg/ml and showed a correlation coefficient of 0.9994 (6).
Pharmacokinetic Parameters of ATC Floating Tablets
The protocol for the animal study in prescribed pro forma B approved was by the IAEC (Institutional animal ethical committee, Y. B. Chavan College of Pharmacy, Dr. Rafiq Zakaria Campus, Rauza Baugh, P. B. No.27, Aurangabad, India, Reg no: 844/ac/04/CPCSEA). Albino rabbits of both sexes weighing 2–3 kg were fasted overnight and divided into two groups. Conventional tablets of 10 mg strength as reference was administered to group A and F4 floating formulation was given to group B. Blood samples were collected at 0.25, 0.5, 1, 2, 3, 4,6, 8,12, and 24 h. Blood (3 ml) was withdrawn from the marginal ear vein. Whole blood withdrawn was centrifuged to separate serum; 1 ml was pipetted, deprotinated, and diluted with acetonitrile to make 0.1 μg/ml of drug solution. Estimation of ATC was done by HPLC. The limit of quantitation was 0.25 μg ml−1 and limit of detection was 0.05 μg ml−1.
RESULTS AND DISCUSSION
Initial Studies and Optimization Process
Water Sorption and Viscosity Measurement Studies
When the water sorption commences, the water penetration front initially will develop and move inward. This inward movement of water causes the relaxation of polymeric chains, which begin to repeat. This relaxation is attributable to the glassy-to-rubbery phase transition. In other words, as time passes, the glassy core diminishes and the tablet dimensions change in the axial and radial directions. HPMC K100LV and HPMC K4M undergo disintegration faster due to less water sorption to relax the polymeric chains that have low viscosity. As the viscosity grade increases, the water sorption rate increases, and at the end of the experiment the higher viscosity polymer HPMC K15M exhibited maximum water sorption. However, this increase in the absorption rate does not necessarily lead to shrink the tablet dimensions by the process of erosion or dissolution of the polymeric chains, because a gel layer is formed in case the high viscosity polymer is resistant to erosion. At the same time, the hydrophilic nature of the polymer facilitates the water sorption (17). This shows that HPMC K15M showed better water sorption in comparison to HPMC K100LV, HPMC K4M, and carbopol 934p, and the polymer with least water sorption was sodium CMC. With a viscosity of 1% solution of the polymers, HPMC K15M was greater than carbopol934p while sodium CMC showed least viscosity. Hence, HPMC K15M was selected as a polymer matrix.
Stabilization and Solubilization of ATC
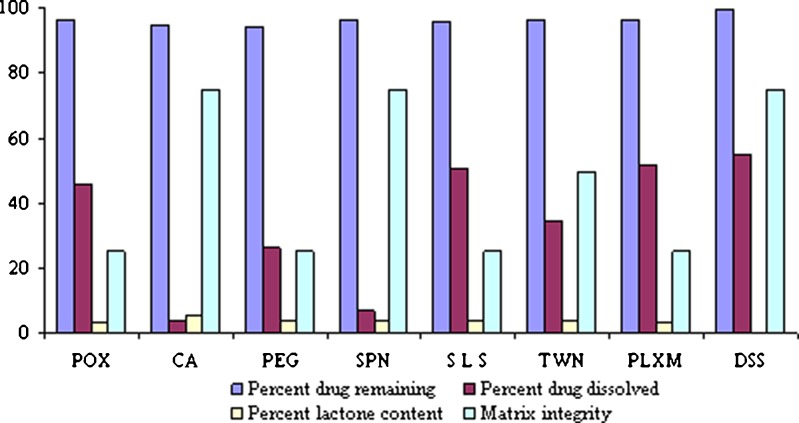
DSS, SLS, and PEO enhanced dissolution of ATC in gastric media, SLS was discarded in further studies since it hampers MI within 1–2 h of dissolution even at low concentrations of 2%. PEO was chosen over poloxamer, as the former has better FLT of 6 s as compared to 1,200 s of poloxamer. In all of the above experimental formulations, it was found that only DSS succeeded in stabilizing the formulation by providing the necessary microenvironment and enough alkalinity of pH > 6 (Table I; Fig. 2). Hence, further optimization studies carried out were with DSS and PEO. DSS is the dioctyl ester of sodium sulfosuccinate. The pure compound is a white waxy solid, soluble in many organic solvents and in water. It is an anionic surface active compound, which has marked wetting characteristics. Docusate sodium provides the necessary microenvironment for ATC to remain stable and prevent degradation from HF to LF on storage; it also helps in the complete dissolution of the drug in acidic media in a span of 8 to 12 h and maintains the stability of the formulation in acidic media by providing enough alkaline conditions for more than 12 h. Stabilized solid oral pharmaceutical formulations of the present study are designed to protect the anti-hypercholesterolemia or anti-hyperlipidemia drug from any degradation or processing environment, as well as preserve it from decomposition during storage and in the acidic environment of the stomach.
Fig. 2.
Effect of solubilizers on physicochemical properties of ATC. POX Polyox, CA citric acid, PEG polyethylene glycol 4000, SPN Span 60, SLS sodium lauryl sulfate, TWN Tween 80, PLXM Poloxamer 407, DSS docusate sodium
Formulation and Optimization of ATC Floating Tablets
Preliminary formulation studies were focused on retaining the formulation in the stomach for 8 to 12 h with sustained drug dissolution rate. The developed floating dosage form consists of HPMC K15M as a polymer matrix, along with sodium bicarbonate as a gas-generating agent. Sodium bicarbonate produces CO2 gas with hydrochloric acid present in dissolution medium. The evolved gas is trapped and retained within the gel (formed by hydration of HPMC K15M), thus lowering density of the tablet and when the tablet density falls below 1 (density of water), the tablet becomes buoyant. Three batches (A1–A3) were prepared using the same amounts of sodium bicarbonate 100 mg/tablet, but different amounts of HPMC K15M, i.e., 50, 100, and 150 mg. At 50 and 100 mg/tablet of HPMC K15M, FLT decreased and MI reduced, but at 150 mg/tablet the FLT increased and MI improved, indicating that a high amount of HPMC K15M is desirable to achieve good MI. Below 150 mg/tablet, HPMC K15M might not give sufficient strength to the matrix to prolong drug release up to 12 h. Therefore, the optimized quantity of HPMC K15M was fixed at 160 mg/tablet, due to this FLT increased. This might be due to the lower amounts of sodium bicarbonate yielding denser tablets. Hence, the quantity of sodium bicarbonate increased from 100 mg/tablet to 200 mg/tablet to further shorten the FLT and prolong the floating duration, below this quantity the tablets showed FLT above 5 min. In vitro dissolution was performed on A1 to A3 formulations; all the tablets ruptured within 3 h except A3. This result might be due to poor strength of tablets or insufficient binding which failed to keep the matrix intact. A3 formulation prepared using HPMC K15M (150 mg/tablet) was found to remain intact for more than 12 h under stirring at 75 rpm in the dissolution studies. It is quite well known that a higher percentage of sodium bicarbonate decreases the FLT, therefore sodium bicarbonate was fixed at 200 mg/tablet to decrease the FLT to less than 5 min. At higher DSS concentration, FLT increased due to the formation of dense compacts during compression, which prevents penetration of water inside the tablet core; hence, to facilitate water penetration inside the tablet core, water wicking agent CCMC was incorporated in the formulation. A 32 factorial design was used to study the effects of selected variables on various responses as shown in Tables II and III, DSS (X1) and PEO(X2) were selected as independent variables and the dependent variable is the percent of drug dissolved (Y1). The physicochemical properties of the tablets are summarized in Table IV. The hardness of the floating tablets adjusted between 5 and 6 kg/cm2; the thickness of all tablet batches ranged from 5.7 ± 0.10 to 6.0 ± 0.10 mm. All the tablet formulae showed acceptable physicochemical properties for weight variation, drug content, and friability. The weight of the tablets ranged from 860 ± 2.93 to 980 ± 1.90 mg.
Table II.
Factorial Design of Selected Composition
| Variables | Levels | ||
|---|---|---|---|
| Upper (+1; mg) | Middle (0; mg) | Lower (−1; mg) | |
| X 1—amount of DSS | 400 | 350 | 300 |
| X 2—amount of PEO | 30 | 20 | 10 |
Table III.
Formulation of Floating Tablets Prepared by 32 Factorial Designs and Their Responses
| Formula code | DSS X 1 | PEO X 2 | Drug dissolved at 8 h (%)a | Matrix integritya |
|---|---|---|---|---|
| F1 | +1 | −1 | 57.4 ± 0.88 | +++ |
| F2 | −1 | −1 | 45.5 ± 0.40 | +++ |
| F3 | 0 | −1 | 46.5 ± 0.48 | +++ |
| F4 | +1 | 0 | 94.1 ± 0.28 | +++ |
| F5 | −1 | 0 | 58.0 ± 0.58 | +++ |
| F6 | 0 | 0 | 72.7 ± 0.56 | +++ |
| F7 | +1 | +1 | 98.0 ± 0.54 | + |
| F8 | −1 | +1 | 59.2 ± 0.64 | +++ |
| F9 | 0 | ±1 | 82.0 ± 0.54 | + |
Amount of other additives, such as, ATC = 80 mg, HPMC K15M = 160 mg, NaHCO3 = 200 mg, CCMC = 80 mg, mannitol = 100 mg, and magnesium stearate = 10 mg were kept constant in all the preparations
a n = 3
Table IV.
Physical Parameters of ATC Floating Tablets Prepared by Factorial Design
| Formula code | Tablet thickness (mm) | Tablet weight (mg) | Floating lag time (s) | Drug content (%) | Tablet f riability (%) | Tablet hardness (kg/cm2) | Total floating duration (h) |
|---|---|---|---|---|---|---|---|
| F1 | 5.9 ± 0.04 | 960 ± 2.71 | 63 ± 6.30 | 99.5 ± 0.88 | 0.05 ± 0.08 | 6 | >12 |
| F2 | 5.7 ± 0.10 | 860 ± 2.93 | 50 ± 5.50 | 97.1 ± 0.54 | 0.07 ± 0.05 | 5.5 | >12 |
| F3 | 5.9 ± 0.05 | 910 ± 3.05 | 55 ± 3.25 | 102.0 ± 0.32 | 0.06 ± 0.04 | 6 | >12 |
| F4 | 6.0 ± 0.05 | 970 ± 2.95 | 56 ± 4.16 | 99.6 ± 0.71 | 0.06 ± 0.07 | 6 | >12 |
| F5 | 5.7 ± 0.05 | 870 ± 2.50 | 42 ± 3.75 | 99.9 ± 0.90 | 0.05 ± 0.04 | 5.5 | >12 |
| F6 | 5.9 ± 0.10 | 920 ± 2.75 | 49 ± 4.33 | 98.1 ± 1.28 | 0.06 ± 0.02 | 6 | >12 |
| F7 | 6.0 ± 0.10 | 980 ± 1.90 | 120 ± 5.30 | 101.3 ± 0.78 | 0.07 ± 0.08 | 6 | >8 |
| F8 | 5.7 ± 0.05 | 880 ± 3.20 | 40 ± 3.78 | 99.3 ± 1.59 | 0.06 ± 0.05 | 5.5 | >8 |
| F9 | 5.9 ± 0.05 | 930 ± 3.05 | 120 ± 5.54 | 100.9 ± 1.13 | 0.05 ± 0.04 | 6 | >8 |
In Vitro Buoyancy Study
The investigated floating tablets was based on gas generation technique, in which sodium bicarbonate used as a gas-generating agent was dispersed in a matrix tablet. The in vitro testing of preliminary batches revealed that most formulae were buoyant for more than 6 h with 40 to 120 s of floating lag time in which sodium bicarbonate was between 15% and 20%, below 15% resulted in increased floating lag time and shorter buoyancy duration and above 20% there was no significant effect on floating behavior. Hence, quantity of sodium bicarbonate was kept constant at 20%, i.e., 200 mg/tab in all the formulations.
Differential Scanning Calorimetry
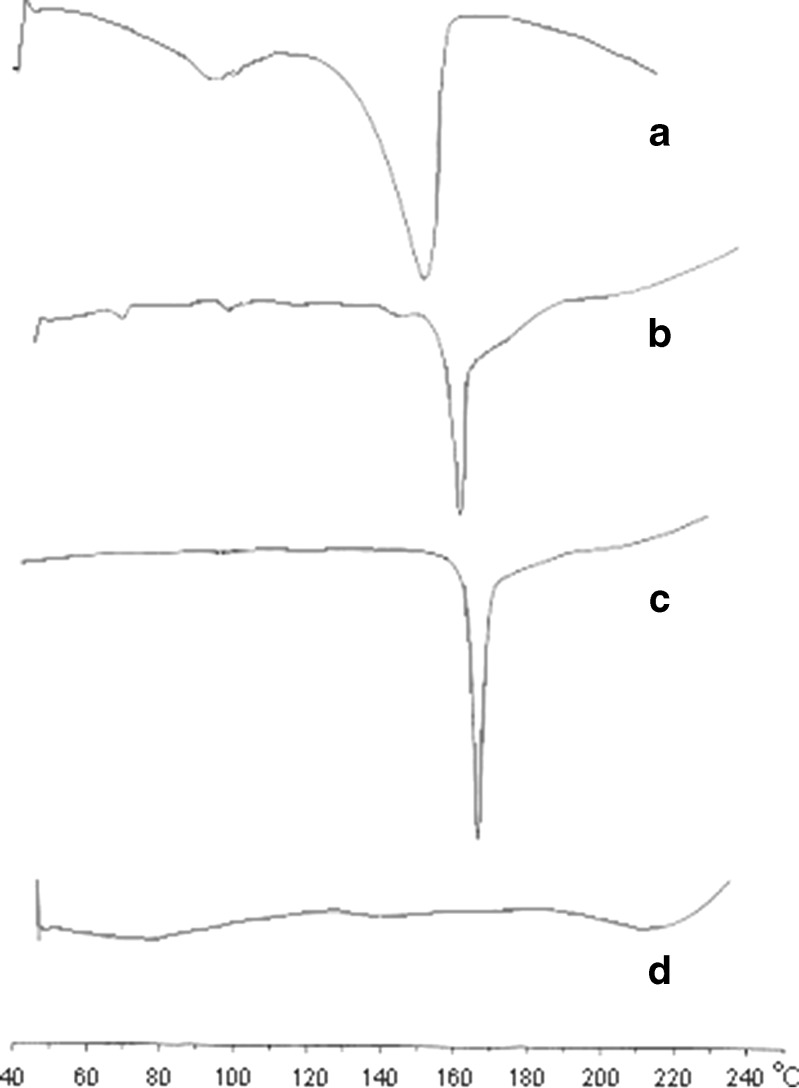
DSC examination conducted for the pure drug, F4 formulation, formulation without DSS and PEO, and placebo without drug. Thermograms of the single component and final formulation are as shown in Fig. 3. In DSC curves, curve A of pure drug gave a broad endotherm ranging from 60°C to 120°C indicating loss of water, followed by a second endotherm of water loss and melting with an onset temperature of 130–140°C and a peak at 158°C, which suggested that the drug is stable crystalline form I (18). Curve B is the F4 formulation which shows the melting transition at 164°C indicates that the drug is still in the stable crystalline form and slight shifting of the peak is may be due to the presence of other excipients. Curve C is the endotherm of F4 formulation without surfactants (DSS and PEO) which shows the peak at 167°C; this suggests that there is no chemical interaction between the excipients used in the formulation and the pure drug. Curve D is the endotherm of placebo.
Fig. 3.
DSC thermograms of a pure drug, b F4 tablet formulation, c F4 tablet formulation without DSS, and d placebo without drug
Powder X-ray Diffraction
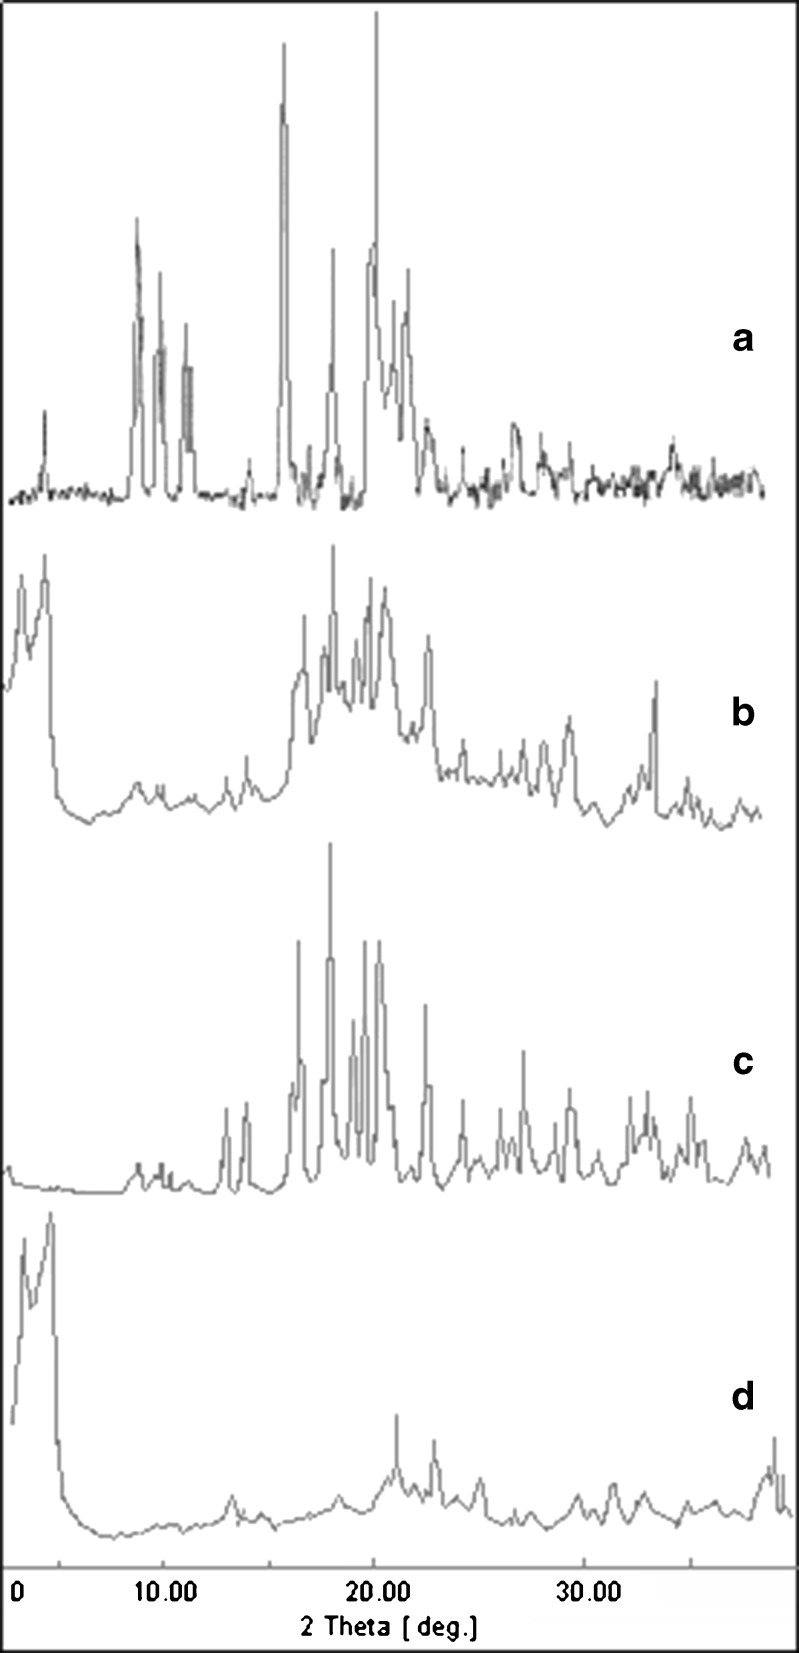
The diffraction pattern and thermograms of pure drug showed characteristic high-intensity diffraction peaks at 8.9, 9.3, 10.0, 10.3, 11.6, 12.0, 16.8, 19.2, 21.3, 22.5, 23.1, and 23.5; distinct peaks found in the diffractogram show that the drug is present in the crystalline form. Whereas, F4 formulation showed reflections at 4.7, 17.1, 18.6, 21.0, and 23.3. During the development stage, two different formulations B and C examined as shown in Fig. 4. The differences between the respective patterns and pattern of the F4 formulation, was observed in the 2θ regions. The pure drug exhibits reflections at 8.9, 9.3, and 10, while B and C exhibits weak reflection at 8.9, 9.3, and 10 two theta (2θ). This decreased intensity of reflection is attributed due to presence of excipients in formulation, which masks completely the 2θ region where the expected reflection peak rise and identification of pure drug presence in the tablet is difficult. The peaks are observed at 3.3 and 4.6 due to surfactants present, as these peaks are absent in C. It is clear that the reflections of pure drug match satisfactorily (within the experimental error) the API reflections in F4 formulation. It can, thus, be concluded that no transformation took place during the manufacturing process and in stability studies of the tablets.
Fig. 4.
Powder X-ray diffractograms of a pure drug, b F4 tablet formulation, c F4 tablet formulation without DSS, and d Placebo without drug
Drug Release Study
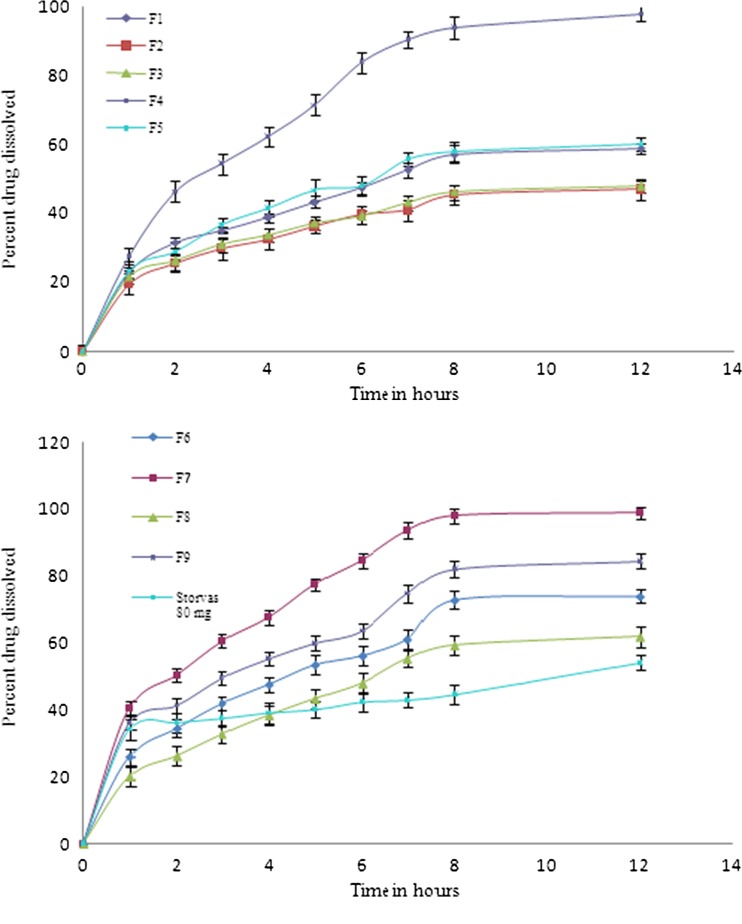
The drug dissolution profile of the batches prepared by factorial design is as shown in Fig. 5. It is clear that all the formulae succeeded in sustaining the rate of drug release for more than 12 h, but other parameters such as FLT and MI was not similar in all the batches, batches F1, F2, and F3 showed low drug dissolution profile with good FLT and MI, F5, F6, F8, and F9 formulations exhibited average dissolution profile and MI. The highest dissolution observed was in F7 formulation with 98.9% and the maximum ATC dissolution of Storvas® 80 mg was 54.07% in 12 h of study with average FLT and MI. Among all the formulations F4 formulation gave best results with respect to drug dissolution 98.2%, FLT 56 ± 4.16 and MI (Table IV).
Fig. 5.
Dissolution profile of factorial batches F1–F9 and reference formulation of Storvas® 80 mg tablet in 0.1 N HCL (dissolution medium)
Drug Release Mechanism
The regression coefficient (R2) values of release data of all formulations obtained by curve fitting method for zero order, first order, Higuchi model, and Hixson Crowell model. Most of the formulations follow the Higuchi and Peppas model. For the best formulation F4, the R2 value of Higuchi is 0.9962 (nearer to 1) which is dominant than the other models which shows that the drug release depended on the square root of the time. The n value of the optimized formulation F4 is 0.57 and of all other formulations is between from 0.36 to 0.57 which shows that the drug release is probably by “combination of swelling, erosion, and diffusion” (19,20).
Multiple Regression Analysis
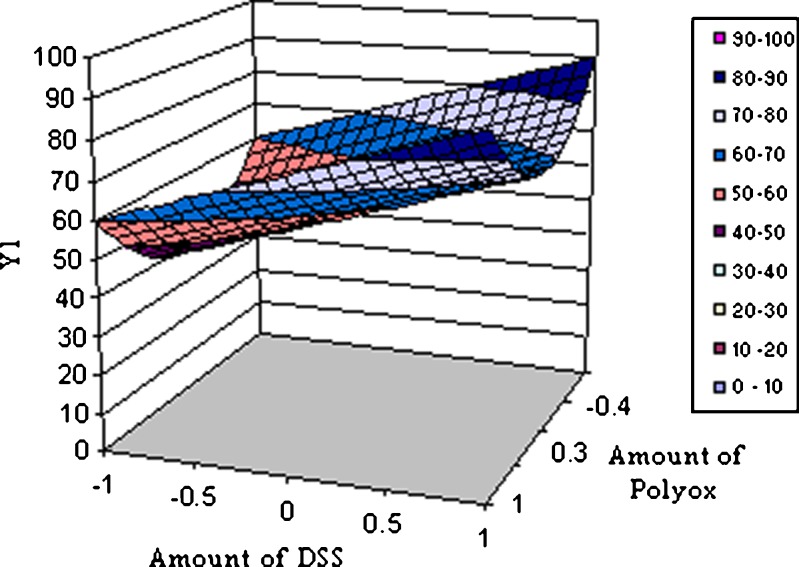
The response obtained from 32 factorial design was subjected to multiple regression analysis. The polynomial equations are given below;
 |
Where Y1 is the dependent variable, B0 is the arithmetic mean response of the nine runs, and B1 is the estimated coefficient for factor X1. The main effects (X1 and X2) represents the average results of changing one factor at a time from its low to high value. The terms X21 and X22 indicate curvilinear relationship. The interaction X1X2 shows how the dependent variable changes when two or more factors are simultaneously changed (21) as given in Table V. The data clearly show that the percent drug dissolved is strongly dependent on the selected independent variables; increased concentration of these variables increases the drug dissolution rate. Multiple regression analysis performed was on Microsoft excel software, statistic and statistically significant terms identified using backward elimination method. The plot showing effect of DSS (X1) and PEO (X2) vs. percent drug release at 8 h is as shown in Fig. 6. The condensed factorial equation for response, percent drug dissolved at 8 h as per the coefficients obtained is as follows:
 |
Table V.
Summary of Results of Regression Analysis
| Response | Coefficient | ||
|---|---|---|---|
| B 0 | B 1 | B 4 | |
| Percent drug release | |||
| At 8 h (Y 1) | 54.290 | 14.9717 | 20.8800 |
| t Calculated | 7.934 | 3.094 | 2.492 |
R 2 = 0.724; t table = 2.45 at alpha of <0.05; two tailed
Fig. 6.
Response surface plot showing effect of DSS (X1) and Polyox (X 2) vs. percent drug release (Y 1) at 8 h
Stability Studies
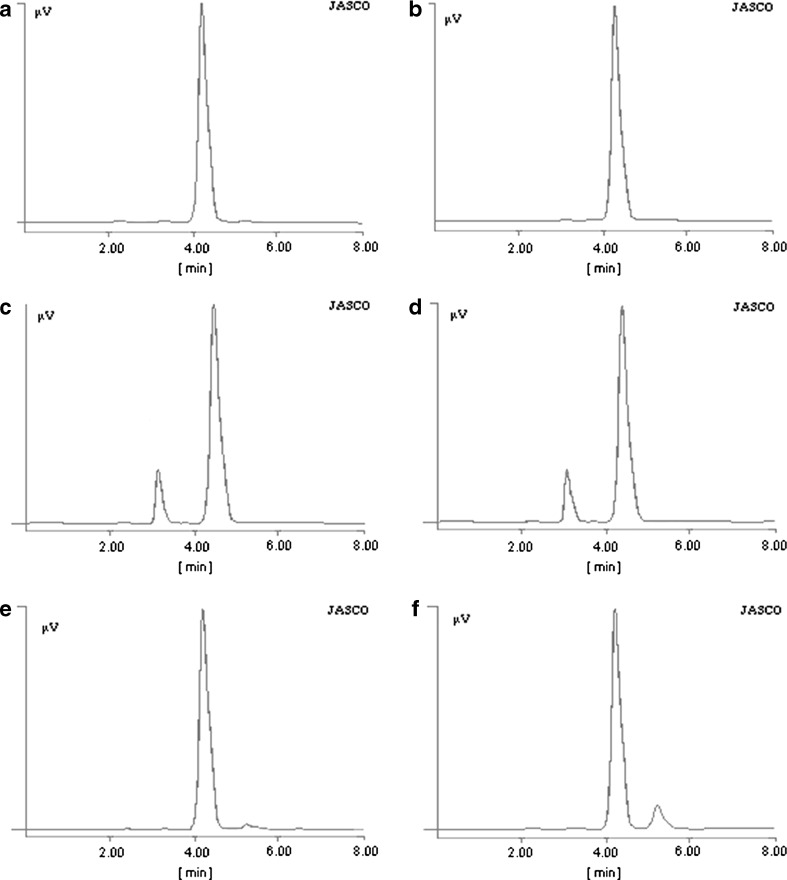
Stability studies conducted on F4 formulation and the reference tablet formulation of Storvas® 80 mg were according to ICH guidelines, and tested for FLT, MI, drug content, tablet friability, and total floating duration as shown in Table VI. The percent LF content determined was by HPLC, depicted in Table VII. The LF peak was absent in the pure drug as well as in F4 formulation after 6 months of stability at all storage conditions. There is no LF formation in the pure drug during the stability studies which indicates that the drug is stable since several degradation products formed are due to the exposure of atorvastatin to the oxidative environment which is usually present during the production process, the storage of the substance, and the pharmaceutical formulation (22). The reference formulation of Storvas® 80 mg tablet shows the same LF content on stability as the F4 formulation without DSS. This confirms that the formulations containing DSS are stable during stability studies under different storage conditions as shown in HPLC chromatograms in Fig. 7.
Table VI.
Physical Parameters of Floating Tablets of F4 Formulation After Stability studiEs for 6 Months
| Storage condition | Floating lag time (s) | Matrix integrity | Drug content (%) | Tablet friability (%) | Total floating duration (h) |
|---|---|---|---|---|---|
| 40 ± 0.5°C/75 ± 5% | 53 ± 4.00 | +++ | 98.5 ± 0.76 | 0.05 ± 0.07 | >10 |
| 30 ± 0.5°C/65 ± 5% | 57 ± 4.35 | +++ | 98.1 ± 0.71 | 0.04 ± 0.06 | >10 |
| 25 ± 0.5°C/60 ± 5% | 53 ± 5.25 | +++ | 99.8 ± 0.65 | 0.05 ± 0.08 | >10 |
| Room temperature | 59 ± 4.90 | +++ | 99.3 ± 0.49 | 0.06 ± 0.08 | >10 |
Table VII.
Percent Lactone Content in Pure Drug and Formulations After 6 Months of Stability
| Formulations at different conditions | Lactone content |
|---|---|
| ATC pure drug before stability studies | Nil |
| ATC pure drug stored at 40 ± 0.5°C/75 ± 5% RH | Nil |
| F4 formulation at 25 ± 0.5°C/60 ± 5% RH | Nil |
| F4 formulation at 40 ± 0.5°C/75 ± 5% RH | Nil |
| F4 formulation without DSS, stored at 25 ± 0.5°C/ 60 ± 5% RH | 2.9% |
| F4 formulation without DSS, stored at 40 ± 0.5°C/ 75 ± 5% RH | 13.0% |
| Storvas® 80 mg tablet stored at 25 ± 0.5°C/ 60 ± 5% RH | 2.4% |
| Storvas® 80 mg tablet stored at 40 ± 0.5°C/ 75 ± 5% RH | 10.0% |
Fig. 7.
HPLC chromatrograms of a ATC pure drug before stability. b ATC pure drug after stability stored at 40 ± 0.5°C/75 ± 5% RH. c F4 tablet stored at 25 ± 0.5°C/60 ± 5% RH. d F4 stored at 40 ± 0.5°C ± 5% RH. e F4 tablets without DSS, stored at 25 ± 0.5°C/60 ± 5% RH. f F4 tablets without DSS, stored at 40 ± 0.5°C/75 ± 5% RH. All the samples were analyzed after 6 months of storage
Pharmacokinetic Parameters of ATC Floating Tablets
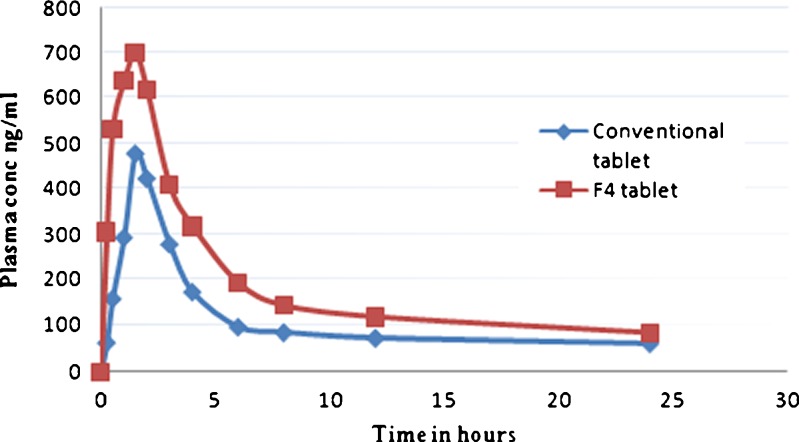
The plasma concentration vs. time profile of F4 formulation and the conventional tablets are as shown in Fig. 8 and Table VIII. F4 formulation is well absorbed due to the complete dissolution in acidic media without degradation of the drug when compared with the conventional tablet as Cmax of F4 formulation is higher than that of conventional tablets (700 ng/ml for F4 tablets and 480 ng/ml for conventional tablets). The pharmacokinetic parameters AUC and Cmax show significant differences between two formulations. There were no significant differences between the formulations for t1/2, tmax. The Cmax and AUC0→24 h of the F4 floating tablet were significantly higher than those of the conventional tablet. The relative bioavailability (Fr) of ATC in F4 formulation was about 1.6-fold compared with the conventional tablet, which might be due to complete solubilization and better absorption of ATC; therefore, ATC floating tablets can increase the oral bioavailability of atorvastatin.
Fig. 8.
The plasma concentration vs. time profile of F4 tablets and the conventional tablets
Table VIII.
Pharmacokinetic Parameters of ATC and Relative Bioavailability of F4 Floating Tablets and Conventional Tablets
| Formulation | t max (h) | C max (ng/ml) | AUC0–24 h (ng h−1 ml−1) | Fr (%) |
|---|---|---|---|---|
| Conventional tablet | 1.57 ± 0.56 | 480 ± 39.22 | 2,734.75 ± 295.67 | 100.00 |
| F4 tablet | 1.52 ± 0.25 | 700 ± 48.82 | 4,596.30 ± 366.94 | 168.00 |
Data are means ± SD; n = 6
CONCLUSIONS
The developed formulations are stable, and there is no degradation of the drug during development process, storage, and stability studies. The developed floating drug delivery system has the potential to advance the oral bioavailability of ATC and might be a suitable alternative to improve its systemic availability.
Acknowledgments
The financial assistance of the “University Grant’s Commission” Delhi, India, towards this research is hereby acknowledged.
Contributor Information
Furquan Nazimuddin Khan, Phone: +91-240-2381129, FAX: +91-240-2381129, Email: furkhankhan@rediffmail.com.
Mohamed Hassan G. Dehghan, Email: mhdehghan@hotmail.com
References
- 1.Kerc J, inventor. Stable Pharmaceutical formulation comprising a HMG CoA reductase inhibitor. US Patent Application, 22 Oct 2009.
- 2.Kerc J, Salobir M, Bavec S, inventors. Atorvastatin calcium in a pharmaceutical form composition thereof and pharmaceutical formulation comprising atorvastatin calcium. US Patent 7030151, 18 April 2006.
- 3.Kearny AS, Crawford LF, Mehta SC, Radebaugh GW. The interconversion kinetics, equilibrium, and solubilities of the lactone and hydroxyacid forms of the HMG-CoA reductase inhibitor, CI-981. Pharm Res. 1993;10:1461–1465. doi: 10.1023/A:1018923325359. [DOI] [PubMed] [Google Scholar]
- 4.Ishigami M, Honda T, Takashi W. A comparison of the effects of 3-hydroxy-3- methylglutaryl-coenzyme A (HMG-CoA) reductase inhibitors on the CYP3A4-dependent oxidation of mexazolam in vitro. Drug Metab Dispos. 2001;29:282–288. [PubMed] [Google Scholar]
- 5.Mills N, Muhammad NA, Weiss J, Nesbitt RU, inventors. Stable oral CI-981 formulation and process for preparing same.US Patent 6126971, 3 Oct 2000.
- 6.Palem CR, Patel S, Pokharkar BV. Solubility and stability enhancement of atorvastatin by cyclodextrin complexation. PDA. J Pharm Sci Technol. 2009;63:217–225. [PubMed] [Google Scholar]
- 7.Laxminarayan J. Stabilized pharmaceutical compositions comprising an HMG-CoA reductase inhibitor. US patent application 20090247603, 01 Oct 2009.
- 8.Hai RS, Ming KZ. Preparation and evaluation of self-micro emulsifying drug delivery systems (SMEDDS) containing atorvastatin. J Pharm Pharmacol. 2006;58:1183–1191. doi: 10.1211/jpp.58.9.0004. [DOI] [PubMed] [Google Scholar]
- 9.Kadu PJ, Kushare SS, Thacker DD, Gattani SG. Enhancement of oral bioavailability of atorvastatin calcium by self-emulsifying drug delivery systems (SEDDS) Pharm Dev Tech. 2011;16:65–74. doi: 10.3109/10837450903499333. [DOI] [PubMed] [Google Scholar]
- 10.Lennernas H. Clinical Pharmacokinetics of atorvastatin. Clin Pharmacokinet. 2003;42:1141–1160. doi: 10.2165/00003088-200342130-00005. [DOI] [PubMed] [Google Scholar]
- 11.Brijesh SD, Avani FA, Madhabhai MP. Gastroretentive drug delivery system of ranitidine hydrochloride: formulation and in vitro evaluation. AAPS PharmSciTech. 2004;5:34. doi: 10.1208/pt050234. [DOI] [PMC free article] [PubMed] [Google Scholar]
- 12.The British Pharmacopoeia . British Pharmacopoeia Commission. London: HMSO; 2007. [Google Scholar]
- 13.Rosa M, Zia H, Rhodes T. Dosing and testing in-vitro of a bioadhesive and floating drug delivery system for oral application. Int J Pharm. 1994;105:64–70. [Google Scholar]
- 14.Kocbek P, Baumgartner S, Kristi J. Preparation and evaluation of nanosuspensions for enhancing dissolution of poorly soluble drugs. Int J Pharm. 2006;312:179–186. doi: 10.1016/j.ijpharm.2006.01.008. [DOI] [PubMed] [Google Scholar]
- 15.Skorda D. Kontoyannis C.G. Identification and quantitative determination of atorvastatin calcium polymorph in tablets using FT-Raman spectroscopy. Talanta. 2008;74:1066–1070. doi: 10.1016/j.talanta.2007.07.030. [DOI] [PubMed] [Google Scholar]
- 16.Mathews BR. Regulatory aspects of stability testing in Europe. Drug Dev Ind Pharm. 1999;25:831–856. doi: 10.1081/DDC-100102245. [DOI] [PubMed] [Google Scholar]
- 17.Parakh SR, Gothoskar AV, Karad MTA. novel method for the study of water absorption rates by swellable matrices. Pharm Tech. 2003;5:40–48. [Google Scholar]
- 18.Shete G, Puri V, Kumar L, Bansal AK. Solid state characterization of commercial crystalline and amorphous atorvastatin calcium samples. AAPS Pharm Sci Tech. 2010;11:598–609. doi: 10.1208/s12249-010-9419-7. [DOI] [PMC free article] [PubMed] [Google Scholar]
- 19.Higuchi T. Mechanism of sustained action medication. J Pharm Sci. 1963;52:1145–1149. doi: 10.1002/jps.2600521210. [DOI] [PubMed] [Google Scholar]
- 20.Ritger PL, Peppas NA. A simple equation for description of solute release. I. Fickian and non-fickian release from non-swellable devices in the form slabs, spheres, cylinder or discs. J Control Release. 1987;5:23–36. doi: 10.1016/0168-3659(87)90034-4. [DOI] [PubMed] [Google Scholar]
- 21.Bolton S. Pharmaceutical statistics, practical and clinical applications. 2. New York: Marcel Dekker; 1990. [Google Scholar]
- 22.Kracuna M, Kocijana A, Bastardaa A, Graheka A, Plavecb J, Kocjanb D. Isolation and structure determination of oxidative degradation products of atorvastatin. J Pharm Biomed Anal. 2009;50:729–736. doi: 10.1016/j.jpba.2009.06.008. [DOI] [PubMed] [Google Scholar]


