Abstract
The present investigation was undertaken with the objective of developing a solid formulation containing nitrendipine nanocrystals for oral delivery. Nitrendipine nanocrystals were prepared using a tandem precipitation–homogenization process. Then, spray drying, a cost-effective method very popular in industrial situations, was employed to convert the nanocrystals into a solid form. The parameters of the preparation process were investigated and optimized. The optimal process was as follows: firstly, nitrendipine/acetone solution (100 mg/ml) was added to a polyvinyl alcohol solution (1 mg/ml) at 10°C, then the pre-suspension was homogenized for 20 cycles at 1,000 bar. Both differential scanning calorimetry and X-ray diffraction analysis indicated that nitrendipine was present in crystalline form. The in vitro dissolution rate of the nanocrystals was significantly increased compared with the physical mixture and commercial tablet. The in vivo testing demonstrated that the Cmax of the nanocrystals was approximately 15-fold and 10-fold greater than that of physical mixture and commercial tablet, respectively. In addition, the AUC0→24 of the nanocrystals was approximately 41-fold and 10-fold greater than that of physical mixture and commercial tablet, respectively.
KEY WORDS: bioavailability, dissolution, nanocrystals, nanotechnology, nitrendipine
INTRODUCTION
It has been estimated that approximately 40% of all new chemical entities fail during development because of poor bioavailability that is often associated with their aqueous insolubility (1). For such biopharmaceutical classification system (BCS) II type compounds, the rate and degree of absorption from the gastrointestinal tract are usually controlled and limited by the dissolution process (2). In recent years, drug nanocrystals have been the subject of much interest due to their novel physical properties, which depend on crystal size (3,4). However, the transformation of a drug powder into drug nanocrystals is an important formulation approach to increase the dissolution rate and saturation solubility and, in turn, to enhance the oral bioavailability of poorly soluble drugs (5,6). Nanocrystal formulations contain much less excipient than other drug nanoparticles, which means a potential reduction in adverse effects caused by these pharmaceutical agents (7). As the total surface area of the particles in a nanocrystal formulation is typically several orders of magnitude greater compared with a conventional formulation, the type and concentration of the stabilizer are the keys to the successful production of a nanocrystal formulation (8). Both polymeric stabilizers and surfactant stabilizers can be used for this purpose (9–11).
The techniques used for preparing nanocrystals can be classified as bottom–up and top–down processes according to differences in the production principles (12,13). The high-pressure homogenization (HPH) method is one of the best-established processes (14–18). It is reported that the diameters of the resulting nanocrystals can be controlled by adjusting the pressure and number of cycles used (19,20). However, the mean particle size in the nanometer range obtained by this procedure mainly depends on the hardness of the drug itself (21,22).
Nitrendipine is a calcium channel blocker used as an antihypertensive drug which is practically insoluble (about 1.9–2.1 μg/ml) in water and has poor oral bioavailability (23). In this study, the precipitation–homogenization process was employed to obtain small and uniform nanocrystals. The spray drying method, a cost-effective method which is very popular in industrial situations, was used to convert the nanocrystals into a solid form. The effects of process parameters on the particle size of the nanocrystals were investigated systematically. Scanning electron microscopy (SEM) was employed to describe the morphology of nitrendipine crystals. The physical properties of the nanocrystals were characterized by X-ray diffraction (XRD) and differential scanning calorimetry (DSC). In vitro and in vivo tests were carried out to compare the dissolution rate and oral bioavailability of the nanocrystals with those of the physical mixture and commercial tablet.
MATERIALS AND METHODS
Materials
Nitrendipine (99% purity) was purchased from Nanjing Pharmaceutical Factory (China). Polyvinyl alcohol (PVA, 05–88) was generously supplied by Shin-Etsu Chemical Ind. Co. Ltd (Japan). Lactose (Tablettose® 70) was a kind gift from MEGGLE Company (Germany). Mannitol was obtained from Bright Moon Seaweed Groups (China). Acetone (analytical grade) was bought from Ruijingte Chemical Agent Company (Tianjing, China). Cyclohexane, isopropyl alcohol, methanol, and acetonitrile (chromatographic grade) were purchased from Concord Chemical Agent Company (China).
Preparation of Nitrendipine Nanocrystals
Nitrendipine nanocrystals were prepared using a tandem precipitation–homogenization process. Briefly, nitrendipine was dissolved in acetone and then the solution was transferred to a PVA solution at a fixed temperature. The pre-suspension was homogenized using a high-pressure, piston-gap homogenizer (ATS AH100D) under preselected conditions.
Particle Size Evaluation
Laser diffraction (LD) (Coulter_LS 230, Beckmann–Coulter Electronics, Krefeld, Germany) with polarization intensity differential scattering was applied to investigate the particle size. The LD data obtained were evaluated using the volume distribution as the particle size and the span values. The particle size gives the average particle diameter, while the span value is a statistical parameter used to evaluate the particle size distribution and calculated using the following equation:
 |
where D10, D50, and D90 represent the particle diameters at 10%, 50%, and 90% of the volume distribution.
The lower the span, the narrower is the particle size distribution.
Morphology of Nitrendipine Crystals
The samples were dispersed on top of double-sided sticky carbon tape on metal disks and coated with a thin layer of gold. SEM (Hitachi S-4800, Japan) was used to describe the morphology of the nitrendipine crystals.
Conversion of the Nanocrystals into a Solid Form
During the spray-drying process, different amount of lactose or mannitol was used as carriers. The carriers were dissolved in stabilizer solutions before precipitation. The obtained nanocrystals were spray-dried using an SD-1000 spray-drier (EYELA, TOKYO, Japan). The following standard operating conditions were used for spray drying: an inlet temperature of 120°C, a drying air flow rate of 0.6 m3/min, a solution feed rate of 7.2 ml/min, and an atomizing air pressure of 19 kPa. Under these conditions, an outlet temperature from 75°C to 80°C was produced. The obtained powders were transferred to an aluminum package protected from light.
The lyophilized preparation without carrier was also prepared as a control in this work. Four milliliters of the nanocrystals were placed in 10-ml glass flask, then rapidly frozen in liquid nitrogen and freeze dried for 24 h to yield dry sample.
Differential Scanning Calorimetry Analysis
DSC analysis was performed using a TA-60WS Thermal Analyzer (Shimadzu, Japan) in a dry nitrogen atmosphere. Al2O3 was used as a reference, and the heating curves were recorded at a scan rate of 10°C/min from 30°C to 300°C.
X-Ray Diffraction Measurements
The samples were analyzed using an X-ray Diffractometer (DX-2700, China) with Cu–Kα radiation at a wavelength of 1.542 Å, generated at 30 mA, and 40 kV. Samples were analyzed in the 2θ range from 5° to 50° using a step size of 0.02°.
In Vitro Dissolution
In vitro dissolution studies were carried out in a RCZ-6B drug dissolution apparatus (Huanghai Medicament Test Factory, Shanghai, China) using the paddle method in the Chinese Pharmacopoeia 2010. The dissolution medium consisted of 70% HCl (0.1 mol/L) and 30% ethanol (v/v). The temperature was maintained at 37 ± 0.5°C, and the rotation speed of the paddle was 100 rpm. A commercial nitrendipine tablet (Tianjin pacific Pharmaceutical Co. Ltd) was used as the reference preparation. Accurately weighed samples containing the equivalent of 5 mg nitrendipine were added to the dissolution medium (900 ml). Samples of approximately 5 ml were taken from the dissolution medium at predetermined time points and passed through a 0.1-μm syringe filter (Shanghai Huan’ao Trading Company, China). The filtrates were analyzed in a UV spectrophotometer (Mode 752, Shanghai the Third Analytical Instrument Plant, China) at 236 nm. Sink conditions were maintained throughout the dissolution testing period. All dissolution experiments were performed in triplicate, and all sample analyses were carried out in triplicate.
In Vivo Bioavailability in Rats
Male Wistar rats were supplied by the Experimental Animal Center of Shenyang Pharmaceutical University (Shenyang, China), and the animal experiment protocol was evaluated and approved by the Animal Ethics Committee, Shenyang Pharmaceutical University. Fifteen male Wistar rats weighting 210 ± 10 g were fasted overnight with free access to water. The animals were then divided into three groups, with five rats in each group. Nitrendipine nanocrystals, physical mixture, and the commercial tablet (Tianjin pacific Pharmaceutical Co. Ltd) were administered orally at a dose of 200 mg/kg.
Blood samples (0.3 ml) were collected by retro-orbital puncture at 0.25, 0.5, 0.75, 1, 1.5, 2, 4, 6, 8, 10, 12, and 24 h. The blood samples were centrifuged (10,000 rpm, 5 min) and plasma was collected. Nimodipine was employed as the internal standard. Plasma samples (100 μl) were vortexed and extracted with 0.5 ml mixed organic solvent (cyclohexane/isopropyl alcohol = 50:2, v/v) on a vortex mixer (XW-80A, Shanghai, China) for 5 min. After centrifugation at 10,000 rpm for 5 min, the organic layer was transferred to another clean tube and evaporated under a stream of nitrogen gas. All the samples were then stored at −20°C until analysis.
Nitrendipine was determined by HPLC (Hitachi L7110 pump equipped with an L7420 UV–VIS detector, Japan). The separation was carried out on a Diamonsil™ C18 column (5 μm, 200 × 4.6 mm) and the mobile phase was composed of a mixture of methanol, acetonitrile and water (50:25:25, v/v/v). The flow rate was 1.2 ml/min, and the UV detector was set at 236 nm. Each sample was redissolved in 30 μl mobile phase, and 20 μl samples were subjected to HPLC analysis.
Standard pharmacokinetic (PK) parameters (mean ± SD) of nitrendipine were derived from plasma concentration versus time profiles using a non-compartmental model with WinNonlin® Professional Version 3.1 software (Pharsight Corp., Mountain View, CA). The PK parameters that were calculated included the maximum peak concentration of the drug in plasma (Cmax), the time to reach this maximum concentration (Tmax), the area under the curve (AUC0→24), the elimination rate constant (Lambda_z), and the relative bioavailability (F). The relative bioavailability was compared with that of the commercial tablet. All results were presented as mean ± SD values, and Student’s t tests and ANOVA were performed to determine the significance of any differences.
RESULTS AND DISCUSSION
Effect of the Preparation Process on the Particle Size
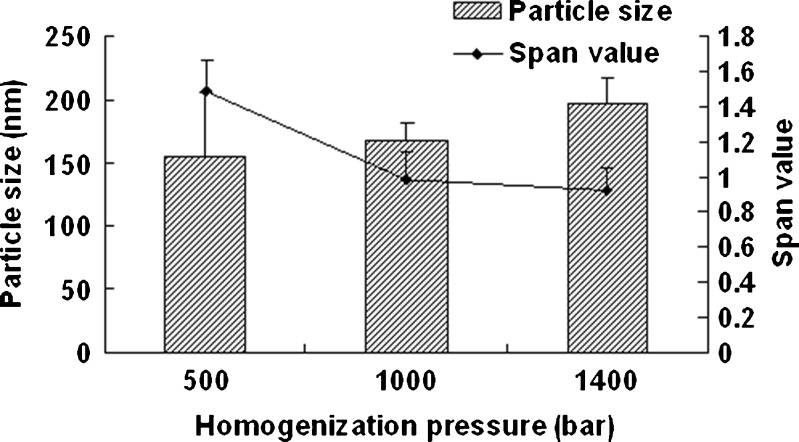
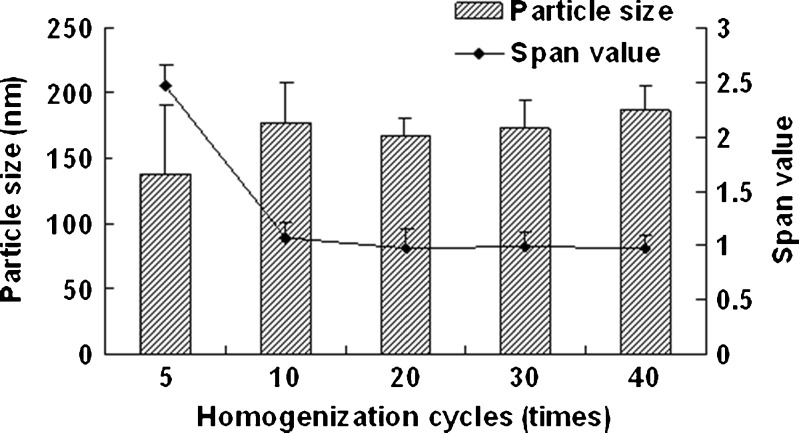
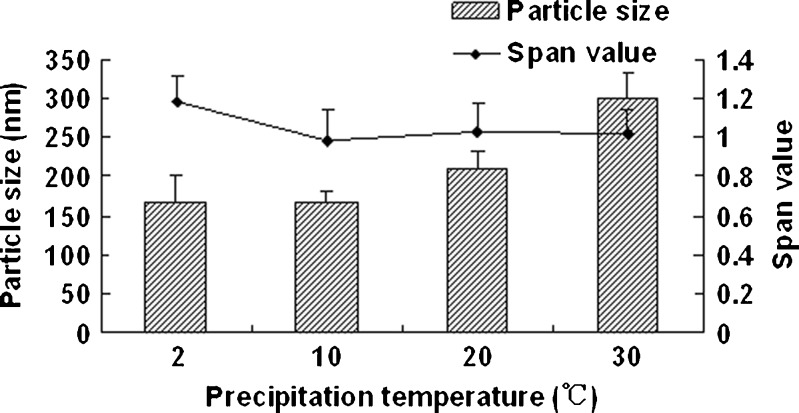
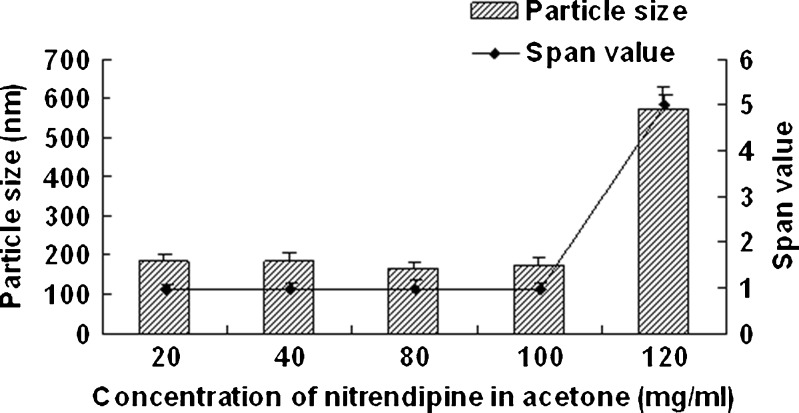
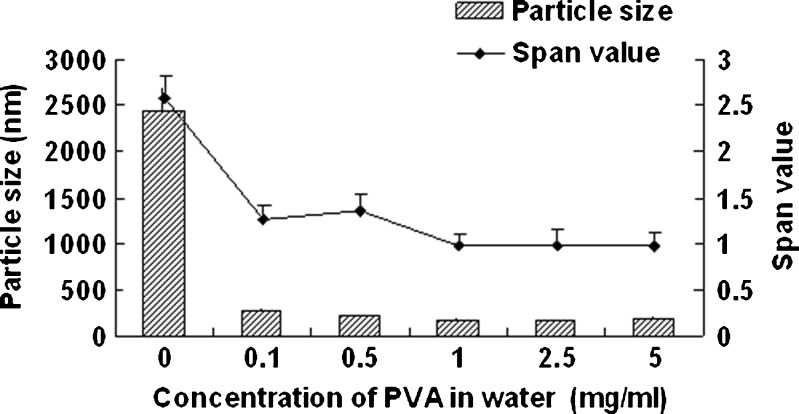
Figure 1 shows the effect of homogenization pressure on the particle size and span values of the nanocrystals. The particle size of the nanocrystals increased as the homogenization pressure increased while the other process parameters remained constant. But the span values decreased with the increasing homogenization pressure; 1,000 bar was found to be a suitable pressure as the obtained nanocrystals was relatively smaller and uniform. According to Fig. 2, the particle size increased slightly with the increasing homogenization cycle number. The span values firstly decreased significantly and then keeps invariantly as the homogenization cycle number increased. A smaller particle size with a lower span value was obtained when the presuspension was homogenized for 20 cycles at 1,000 bar. It is assumed that the HPH process after precipitation promoted an annealing effect and helped induce the absorption of stabilizer onto nanocrystals (24), which means the precipitation process will affect the final nanocrystals significantly. According to Fig. 3, both of the particle size and the span values of the nanocrystals increased with the increasing precipitation temperature, when the precipitation temperature was higher than 10°C. This was believed to be caused by the rapid growth of crystals at a high temperature (25). According to Fig. 4, the particle size and the span values of the nanocrystals increased significantly when the concentration of nitrendipine in acetone reached 120 mg/ml. It has been reported that the induction period for nucleation tended to decrease with an increase in the concentration of solute (26). This caused the precipitation of nitrendipine from the system before it became uniform, and led to non-uniform crystallization, when the concentration of nitrendipine was too high. As illustrated in Fig. 5, the crystals grew up rapidly during the HPH process after precipitation without PVA, and PVA had a potent crystallization inhibition effect when the concentration of PVA in water was above 1 mg/ml. Using the single factor method, the optimal process parameters were obtained: the drug concentration in acetone was 100 mg/ml, the PVA concentration in water was 1 mg/ml, precipitation temperature was set at 10°C, and the presuspension was homogenized for 20 cycles at 1,000 bar. The mean particle size of the six batches of nanocrystals was 175 ± 13 nm with a span value of 0.9766 ± 0.1658.
Fig. 1.
Particle size and span values of nitrendipine nanocrystals as a function of homogenization pressure. PVA (2.5 mg/ml) was used as stabilizer, and the precipitation temperature was 10°C (mean ± SD, n = 3)
Fig. 2.
Particle size and span values of nitrendipine nanocrystals as a function of homogenization cycles. PVA (2.5 mg/ml) was used as stabilizer, and the precipitation temperature was 10°C (mean ± SD, n = 3)
Fig. 3.
Particle size and span values of nitrendipine nanocrystals as a function of precipitation temperature. PVA (2.5 mg/ml) was used as stabilizer and homogenized for 20 cycles at 1,000 bar (mean ± SD, n = 3)
Fig. 4.
Particle size and span values of nitrendipine nanocrystals as a function of the concentration of nitrendipine in acetone. PVA (2.5 mg/ml) was used as stabilizer and homogenized for 20 cycles at 1,000 bar (mean ± SD, n = 3)
Fig. 5.
Particle size and span values of nitrendipine nanocrystals as a function of the concentration of PVA in water. The concentration of nitrendipine in acetone was 100 mg/ml and homogenized for 20 cycles at 1,000 bar (mean ± SD, n = 3)
Morphology of Nitrendipine Crystals
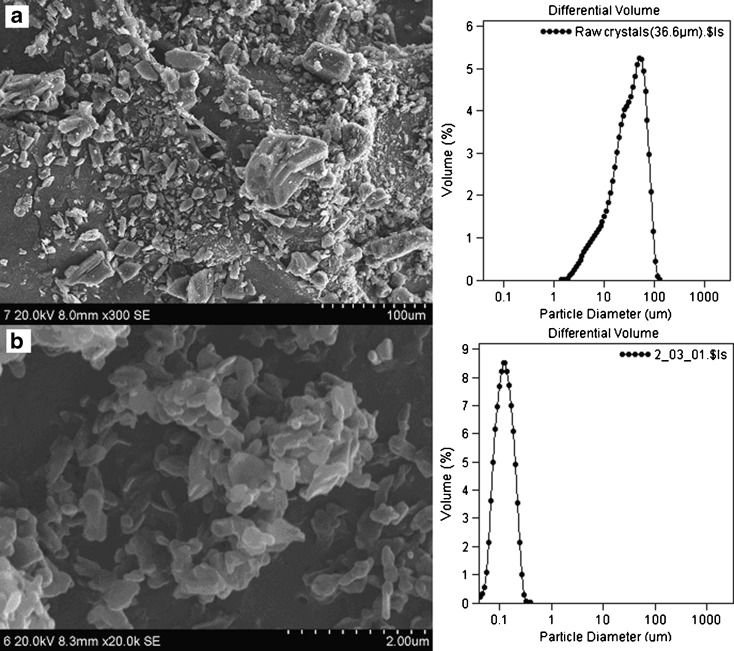
The SEM images and particle size distributions of the nitrendipine coarse powder (a) and the nanocrystals (b) are presented in Fig. 6. The coarse powder was irregular in shape with a broad particle size distribution. In contrast, the nanocrystals were found to be flaky in shape with a narrow particle size distribution.
Fig. 6.
SEM images and particle size distributions of the nitrendipine coarse powder a and nanocrystals b
Scale-Up and Conversion of the Nitrendipine Nanocrystals into Solid Form
The spray-drying process is critical, because it ensures that the obtained dry powders can be re-dispersed as separated nanocrystals that do not aggregate, to prevent a loss of their special properties (27,28). The dry powders were re-constituted in water and the particle size was measured. According to Table I, the scale-up from 20 to 300 ml was successful, and the addition of the carriers (lactose or mannitol) did not influence the particle size of the nanocrystals. The obtained dry powders could be easily re-dispersed without aggregation or agglomeration, and the particle size was similar to that before spray drying. But the addition of the carriers showed a great influence on the flowability of the dry powders. Formulation G was selected for the further study as it showed better flowability.
Table I.
The Effect of Carriers and the Spray-Drying Process on the Particle Size and Angle of Repose of Nitrendipine Nanocrystals (Mean ± SD)
| Formulation | Volume | Carrier | Particle size (nm) | Angle of repose (o) | |
|---|---|---|---|---|---|
| Before spray drying | After re-dispersion | ||||
| A | 20 ml | – | 168 ± 12.90a | – | – |
| B | 300 ml | Lactose (0.3%) | 163 ± 14.30a | 186 ± 16.21a | 53.95 ± 1.91b |
| C | 300 ml | Lactose (0.7%) | 185 ± 15.16a | 175 ± 15.86a | 50.92 ± 1.01b |
| D | 300 ml | Lactose (1.7%) | 174 ± 14.43a | 171 ± 16.12a | 48.92 ± 0.51b |
| E | 300 ml | Mannitol (0.3%) | 184 ± 15.67a | 185 ± 16.32a | 54.79 ± 1.24b |
| F | 300 ml | Mannitol (0.7%) | 170 ± 14.53a | 191 ± 17.21a | 49.27 ± 0.60b |
| G | 300 ml | Mannitol (1.7%) | 164 ± 13.31a | 178 ± 16.56a | 46.23 ± 0.05b |
a n = 3
b n = 6
Lyophilization is a popular method to convert nanocrystals into a solid form due to the better stability of nanocrystals at a low temperature (29–31). In our study, the spray-drying process, which is cost-effective and simple to scale up for industrial production, was found to be acceptable for conversion of the nanocrystals into dry powders.
Differential Scanning Calorimetry Analysis
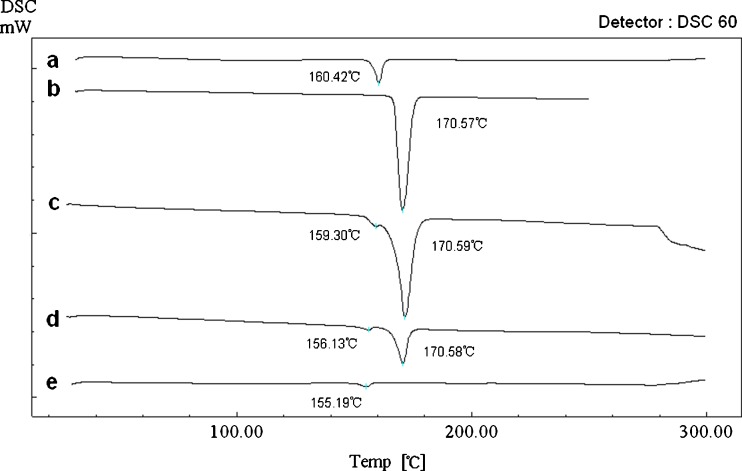
Figure 7 shows the DSC results of the nitrendipine coarse powder (a), the blank excipients (b), the physical mixture (c), the dry powders (d), and the freeze dried nanocrystals without mannitol (e). The coarse powder exhibited a sharp endothermic peak at 160.42°C indicating the melting point. The blank excipients showed a sharp endothermic peak at 170.57°C indicating the melting point of mannitol. In the thermograms of the physical mixture, the endothermic peak of nitrendipine drifted 1.12°C to the left, and this might be due to mixing with the excipients. In the thermograms of the dry powders and the freeze-dried nanocrystals (without mannitol), the endothermic peaks at 156.13°C and 155.19°C, ascribed to the melting of nitrendipine, indicated that nitrendipine was present in crystalline form. However, the endothermic peak of nitrendipine drifted about 4°C and 5°C to the left, perhaps due to size reduction of the crystals (32,33). No glass transition region of nitrendipine was observed in the thermograms of the dry powder and the freeze-dried nanocrystals (without mannitol), which also indicated that nitrendipine still remain a crystalline state instead of an amorphous state in the samples (34).
Fig. 7.
Differential scanning calorimetry curves of the nitrendipine coarse powder a, the blank excipients b, the physical mixture c, the dry powders d, and the freeze-dried nanocrystals without mannitol e
X-Ray Diffraction Measurements
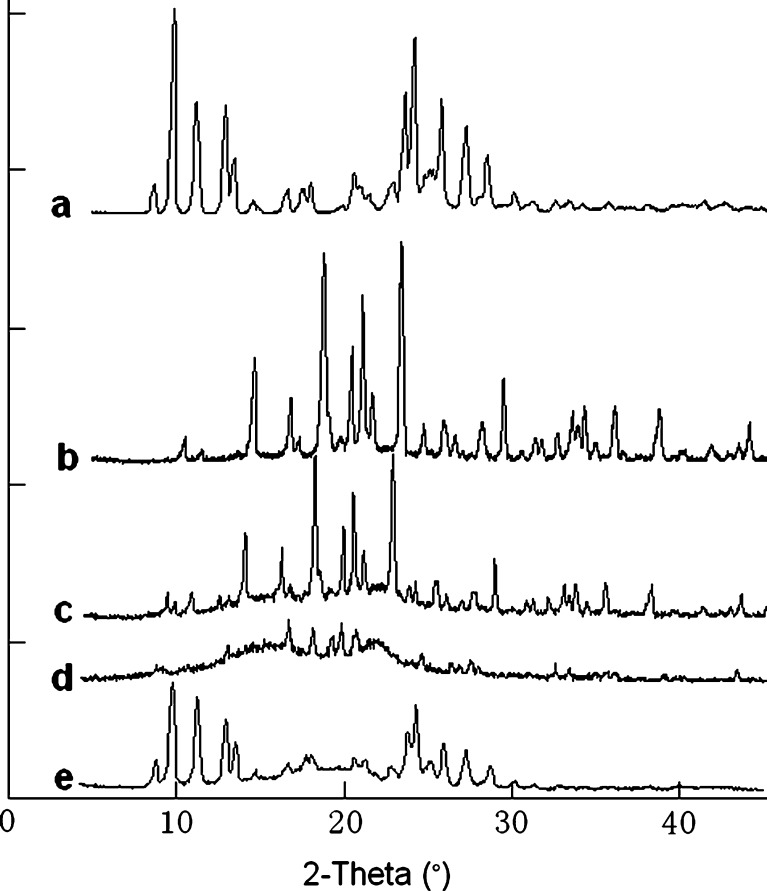
Figure 8 shows the XRD patterns of the nitrendipine coarse powder (a), the blank excipients (b), the physical mixture (c), the dry powders (d), and the freeze-dried nanocrystals without mannitol (e). The results of the XRD investigations were similar to those of the DSC analysis. The XRD pattern of the coarse powder showed characteristic high-energy diffraction peaks at 2θ values between 8°and 30°, indicating the crystalline structure of nitrendipine. The mannitol showed high-energy diffraction peaks at 2θ values between 9° and 45° that masked the characteristic diffraction peaks of nitrendipine in the physical mixture and in the dry powders. The freeze-dried nanocrystals (without mannitol) showed a similar XRD pattern to that of the coarse powder, indicating that the initial crystalline state had been maintained during the precipitation process and the HPH process.
Fig. 8.
X-ray diffraction patterns of the nitrendipine coarse powder a, the blank excipients (b, the physical mixture c, the dry powders d, and the freeze-dried nanocrystals without mannitol e
In Vitro Dissolution
The particle size of the nanocrystals was found to remain constant with good re-dispersability over the 1-year storage period under ambient conditions (data not show). This may be because the nanocrystals were fixed inside the mannitol matrix with the nanocrystals kept at a distance from each other, thus preventing nanocrystals aggregation and/or crystal growth. This promising result encouraged us to perform further in vitro and in vivo studies.
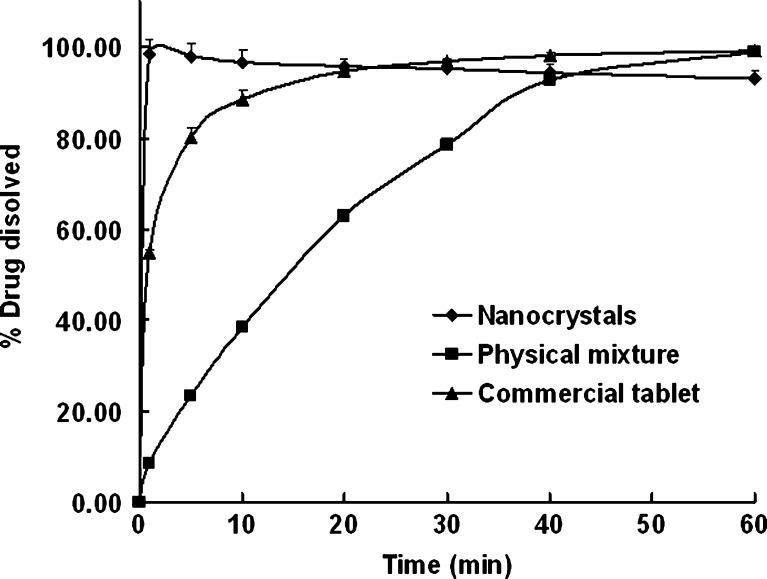
The in vitro dissolution profiles are shown in Fig. 9. The nanocrystals significantly improved the dissolution rate of nitrendipine. Nearly 100% of the drug dissolved from the nanocrystals within 1 min, as opposed to only 9% for the physical mixture and 55% for the commercial tablet. Nearly 40% of the nitrendipine in the physical mixture and 90% of the nitrendipine in the commercial tablet dissolved within 10 min. The fact that the simple mixture of the components did not improve the dissolution of the drug suggested that the enhancement in the nanocrystals was not correlated with solubilization or to a wetting effect of the additives (PVA and mannitol) on the drug.
Fig. 9.
Percentage of dissolved nitrendipine from the nanocrystals, the physical mixture, and the commercial tablet (mean ± SD, n = 3)
According to the Nernst–Brunner/Noyes–Whitney equation (35), the dissolution rate is proportional to the surface area available for dissolution. A reduction in the particle size will increase the effective particle surface area, thus increasing the dissolution rate. Furthermore, the diffusion layer thickness will also be reduced with a decrease in particle size, thus resulting in an even faster dissolution rate (36). In addition, an increase in the saturation solubility of nanocrystals is also expected (37), which will lead to a further increase in the dissolution rate.
The results indicated that transformation of the drug powder into dry powders containing nanocrystals is a useful method for formulating a solid dosage form with a higher nitrendipine dissolution rate.
In Vivo Bioavailability in Rats
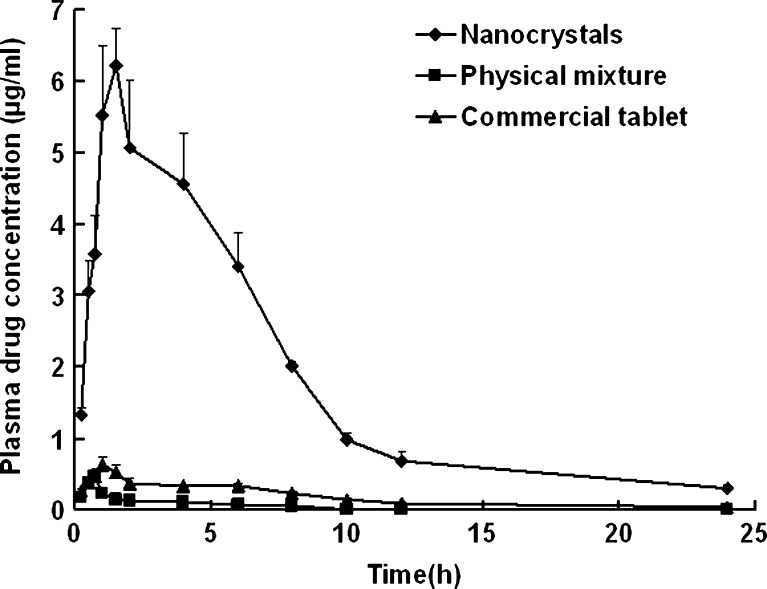
The plasma drug concentration versus time profiles and pharmacokinetic parameters of nitrendipine are presented in Fig. 10 and Table II, respectively. The plasma drug concentration profile of the nanocrystals represents significant improvement in drug absorption compared with the physical mixture and the commercial tablet. The Cmax of the nanocrystals was approximately 15-fold and 10-fold greater than that of physical mixture and commercial tablet (p < 0.01), respectively. Also, the AUC0→24 of the nanocrystals was approximately 41-fold and 10-fold greater than that of the physical mixture and the commercial tablet (p < 0.01), respectively. The elimination rate constant (Lambda_z) showed no statistically significant difference among the three formulations. The relative bioavailability of the nanocrystals and the physical mixture, compared with that of the commercial tablet, were 1018.98% and 24.57%, respectively.
Fig. 10.
Average plasma drug concentration versus time profiles after oral administration of the nanocrystals, the physical mixture, and the commercial tablet (mean ± SD, n = 5)
Table II.
Pharmacokinetic Parameters of the Nitrendipine Nanocrystals, the Physical Mixture and the Commercial Tablet in Rats (Mean ± S.D., n = 5)
| Formulation | Nanocrystals | Physical mixture | Commercial tablet |
|---|---|---|---|
| C max (μg/ml) | 6.22 ± 0.52a | 0.47 ± 0.11 | 0.62 ± 0.11 |
| t max (h) | 1.5 ± 0.0 | 0.7 ± 0.1 | 1.0 ± 0.0 |
| AUC0–24 (μg·h/ml) | 41.88 ± 3.74a | 1.01 ± 0.05a | 4.11 ± 0.40 |
| Lambda_z | 0.106 ± 0.026 | 0.116 ± 0.056 | 0.103 ± 0.026 |
| F | 1018.98%b | 24.57% | – |
a Statistically significant compared with the commercial tablet (p < 0.01)
b Statistically significant compared with the physical mixture (p < 0.01)
Nitrendipine is a BCS Class II substance (poorly soluble and highly permeable), which means dissolution is the rate-limiting factor for absorption (38). The increased oral bioavailability of the nanocrystals could be explained by the significantly improved dissolution rate, which could retain the drug in the soluble form during the gastrointestinal dilution and permeation processes.
CONCLUSION
This study provides a case study for developing a solid formulation containing nanocrystals of a poorly soluble drug. The nanocrystals could be re-dispersed completely in water and provided superior particle size stability. It has been shown that the solid formulation is very successful with regard to the dissolution rate enhancement and greatly increased bioavailability. A tandem precipitation–homogenization process was shown to be simple and suitable for large-scale manufacture. In addition, the spray-drying method was found to be suitable for conversion of the nanocrystals into solid form.
ACKNOWLEDGEMENTS
The authors are grateful for financial support from the National Natural Science Foundation (No.30873182) and National Basic Research Program of China (973 Program) (No.2009CB930302).
REFERENCES
- 1.Prentis RA, Lis Y, Walker SR. Pharmaceutical innovation by the seven UK-owned pharmaceutical companies (1964–1985) Br J Clin Pharmacol. 1988;25(3):387–396. doi: 10.1111/j.1365-2125.1988.tb03318.x. [DOI] [PMC free article] [PubMed] [Google Scholar]
- 2.Amidon GL, Lennernas H, Shah VP, Crison JR. A theoretical basis for a biopharmaceutic drug classification: the correlation of in vitro drug product dissolution and in vivo bioavailability. Pharm Res. 1995;12(3):413–420. doi: 10.1023/A:1016212804288. [DOI] [PubMed] [Google Scholar]
- 3.Date AA, Patravale VB. Current strategies for engineering drug nanoparticles. Curr Opin Colloid Interface Sci. 2004;9:222–235. doi: 10.1016/j.cocis.2004.06.009. [DOI] [Google Scholar]
- 4.Gao L, Zhang D, Chen M, Duan C, Dai W, Jia L, et al. Studies on pharmacokinetics and tissue distribution of oridonin nanosuspensions. Int J Pharm. 2008;355(1–2):321–327. doi: 10.1016/j.ijpharm.2007.12.016. [DOI] [PubMed] [Google Scholar]
- 5.Rabinow BE. Nanosuspensions in drug delivery. Nat Rev Drug Discov. 2004;3(9):785–796. doi: 10.1038/nrd1494. [DOI] [PubMed] [Google Scholar]
- 6.Patravale VB, Date AA, Kulkarni RM. Nanosuspensions: a promising drug delivery strategy. J Pharm Pharmacol. 2004;56(7):827–840. doi: 10.1211/0022357023691. [DOI] [PubMed] [Google Scholar]
- 7.Kipp JE. The role of solid nanoparticle technology in the parenteral delivery of poorly water-soluble drugs. Int J Pharm. 2004;284(1–2):109–122. doi: 10.1016/j.ijpharm.2004.07.019. [DOI] [PubMed] [Google Scholar]
- 8.Van Eerdenbrugh B, Vermant J, Martens JA, Froyen L, Van Humbeeck J, Augustijns P, et al. A screening study of surface stabilization during the production of drug nanocrystals. J Pharm Sci. 2009;98(6):2091–2103. doi: 10.1002/jps.21563. [DOI] [PubMed] [Google Scholar]
- 9.Pardeike J, Muller RH. Nanosuspensions: a promising formulation for the new phospholipase A2 inhibitor PX-18. Int J Pharm. 2010;391(1–2):322–329. doi: 10.1016/j.ijpharm.2010.03.002. [DOI] [PubMed] [Google Scholar]
- 10.Verma S, Huey BD, Burgess DJ. Scanning probe microscopy method for nanosuspension stabilizer selection. Langmuir. 2009;25(21):12481–12487. doi: 10.1021/la9016432. [DOI] [PubMed] [Google Scholar]
- 11.Li X, Gu L, Xu Y, Wang Y. Preparation of fenofibrate nanosuspension and study of its pharmacokinetic behavior in rats. Drug Dev Ind Pharm. 2009;35(7):827–833. doi: 10.1080/03639040802623941. [DOI] [PubMed] [Google Scholar]
- 12.Verma S, Gokhale R, Burgess DJ. A comparative study of top-down and bottom-up approaches for the preparation of micro/nanosuspensions. Int J Pharm. 2009;380(1–2):216–222. doi: 10.1016/j.ijpharm.2009.07.005. [DOI] [PubMed] [Google Scholar]
- 13.Shegokar R, Muller RH. Nanocrystals: industrially feasible multifunctional formulation technology for poorly soluble actives. Int J Pharm. 2010;399(1–2):129–139. doi: 10.1016/j.ijpharm.2010.07.044. [DOI] [PubMed] [Google Scholar]
- 14.Jacobs C, Muller RH. Production and characterization of a budesonide nanosuspension for pulmonary administration. Pharm Res. 2002;19(2):189–194. doi: 10.1023/A:1014276917363. [DOI] [PubMed] [Google Scholar]
- 15.Moschwitzer J, Achleitner G, Pomper H, Muller RH. Development of an intravenously injectable chemically stable aqueous omeprazole formulation using nanosuspension technology. Eur J Pharm Biopharm. 2004;58(3):615–619. doi: 10.1016/j.ejpb.2004.03.022. [DOI] [PubMed] [Google Scholar]
- 16.Xiong R, Lu W, Li J, Wang P, Xu R, Chen T. Preparation and characterization of intravenously injectable nimodipine nanosuspension. Int J Pharm. 2008;350(1–2):338–343. doi: 10.1016/j.ijpharm.2007.08.036. [DOI] [PubMed] [Google Scholar]
- 17.Krause KP, Kayser O, Mader K, Gust R, Muller RH. Heavy metal contamination of nanosuspensions produced by high-pressure homogenisation. Int J Pharm. 2000;196(2):169–172. doi: 10.1016/S0378-5173(99)00414-7. [DOI] [PubMed] [Google Scholar]
- 18.Kassem MA, Abdel Rahman AA, Ghorab MM, Ahmed MB, Khalil RM. Nanosuspension as an ophthalmic delivery system for certain glucocorticoid drugs. Int J Pharm. 2007;340(1–2):126–133. doi: 10.1016/j.ijpharm.2007.03.011. [DOI] [PubMed] [Google Scholar]
- 19.Keck CM, Muller RH. Drug nanocrystals of poorly soluble drugs produced by high pressure homogenisation. Eur J Pharm Biopharm. 2006;62(1):3–16. doi: 10.1016/j.ejpb.2005.05.009. [DOI] [PubMed] [Google Scholar]
- 20.Mishra PR, Al Shaal L, Muller RH, Keck CM. Production and characterization of Hesperetin nanosuspensions for dermal delivery. Int J Pharm. 2009;371(1–2):182–189. doi: 10.1016/j.ijpharm.2008.12.030. [DOI] [PubMed] [Google Scholar]
- 21.Muller RH, Jacobs C, Kayser O. Nanosuspensions as particulate drug formulations in therapy. Rationale for development and what we can expect for the future. Adv Drug Deliv Rev. 2001;47(1):3–19. doi: 10.1016/S0169-409X(00)00118-6. [DOI] [PubMed] [Google Scholar]
- 22.Muller RH, Peters K. Nanosuspensions for the formulation of poorly soluble drugs I. Preparation by a size-reduction technique. Int J Pharm. 1998;160:229–237. doi: 10.1016/S0378-5173(97)00311-6. [DOI] [Google Scholar]
- 23.Wang L, Cui FD, Sunada H. Preparation and evaluation of solid dispersions of nitrendipine prepared with fine silica particles using the melt-mixing method. Chem Pharm Bull. 2006;54(1):37–43. doi: 10.1248/cpb.54.37. [DOI] [PubMed] [Google Scholar]
- 24.Pu X, Sun J, Wang Y, Liu X, Zhang P, Tang X, et al. Development of a chemically stable 10-hydroxycamptothecin nanosuspensions. Int J Pharm. 2009;379(1):167–173. doi: 10.1016/j.ijpharm.2009.05.062. [DOI] [PubMed] [Google Scholar]
- 25.Mersmann A, Eble A, Heyer C. Crystal Growth. In: Mersmann A, editor. Crystallization technology handbook. 2. New York: Taylor & Francis; 2001. pp. 102–109. [Google Scholar]
- 26.Kaneko S, Yamagami Y, Tochihara H, Hirasawa I. Effect of Supersaturation on Crystal Size and Number of Crystals Produced in Antisolvent Crystallization. J Chem Eng Jpn. 2002;35(11):1219–1223. doi: 10.1252/jcej.35.1219. [DOI] [Google Scholar]
- 27.Van Eerdenbrugh B, Van den Mooter G, Augustijns P. Top-down production of drug nanocrystals: nanosuspension stabilization, miniaturization and transformation into solid products. Int J Pharm. 2008;364(1):64–75. doi: 10.1016/j.ijpharm.2008.07.023. [DOI] [PubMed] [Google Scholar]
- 28.Gao L, Zhang D, Chen M. Drug nanocrystals for the formulation of poorly soluble drugs and its application as a potential drug delivery system. J Nanopart Res. 2008;10:845–862. doi: 10.1007/s11051-008-9357-4. [DOI] [Google Scholar]
- 29.Zhang D, Tan T, Gao L, Zhao W, Wang P. Preparation of Azithromycin Nanosuspensions by High Pressure Homogenization and its Physicochemical Characteristics Studies. Drug Dev Ind Pharm. 2007;33(5):569–575. doi: 10.1080/03639040600975147. [DOI] [PubMed] [Google Scholar]
- 30.Teeranachaideekul V, Junyaprasert V, Souto E, Muller R. Development of ascorbyl palmitate nanocrystals applying the nanosuspension technology. Int J Pharm. 2008;354(1–2):227–234. doi: 10.1016/j.ijpharm.2007.11.062. [DOI] [PubMed] [Google Scholar]
- 31.Kocbek P, Baumgartner S, Kristl J. Preparation and evaluation of nanosuspensions for enhancing the dissolution of poorly soluble drugs. Int J Pharm. 2006;312(1–2):179–186. doi: 10.1016/j.ijpharm.2006.01.008. [DOI] [PubMed] [Google Scholar]
- 32.Schmidt M, Kusche R, Issendorff Bv, Haberland H. Irregular variations in themelting point of size-selected atomic clusters. Nature. 1998;393:238–240. doi: 10.1038/30415. [DOI] [Google Scholar]
- 33.Lai SL, Guo JY, Petrova V, Ramanath G, Allen LH. Size-Dependent Melting Properties of Small Tin Particles: Nanocalorimetric Measurements. Phys Rev Lett. 1996;77(1):99–102. doi: 10.1103/PhysRevLett.77.99. [DOI] [PubMed] [Google Scholar]
- 34.Zhang GGZ, Zhou D. Crystalline and Amorphous Solids. In: Qiu Y, Chen Y, Zhang GGZ, Liu L, Porter WR, editors. Developing Solid Oral Dosage Forms. 1. Oxford: Elsevier; 2009. pp. 35–36. [Google Scholar]
- 35.Kesisoglou F, Panmai S, Wu Y. Nanosizing - Oral formulation development and biopharmaceutical evaluation. Adv Drug Deliv Rev. 2007;59(7):631–644. doi: 10.1016/j.addr.2007.05.003. [DOI] [PubMed] [Google Scholar]
- 36.Hintz RJ, Johnson KC. The effect of particle size distribution on dissolution rate and oral absorption. Int J Pharm. 1989;51(1):9–17. doi: 10.1016/0378-5173(89)90069-0. [DOI] [Google Scholar]
- 37.Junghanns JU, Muller RH. Nanocrystal technology, drug delivery and clinical applications. Int J Nanomedicine. 2008;3(3):295–309. doi: 10.2147/ijn.s595. [DOI] [PMC free article] [PubMed] [Google Scholar]
- 38.Choi HG, Kim DD, Jun HW, Yoo BK, Yong CS. Improvement of dissolution and bioavailability of nitrendipine by inclusion in hydroxypropyl-beta-cyclodextrin. Drug Dev Ind Pharm. 2003;29(10):1085–1094. doi: 10.1081/DDC-120025866. [DOI] [PubMed] [Google Scholar]


