

Abstract
Tuberous Sclerosis Complex (TSC) is a multiorgan genetic disease that prominently features brain malformations (tubers) with many patients suffering from epilepsy and autism. These malformations typically exhibit neuronal as well as glial cell abnormalities and likely underlie much of the neurological morbidity seen in TSC. Tuber pathogenesis remains poorly understood though upregulation of the mTORC1 signaling pathway in TSC has been consistently demonstrated. Here we address abnormal brain development in TSC by inactivating the mouse Tsc1 gene in embryonic neural progenitor cells. This strategy permits evaluation of the role of the Tsc1 gene in both neuronal as well as glial cell lineages. Tsc1Emx1-Cre conditional knockout (CKO) animals die by 25 days of life. Their brains have increased size and contain prominent large cells within the cerebral cortex that have greatly increased mTORC1 signaling and decreased mTORC2 signaling. Severe defects of cortical lamination, enlarged dysmorphic astrocytes and decreased myelination were also found. Tsc1Emx1-Cre CKO mice were then treated with rapamycin to see if the premature death and brain abnormalities can be rescued. Postnatal rapamycin treatment completely prevented premature death and largely reversed the glia pathology but not abnormal neuronal lamination. These findings support a model that loss of function of the TSC genes in embryonic neural progenitor cells causes cortical malformations in patients with TSC. The dramatic effect of rapamycin suggests that even with extensive multi-lineage abnormalities, a postnatal therapeutic window may exist for patients with TSC.
Keywords: Cortical Development, mTOR, mTORC1, mTORC2, Neural Progenitor Cell, Radial Glia
Introduction
Tuberous Sclerosis Complex (TSC) is a relatively common genetic disorder that affects approximately 1:6,000 individuals worldwide (Crino et al., 2006). While inheritable as an autosomal dominant disorder, the majority of patients with TSC have spontaneous mutations in either the TSC1 gene (encodes hamartin) or TSC2 gene (encodes tuberin). Loss of function of either gene can lead to the full clinical spectrum of TSC though individuals with TSC2 inactivation tend to have more severe disease manifestations (Dabora et al., 2001; Ess, 2009; Jones et al., 1999; Sancak et al., 2005). While TSC impacts multiple organs; brain manifestations are especially debilitating due to a very high prevalence of epilepsy, developmental delay, autism and mental retardation (Rosser et al., 2006). These clinical features are generally ascribed to the presence of extensive focal brain malformations (tubers) that are found predominantly in the cortex of these patients. Pathological analyses of tubers shows severe disruption of cortical layers and prominent “giant” cells that express markers of both neuronal and glia lineages (Ess et al., 2005; Mizuguchi and Takashima, 2001). These findings suggest that they may result from abnormal differentiation of neural progenitor cells. Much progress has been made during the last decade in determining the function(s) of hamartin and tuberin, including roles in cellular proliferation, cell size determination and control of apoptosis. Specific actions of hamartin are not well understood but may regulate cellular adhesion through control of the GTPase Rho (Lamb et al., 2000). In contrast, tuberin function has been extensively studied with the identification of multiple upstream and downstream signaling pathways that converge upon this protein. These include inactivation by Akt and activation by AMPK (Inoki et al., 2003; Kwiatkowski, 2003). The most highly conserved region in tuberin is the GTPase activating protein (GAP) domain. This domain is required for inactivation of the small G protein Rheb (Ras homolog enriched in brain) that in turn is an activator of the serine/threonine kinase mTOR. mTOR functions within two distinct multiprotein complexes, mTORC1 and mTORC2. mTORC1 contains mTOR, raptor and mLST8 and controls mRNA translation by phosphorylation of ribosomal S6-kinase and 4E-BP1 (Inoki et al., 2005). In contrast, mTORC2 contains mTOR, rictor and mLST8. mTORC2 function is much less understood but appears to be involve cytoskeleton organization as well as activation of Akt, Protein Kinase C and SGK1 (Guertin et al., 2006; Huang and Manning, 2009; Huang et al., 2009). The mTORC1 and mTORC2 complexes also have extensive feedback mechanisms and interactions (Dibble et al., 2009). In addition, while mTORC1 is potently inhibited by rapamycin, mTORC2 is largely insensitive to this agent though prolonged rapamycin exposure may prevent mTORC2 formation (Sarbassov et al., 2004; Sarbassov et al., 2006). Cells from multiple tissues deficient for either Hamartin or Tuberin exhibit increased constitutive activity of mTORC1 with greatly augmented levels of phospho-S6-kinase, phospho-S6 and phospho-4E-BP1. These findings quickly led to an appreciation that mTORC1 inhibitors such as rapamycin may be novel and rational therapeutics for TSC. In fact, clinical trials using rapamycin for patients with TSC have been undertaken with very promising results to date (Bissler et al., 2008; Franz et al., 2006). Initial attempts to model TSC using conventional knockout of the mouse Tsc1 or Tsc2 genes revealed the requirement of each gene during embryonic development as Tsc1−/− and Tsc2−/− embryos die by embryonic day 12 (Kobayashi et al., 1999; Kobayashi et al., 2001; Kwiatkowski et al., 2002; Onda et al., 1999). Alternative strategies are thus needed to address the role of Tsc1 and Tsc2 during brain development and function. To this end, conditional knockout mouse models of TSC have been generated using a floxed allele of the Tsc1 gene (Uhlmann et al., 2002). This approach has been successfully employed to target the Tsc1 gene in astrocytes as well as post-mitotic neurons (Meikle et al., 2007; Uhlmann et al., 2002). Furthermore, mTORC1 inhibitors were able to reverse much of the phenotypes seen in these mouse models of TSC (Meikle et al., 2008; Meikle et al., 2007; Zeng et al., 2008). While providing new information about the pathogenesis of TSC including the development of epilepsy and the role of either astrocytes or post-mitotic neurons, these models have not fully recapitulated the CNS abnormalities seen in TSC. This is likely due to the relatively late onset of Cre expression during development and restriction of Tsc1 gene inactivation to astrocytes or post-mitotic neurons. Recently, another model of TSC was reported using a newly developed floxed Tsc2 allele whose inactivation was driven by the human GFAP promoter (Way et al., 2009). These mice have neuronal and glia abnormalities with increased mTORC1 signaling though abnormalities of mTORC2 or the effect of mTORC1 inhibitors were not studied.
Based on our previous work using human surgical samples from patients with TSC, we hypothesized that the CNS abnormalities in TSC result from TSC1 or TSC2-deficient neural progenitor cells. To test our hypothesis, we have now deleted the Tsc1 gene in early embryonic neural progenitor cells to study neuronal as well as glia differentiation. These conditional knockout mice (Tsc1Emx1-Cre CKO) have a greatly shortened lifespan and extensive neuronal as well as glial cell pathology. Postnatal treatment with rapamycin prevented the premature death and largely reversed glia but not the extensive neuronal pathology. These results support a critical role of the Tsc1 gene in neural progenitor cells during the generation of the cerebral cortex and suggest that hamartin is necessary for the proper differentiation of neurons, astrocytes and oligodendrocytes. While speculative, a postnatal window may exist for mTORC1 inhibitors to preferentially target glia pathology in patients with TSC.
Materials and methods
Animals
Mice with Tsc1 floxed alleles were obtained from Dr. David Gutmann (Washington University, St. Louis, MO) and originally generated by Dr. David Kwiatkowski (Harvard University, Boston, MA) (Uhlmann et al., 2002). Homozygous Tsc1 floxed animals have been maintained on a mixed SV129-C57/Bl6 genetic background for over four years in our colony, appear completely normal and breed without difficulty. Emx1-Cre mice were obtained from Jackson Laboratories (Strain #005638, Bar Harbor, ME) and maintained on a C57/Bl6 background. Tsc1Emx1-Cre CKO mice are homozygous for the Tsc1 floxed allele and heterozygous for Emx1-Cre. Littermate heterozygous Tsc1 Flox/wt; Emx1-Cre positive animals were used as controls and were indistinguishable from other control genotypes including Tsc1 Flox/Flox; or Flox/wt Emx1-Cre negative mice. Genotyping of tail genomic DNA was performed using PCR as previously described (Uhlmann et al., 2002). ROSA dtT/mGFP (Gt(ROSA)26Sortm4(ACTB-tdTomato,-EGFP)Luo/J) mice were obtained from Jackson Laboratories (Stock Number 007576) (Muzumdar et al., 2007). The IACUC of Vanderbilt University approved all procedures involving mice.
Brain and Astrocyte Genotyping
As antibodies against hamartin are generally not suitable for immunohistochemistry, we verified recombination of the Tsc1 gene in the dorsal cerebral cortex by microdissection of 20 μm coronal sections from Tsc1Emx1-Cre CKO and control littermates at embryonic day 13.5. Genomic DNA was extracted using RED Extract (Sigma, St. Louis, MO) and PCR performed using primer pairs (F4536 5′-AGGAGGCCTCTTCTGCTACC and R6548 5′-TGGGTCCTGACCTATCTCCTA) that span the LoxP sites and are informative for Cre mediated recombination. Genomic DNA was obtained from mouse tail and genotyped for the Tsc1 floxed or Tsc1 wild type alleles and the presence or absence of the Cre recombinase gene. Genomic DNA was also isolated from cultures of astrocytes obtained from postnatal day one Tsc1Emx1-Cre CKO and control mice using chloroform/isoamyl alcohol/phenol extraction and ethanol precipitation. PCR was again used to verify Cre mediated deletion of exons 17-18 and inactivation of the Tsc1 gene.
Immunofluorescence
Brains of Tsc1Emx1-Cre CKO and control littermates were processed using standard techniques (Ess et al., 2005). In brief, brains were rapidly removed and placed in 4% paraformaldehyde in PBS overnight at 4 degrees C. The brains were then washed in PBS and cryoprotected in 30% sucrose in PBS for 2 days. The brains were frozen in OCT using liquid nitrogen and stored at −80 degrees C until sectioned using a cryostat at 20 μm. To visualize cortical organization, sections were stained with Cresyl violet using standard techniques. Myelin was staining using Sudan Black with standard techniques. For immunofluorescence experiments, brain sections on slides were postfixed in 1% paraformaldehyde for three minutes and washed in PBS. Tissues were blocked in 5% goat serum with 0.1% Triton-X100 in PBS for one hour. Primary antibodies were added to the blocking solution and slides incubated overnight at 4 degrees C. Primary antibodies and dilutions: NeuN 1:1000 (Millipore), Cux1 1:100 (Santa Cruz), GFAP 1:1000 (Cell Signaling), phospho-S6 1:200 (Ser235/236, Cell Signaling) and MBP 1:200 (abcam). The next day, slides were washed in PBS and secondary fluorescent antibodies (Alexa 488 and Alexa 568, Invitrogen, CA) were allowed to bind for one hour. Slides were washed again in PBS and coverslipped with DAPI to identify nuclei (Vectashield, Vector Labs). The primary antibodies against Brn1 1:500 (Santa Cruz), FoxP2 1:10,000 (abcam), and Tbr1 1:100 (abcam) were incubated at room temperature overnight, followed by anti-rabbit biotinylated antibodies and then strepavidin-FITC or strepavidin-Texas Red (Vector Laboratories) for visualization. Negative controls for each experiment were performed by omission of the primary antibodies. Photomicrographs were obtained using an Olympus epifluorescence microscope. Images were imported to Adobe Photoshop CS4 for cropping and construction of panorama views. Any minor adjustments of brightness or contrast were done concurrently on photomicrographs of littermate control and Tsc1Emx1-Cre CKO brain sections. All experiments were performed three to seven times on brain sections from Tsc1Emx1-Cre CKO mice and control littermates.
Cortical Thickness
Brain sections were processed as above for immunofluorescence. Panoramic views were constructed using Adobe Photoshop CS4 and the distance of somatosensory cortex from the pial surface to the lateral ventricle was determined. Means and standard deviation were calculated, results were compared for statistical significance using Students t-test.
Cell Size
Diameter of phospho-S6 positive cells was quantified by importing images to ImageJ (NIH, version 1.38X) and in a blinded fashion 120 cells from layers 2-4 of upper motor cortex were measured using three independent control littermate and Tsc1Emx1-Cre CKO mice. Means and standard deviation were calculated, results were compared for statistical significance using Students t-test. A similar approach was used for quantifying NeuN positive cells (Fig. 8A) except area was calculated to more precisely measure any changes in cell size resulting from treatment with rapamycin.
Fig. 8.
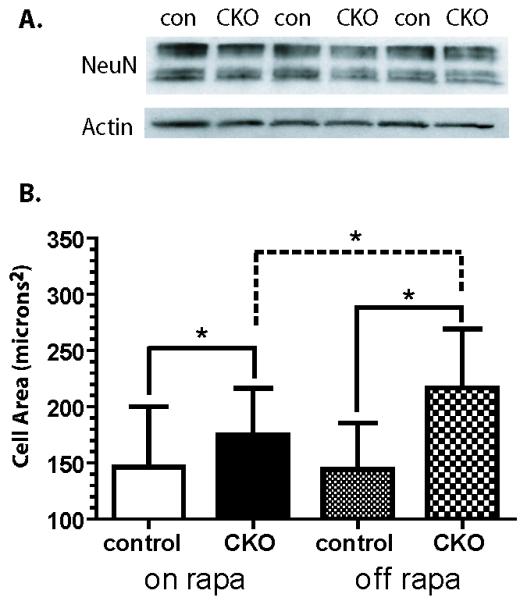
(A) NeuN Expression in Dorsal Cortex from Tsc1Emx1-Cre CKO and control mice. Total dorsal cortical extracts express similar levels of NeuN in P15 control and Tsc1Emx1-Cre CKO mice. Immunoblots using extracts from three control and Tsc1Emx1-Cre CKO mice are shown. Actin is used as a loading control. (B) Rapamycin decreases neuronal area in NeuN positive cells from control and Tsc1Emx1-Cre CKO brains treated with rapamycin. Rapamycin withdrawal allows further increases in area in CKO mice. Animals were treated with rapamycin form P15-40 (“on rapa”). An additional group of mice were treated from P15-40 and then euthanized at P55 approximately two weeks after cessation of rapamycin (“off rapa”). Asterisk denotes statistical significance using Students t-test, p<0.05.
Western Blots
P5 or P15 day Tsc1Emx1-Cre CKO and control littermates were euthanized and their dorsal cortex microdissected then flash frozen in liquid nitrogen and stored at −80° C. Samples were homogenized in RIPA buffer consisting of 1X PBS with 1% NP40, 0.5% Na deoxycholate, 0.1% SDS, along with protease and phosphatase inhibitor cocktails (Sigma) and clarified via centrifugation at 10,000 XG for 10 minutes at 4 C. Protein concentrations were calculated using the Bradford method (Bio-Rad). Samples were separated by electrophoresis on 12% Tris-SDS gels followed by transfer to PVDF membrane (Pall Corp., Pensacola, Fl). Membranes were blocked with 5% nonfat dry milk in TBS with 0.1 % Tween-20 for one hour at room temperature. Primary antibodies were incubated at 4°C overnight with dilutions: 1:1000 phospho-S6 (Ser235/236, #2211, Cell Signaling), S6 (#2217, Cell Signaling), phospho-Akt (Ser473, #9271, Cell Signaling), Akt (#9972, Cell Signaling), phospho-NDRG1 (Thr346 #5482, Cell Signaling), NDRG1 (#5196, Cell Signaling) and Actin (#4967, Cell Signaling). Horseradish peroxidase-conjugated secondary antibodies (GE Healthcare) were then added and signal was developed using ECL Western Blotting Substrate (Pierce, Rockford IL) or ECL Plus Western Blotting Detection System (Amersham, UK) and visualized on Hyperfilm ECL film (Amersham).
Rapamycin Treatment
Rapamycin (LC Laboratories, Woburn, MA) was dissolved at 30 mg/mL in ethanol and diluted with vehicle (0.25% Tween-20/0.25% polyethylene glycol) in PBS. Tsc1Emx1-Cre CKO and control littermates were injected with either rapamycin (3 mg/kg) or vehicle alone i.p. daily Monday-Friday of each week starting at P13-15 (Zeng et al., 2008). All surviving mice were euthanized at P40-44. As all vehicle treated Tsc1Emx1-Cre CKO mice died by 25 days of life, a vehicle treated control littermate was euthanized on that same day for comparison. All control brains were rapidly removed, weighed, and processed in parallel with brains from Tsc1Emx1-Cre CKO mice. Kaplan-Meier survival curves of Tsc1Emx1-Cre CKO and control mice treated with either rapamycin or vehicle were compared using a Logrank test (SPSS software, version 16).
Additional groups of control and Tsc1Emx1-Cre CKO mice were treated with rapamycin from P15-40 and euthanized on the day of last treatment. An further group of control and Tsc1Emx1-Cre CKO mice were also treated from P15-40 with rapamycin and then euthanized at P55 approximately two weeks after cessation of rapamycin.
Results
Tsc1 Gene Inactivation, Shortened Lifespan and Decreased Weight
To inactivate the Tsc1 gene in neural progenitor cells of the developing forebrain, we crossed Tsc1 floxed mice to Emx1-Cre animals to generate mice homozygous for the floxed allele and heterozygous for Emx1-Cre. These Tsc1Emx1-Cre conditional knockout (CKO) mice express Cre recombinase by embryonic day 10.5 (E10.5) in dorsal neural progenitor cells (Gorski et al., 2002). Dorsal neural progenitor cells give rise to almost all excitatory neurons of the cortex as well as astrocytes and a subset of oligodendrocytes (Gorski et al., 2002; Kessaris et al., 2006). To verify inactivation of the Tsc1 gene during early cortical development, dorsal cortex was microdissected from control and Tsc1Emx1-Cre CKO brain at E13.5. Genomic DNA was then isolated and PCR performed using primers that span the targeted region of the Tsc1 gene. As expected, complete recombination was seen in Tsc1Emx1-Cre CKO mice (Fig. 1B) and partial recombination in heterozygous conditional mice. Dissection of the dorsal cortex followed by immunoblotting revealed almost complete loss of hamartin in postnatal day 5 (P5) Tsc1Emx1-Cre CKO mice as compared to control littermates (Fig. 1C). Tuberin was concomitantly decreased consistent with a previously reported function of hamartin to stabilize tuberin levels. Functional loss of the Tsc1 gene in the cortex of P5 Tsc1Emx1-Cre CKO mice is also seen with increased mTORC1 signaling with increased levels of phospho-S6. In addition, decreased mTORC2 signaling was also seen with reduced levels of phospho-Akt (Serine 473, Fig. 1C). Similar findings using phospho-NDRG1 levels (Threonine 346) another specific readout of mTORC2 signaling (Huang et al., 2009) were seen in whole brain lysates from P15 Tsc1Emx1-Cre CKO mice compared to control littermates (Supplementary Figure 1). Tsc1Emx1-Cre CKO mice were born at expected Mendelian ratios but began to die after the first week of life. Early mortality continued with all Tsc1Emx1-Cre CKO mice dead by 25 days of life (n=19, Fig. 1D). In contrast, few control littermate mice died (4 of 35), these deaths were seen in all control genotypes and appear to be unrelated to deletion of the Tsc1 gene. Spontaneous seizures were consistently observed in Tsc1Emx1-Cre CKO mice between P13-20 with clonic limb movements and running/hyperactivity. Mice having obvious seizures usually died within 1-2 days. Their cause of death is not completely understood though in addition to seizures, they had poor weight gain and were notably smaller than control littermates (Fig. 1E).
Fig. 1.

Conditional inactivation of the Tsc1 gene in embryonic brain results in postnatal lethality, decreased weight, increased mTORC1 and decreased mTORC2 signaling. (A) Schematic of Tsc1 gene targeted by Cre recombinase. (B) Cre mediated recombination of the Tsc1 gene in dorsal cortex microdissected from E13.5 embryonic brain. Genotypes: 1. Tsc1 Flox/Flox; Cre negative, 2. Tsc1 Flox/wt heterozygote; Cre positive, 3. Tsc1 Flox/Flox homozygote; Cre positive (Tsc1Emx1-Cre CKO). Upper (closed) arrowhead indicates PCR product (2012 bp) of the unrecombined Tsc1 floxed allele, lower (open) arrowhead indicates PCR product (361 bp) from the recombined, inactivated Tsc1 allele. (C) Western blot of dorsal cortical extracts from representative P5 control and Tsc1Emx1-Cre CKO mice, n=4 for each group. Decreased hamartin and tuberin expression in seen as well as increased mTORC1 and decreased mTORC2 signaling with increased levels of phospho-S6 (Serine235/236) and decreased phospho-Akt (Serine 473) respectively. Changes in baseline levels of S6 or Akt were not seen. GFAP is also increased in the dorsal cortex from Tsc1Emx1-Cre CKO mice as compared to control littermates (C, also see Fig. 5B). Specific GFAP levels are seen by the lower two bands at 55 and 48 kD, with an upper non-specific band. Actin expression was used as a loading control. (D) Complete mortality of Tsc1Emx1-Cre CKO mice by postnatal day 25 compared to littermate controls. Log-Rank test, p<0.0001. (E) Decreased postnatal weight in Tsc1Emx1-Cre CKO mice (n=4) compared to littermate controls (n=9), error bars indicate standard deviation, asterisk denotes statistical significance using Students t-test p<0.05.
Brain Size and Cortical Lamination
As Tsc1Emx1-Cre CKO mice all died by P25, animals were euthanized at P15-21 to assess abnormalities of brain structure and organization. Grossly intact brain architecture was observed in postnatal Tsc1Emx1-Cre CKO mice with a recognizable neocortex, hippocampus and cerebellum. However, Tsc1Emx1-Cre CKO brains were noticeably larger, especially from mice older than P15 (Fig. 2A). Cortical thickness was also significantly increased in the Tsc1Emx1-Cre CKO animals (Fig. 2C). Cresyl violet stained brain sections revealed striking abnormalities of individual cell size, position and apparent cortical lamination in Tsc1Emx1-Cre CKO mice compared to littermates (Fig. 2D).
Fig. 2.

Increased brain size and cortical disorganization in Tsc1Emx1-Cre CKO mice. (A) Brain size in Tsc1Emx1-Cre CKO mice. Gross dorsal view of P20 control (left) and Tsc1Emx1-Cre CKO (right) brains, size bar equals 3.5 mm. (B) Increased weight of P20 brains from Tsc1Emx1-Cre CKO mice (n=12) compared to littermate controls (n=24). Asterisk denotes statistical significance using Students t-test, p=0.007. (C) Cortical thickness in P5 Tsc1Emx1-Cre CKO mice (n=3) compared to littermate controls (n=3). Asterisk denotes statistical significance using Students t-test, p=0.0112. (D) Cresyl violet staining in P20 control (left) and Tsc1Emx1-Cre CKO (right) mice shows increased cortical thickness and disorganization with apparent loss of lamination. Size bars equal 200 μm.
Given the disorganized appearance of the cortex in Tsc1Emx1-Cre CKO mice, we hypothesized that the Tsc1 gene is essential for the correct identity and/or positioning of cortical neurons generated during embryonic development. We examined the expression of several transcription factors that are normally restricted to either upper or lower layer cortical neurons. Control brain sections from P6 mice had the expected sharp domain of Cux1 expression in upper cortex (Fig. 3A) and Tbr1 in lower layer neurons (Fig. 3C). Strikingly, expression of both markers were decreased with a more diffuse pattern of expression within the cortex of Tsc1Emx1-Cre CKO mice (Fig. 3B, D). Expression of additional upper layer (Brn1) and lower layer (FoxP2) neuronal markers revealed similar results (Supplementary Fig. 2).
Fig. 3.

Diffuse expression of Cux1 (upper layer cortical marker, A,B) and Tbr1 (lower layer cortical marker, C,D) in brains from P5 Tsc1Emx1-Cre CKO mice (B,D) compared to control (A, C) mice. Magnification 20X. Size bars equal 100 μm for A, B and 200 μm for C,D.
We also analyzed levels of the postmitotic neuronal marker NeuN to see if the disorganized cells retained neuronal identity. This post-mitotic neuronal marker was present but overall expression appeared somewhat decreased in the cortex of Tsc1Emx1-Cre CKO mice (Supplementary Fig. 2). Immunoblotting for NeuN using dorsal cortical extracts from Tsc1Emx1-Cre CKO and control mice found no significant differences in levels of NeuN (Fig. 8A, Tsc1Emx1-Cre CKO NeuN levels 0.87 that of control brains, p=0.16) within the much thicker cortex in Tsc1Emx1-Cre CKO mice.
Increased mTORC1 signaling
Tuberin and hamartin function within a multiprotein complex with both partners required for full mTORC1 inhibition (Catania et al., 2001). To assess mTORC1 activity in the cortex, we examined phospho-S6 levels in cortical sections of Tsc1Emx1-Cre CKO and littermate control mice. While a basal level of phospho-S6 expression was seen in neurons from control brains, greatly increased expression was seen throughout the cortex in Tsc1Emx1-Cre CKO mice (Fig. 4B). Phospho-S6 staining also revealed a striking dysmorphic appearance and increased cell size in the CKO cortex (Fig. 4B, D). These large cells are found throughout the cortex and hippocampus. They appeared to be primarily neuronal given co-expression with NeuN (Supplementary Fig. 3). We quantified soma size within upper layers of frontal cortex and found a marked increase in the diameter of phospho-S6 positive cells from Tsc1Emx1-Cre CKO mice (mean diameter 31 +/−6.32 μm, n=120) compared to cells from control littermates (mean diameter 24.5 +/−4.36 μm, n=120, Students t-test, p<0.001). In contrast to another mouse model of TSC (Way et al., 2009), we did not see any clear heterotopias in the hippocampus of Tsc1Emx1-Cre CKO mice (Supplementary Fig. 4).
Fig. 4.

Increased mTORC1 signaling in Tsc1-deficient forebrain. (A, B) Increased levels of phospho-S6 in the cortex of P20 Tsc1Emx1-Cre CKO mice as compared to controls. Size bars equal 150 mm. (C, D) Higher magnification of boxes in A, B showing large dysmorphic appearing neurons. Size bars equal 100 μm.
Glia Abnormalities-Astrocytes
Dorsal neural progenitor cells in mice follow a stereotypical program of differentiation by initially producing lower and then upper layer neurons during E11-E18. This program of neuronogenesis by neural progenitor cells is then followed by a switch to the production of astrocytes and still later cortical oligodendrocytes during late embryonic and postnatal timepoints (Qian et al., 2000). As prominent expression of glial as well as neuronal cell markers have been reported in tubers and other brain abnormalities from patients with TSC (Crino, 2004; Ess et al., 2004), we hypothesized that loss of the Tsc1 gene may also impact the differentiation of glial from dorsal progenitor cells. This hypothesis can be readily addressed using Tsc1Emx1-Cre CKO mice as Emx1-expressing progenitor cells generate astrocytes as well as a subset of cortical oligodendrocytes (Gorski et al., 2002; Kessaris et al., 2006). Increased GFAP positive cells were found throughout the cortex in brains from Tsc1Emx1-Cre CKO mice as compared to controls (Fig. 5A, B). These GFAP-positive cells were dysmorphic appearing with thickened processes. Using immunoblotting, increased GFAP was also noted in cortical extracts derived from P5 brains as compared to control littermates (Fig. 1C). Of note, only occasional cells coexpressing phospho-S6 and GFAP were seen in the cortex of Tsc1Emx1-Cre CKO mice compared to control brains (data not shown). This possibly reflects the much higher expression of phospho-S6 in targeted neurons versus astrocytes or simply a technical difficulty with available antibodies to detect coexpression in mouse brain sections. However, an alternative explanation is a lack of Cre expression and subsequent Tsc1 gene inactivation in glia progenitors though Emx1-Cre mice have repeatedly been demonstrated to direct gene recombination in astrocytes (Gorski et al., 2002; Willaime-Morawek and van der Kooy, 2008). To address these possibilities, we established primary astrocyte cultures from P1 Tsc1Emx1-Cre CKO and control mice. Genomic DNA was isolated from these astrocyte cultures and PCR performed using DNA primers that span the region of Cre mediated recombination. As expected, astrocytes derived from heterozygous conditional mice had both wild type and the short recombined conditional allele whereas astrocytes derived from Tsc1Emx1-Cre CKO mice showed complete recombination of the Tsc1 gene (Fig. 5C). These primary cultures were largely homogenous with at least 80% of cells expressing GFAP (data not shown). To provide further evidence that Emx1-Cre efficiently directs gene recombination in astrocytes, we crossed Emx1-Cre mice to ROSA dtT/mGFP Cre reporter animals (Muzumdar et al., 2007). These mice constitutively express the dtTomato fluorochrome in all cells until exposure to Cre recombinase. Thereafter, dtTomato expression is lost and replaced by a membrane bound form of GFP. Astrocyte cultures were again obtained from P1 pups that were transgenic for both Emx1-Cre and ROSA dtT/mGFP. Almost all cells in these cultures were mGFP positive (Fig. 5D). These cells also coexpressed GFAP (Fig. 5E), indicating again that Emx1-Cre efficiently mediates gene recombination in astrocytes.
Fig. 5.

Increased GFAP expression in Tsc1Emx1-Cre CKO brains. (A, B) Minimal GFAP expression is seen in control somatosensory/motor cortex from control mice while GFAP expression is highly increased in Tsc1Emx1-Cre CKO mice. Size bar equals 50 μm. (C) Recombination of the Tsc1 gene in primary astrocyte cultures. Upper arrowhead (closed, 2012 bp) indicates wild type Tsc1 allele whereas the lower arrowhead (open, 361 bp) indicates the recombined and inactivated Tsc1 allele in astrocytes derived from heterozygote (lane 1) and homozygous (lane 2) conditional knockout brains. (D) Coexpression of membrane bound GFP (green) and GFAP (red) in astrocytes derived from ROSA dtT/mGFP mice. (F) Merge of (D) and (E). DAPI signal (blue) labels nuclei. Size bar equals 50 μm.
Glia Abnormalities-Myelination
Given the alterations of neuronal as well as astrocyte lineages in the cortex of P20 Tsc1Emx1-Cre CKO mice, we next addressed if oligodendrocytes were also impacted by loss of the Tsc1 gene in neural progenitor cells. Expression of myelin basic protein (MBP), the major protein component of myelin, was strikingly reduced in the cortex of Tsc1Emx1-Cre CKO mice as compared to controls (Fig. 6B versus 6A). At higher magnification (Fig. 6C, D) the normal fine branching pattern of oligodendrocytes appeared highly disrupted in the cortex of Tsc1Emx1-Cre CKO mice and when present, exhibit short and abnormally thickened MBP-positive processes. Sudan black staining of cortical sections confirmed decreased amounts of myelin in the corpus callosum of postnatal Tsc1Emx1-Cre CKO mice as compared to littermate controls (Fig 6E, F).
Fig. 6.

Decreased myelin in the cortex of Tsc1Emx1-Cre CKO mice. (A) Normal myelination pattern with myelin basic protein (MBP) expression in P20 control mice. (B) Greatly reduced MBP expression in frontal cortex of P20 Tsc1Emx1-Cre CKO mice. Patches of increased signal near the corpus callosum are artifact from digital reconstructions. Size bars equal 300 μm. (C, D) Higher magnification of boxes in A, B showing normal branching of myelinated axons in control mice but marked disruption in Tsc1Emx1-Cre CKO mice, size bars equal 100 μm. (E, F) Sudan black staining in the corpus callosum again showing reduced myelination in P20 Tsc1Emx1-Cre CKO mice compared to littermate controls. Size bars equal 200 μm.
mTORC1 Inhibition and Survival
To address if the abnormalities seen in Tsc1Emx1-Cre CKO mice were mTORC1-dependent, we treated Tsc1Emx1-Cre CKO and control littermates with Monday-Friday scheduled intraperitoneal injections once a day of either rapamycin (3 mg/kg) or a vehicle starting at P13-15 until spontaneous death or euthanasia at 40 days of age. Strikingly, all rapamycin treated Tsc1Emx1-Cre CKO mice (n=12) thrived with this regimen with no mortality (Fig. 7A) and no seizures seen. As predicted from natural history observations (Fig. 1D), all Tsc1Emx1-Cre CKO mice treated with vehicle alone died by P25 (p<0.001). We also obtained brain and total body weights from all mice treated with either rapamycin or vehicle. As expected from their enlarged brains and small total body weight, a greatly increased brain/body weight ratio was seen in vehicle treated Tsc1Emx1-Cre CKO mice compared to control littermates (Table I). Rapamycin treatment attenuated this ratio though a statistically significant difference persisted. The decreased brain/body ratio appeared to be due to both decreased brain size as well as increased total body weight in the rapamycin treated Tsc1Emx1-Cre CKO mice (Table I). Of note, rapamycin treated control mice had a moderate decrease in their weight, indicating some toxicity from this drug. Continued treatment of additional cohorts of Tsc1Emx1-Cre CKO mice with rapamycin was well tolerated and we have observed extended survival in these mice for greater than 3 months during this treatment regimen (more than 75 CKO mice, data not shown). Control mice again tolerated rapamycin well with apparent side effects limited to decreased weight gain.
Fig. 7.

Rescue of Tsc1Emx1-Cre CKO mice by postnatal treatment with rapamycin. (A) Complete survival of Tsc1Emx1-Cre CKO mice treated with rapamycin (CKO-Rapa, n=9) versus CKO mice treated with vehicle only (CKO-veh, n=6). Statistical significance of the increased survival of rapamycin treated Tsc1Emx1-Cre CKO mice determined using Log-rank test, p<0.001. (B-E) Reduction of mTORC1 activity in cortex of P40-44 Tsc1Emx1-Cre CKO and control mice treated with rapamycin compared to vehicle alone. Size bars equal 200 μm.
Table 1.
Brain size is increased in an mTORC1 dependent manner in Tsc1Emx1-Cre CKO mice compared to control littermates.
| Treatment Group (n) |
Age of Euthanasia (Days) |
Brain weight (SD) grams |
Body weight (SD) grams |
% Brain/Body Weight (SD) |
p-value of Brain/Body Ratio; control vs. CKO |
|---|---|---|---|---|---|
| control-vehicle (6) |
19-22 | 0.415 (0.042) |
10.3 (2.4) | 4.2 (1.0) | |
| CKO- vehicle (6) |
19-22 | 0.453 (0.060) |
5.0 (0.37) | 9.2 (1.3) | p < 0.0001 |
| control- Rapa (9) |
40-44 | 0.357 (0.018) |
16.4 (1.9) | 2.2 (0.2) | |
| CKO- Rapa (9) | 40-44 | 0.392 (0.029) |
12.9 (1.0) | 3.1 (0.2) | p< 0.0001 |
Tsc1Emx1-Cre CKO mice have enlarged brains and smaller total weight, resulting in an elevated brain to body weight ratio in vehicle treated CKO animals when examined at P19-22. Tsc1Emx1-Cre CKO mice have greatly prolonged survival when treated with rapamycin. However, even after rapamycin treatment the increased brain/body weight ratio at P40-44 is attenuated though remains increased in CKO compared to control animals.
We next examined phospho-S6 levels in Tsc1Emx1-Cre CKO and control littermates treated with either vehicle or rapamycin. A profound decrease in phospho-S6 levels was seen in the cortex of rapamycin treated Tsc1Emx1-Cre CKO mice at P40 indicating that this drug is able to cross the blood brain barrier and potently inhibit mTORC1 in the brain (Fig. 7E). Of note, treatment of control mice with rapamycin also decreased phospho-S6 expression to levels below the basal levels seen in animals treated only with vehicle (Fig. 7D).
Postnatal mTORC1 Inhibition and Neuronal/Glia Lineage Development
Using this cohort of rapamycin or vehicle treated Tsc1Emx1-Cre CKO mice and control mice, we also examined neuronal size, lamination, abnormalities of astrocytes and myelin to determine if these multi-lineage abnormalities are mTORC1-dependent and possibly reversible by postnatal treatment with rapamycin. Cortical neuron area was decreased in NeuN positive cells from control as well as Tsc1Emx1-Cre CKO mice treated with rapamycin from P15-40 (Fig. 8B). An additional group of Tsc1Emx1-Cre CKO and control mice were also treated with rapamycin from P15-40 and then euthanized at P55, two weeks after rapamycin cessation. Significant increased area were seen in Tsc1Emx1-Cre CKO neurons compared to control neurons. An additional significant increase was also seen in the area of Tsc1Emx1-Cre CKO neurons off rapamycin compared to those on rapamycin (Fig. 8B). No changes were seen in the area of control neurons on or off rapamycin.
Abnormalities of both upper (cux1, Fig. 9A-D) and lower layer cortical markers (FoxP2, Fig 9E-H) appeared unaffected by postnatal rapamycin treatment in Tsc1Emx1-Cre CKO mice. In contrast, astrocyte abnormalities appeared to be almost completely reversed by rapamycin treatment with sections from P40-44 Tsc1Emx1-Cre CKO mice indistinguishable from controls (Fig. 10D versus B). Finally, we examined myelination to see if oligodendrocyte abnormalities were also reversible by mTORC1 inhibition. Interestingly, P40-44 Tsc1Emx1-Cre CKO mice treated with rapamycin exhibited increased cortical myelination approaching levels and patterns of MBP expression similar seen to those seen in control mice (Fig. 10H versus G). Of note, rapamycin treatment did not enhance myelination in control mice indicating that suppression of increased mTORC1 signaling was likely responsible for this result.
Fig. 9.

Postnatal inhibition of mTORC1 does not alter abnormal cortical lamination. (A, B) Upper layer cortical marker cux1 is lost in P20 cortex from Tsc1Emx1-Cre CKO brains compared to control littermates. (C, D) Postnatal rapamycin treatment does not alter cortical lamination in P40-44 Tsc1Emx1-Cre CKO or control mice. Size bar equals 100 μm. Similar results are seen for the lower layer marker FoxP2 with much decreased expression seen in P20 cortex from Tsc1Emx1-Cre CKO brains (F) compared to control littermates. (E) Postnatal rapamycin treatment also does not alter expression of FoxP2 in P40-44 Tsc1Emx1-Cre CKO (H) or control (G) mice. Size bar equals 100 μm.
Fig. 10.

Postnatal inhibition of mTORC1 reverses glia abnormalities in the cortex of Tsc1Emx1-Cre CKO mice. (A-D) GFAP expression in P20 Tsc1Emx1-Cre CKO mice is reduced back to levels seen in control mice after treatment with rapamycin. Size bars equal 50 μm. (E-H) Expression of MBP in P40-44 Tsc1Emx1-Cre CKO mice is increased to levels approaching that seen in control mice after rapamycin treatment. Size bars equal 400 μm.
Discussion
TSC is a vital model system for the study of neurologic disease in children given the extraordinarily high prevalence of epilepsy and autism that is seen in these patients. Tubers are generally thought to underlie most of the severe neurological features in TSC though this issue is not completely resolved (Wong, 2007). Human studies have demonstrated abnormalities of both neuronal and glial cell differentiation in tubers as well as subependymal giant cell astrocytomas (SEGAs) resected from patients with TSC (Ess et al., 2004; Ess et al., 2005). These results led us to hypothesize that dorsal neural progenitor cells deficient for the TSC1 or TSC2 genes undergo abnormal proliferation and differentiation. This model also suggests that the timing of gene inactivation is critical with mutant embryonic neural progenitor cells giving rise to tubers while postnatal progenitor cells residing in the subependymal zone of the lateral ventricle may be responsible for the generation of SEGAs. However, details of tuber and SEGA pathogenesis remain elusive given the complexity of studying human diseases and the early embryonic lethality of conventional knockout mouse and rat models.
To circumvent early embryonic death, conditional knockouts of the Tsc1 gene have been made though they have been restricted to either postmitotic neurons or astrocytes (Ehninger et al., 2008; Meikle et al., 2007; Uhlmann et al., 2002). While these targeted approaches are invaluable to test specific aspects of TSC, existing animal models do not closely recapitulate many of the pathologic abnormalities including formation of tubers and concomitant neuronal and glial cell pathology. Therefore in this study we targeted dorsal neural progenitor cells as these cells normally give rise to glutamatergic neurons, astrocytes, and a subset of cortical oligodendrocytes. This targeting of early embryonic dorsal progenitor cells led to severe disruption of cortical lamination, increased cell size, increased activity of mTORC1 but decreased mTORC2 signaling. However, true tuber formation with focal pathology as seen in humans with TSC may be impossible or impractical to achieve in transgenic mouse models given the lissencephalic cortex inherent to rodents and current limitations in conditional knockout technology. Nonetheless, our findings of abnormal upper and lower neurons in the cortex of Tsc1Emx1-Cre CKO mice supports our interpretation that the Tsc1 gene in dorsal neural progenitors is required for normal lamination and suggests that TSC1 or TSC2 deficient cells in patients with TSC have impairment either in neuronal fate and/or neuronal migration.
The similarities of Tsc1Emx1-Cre CKO mice with Tsc2 CKO mice (Way et al., 2009) further supports a role for the Tsc1 and Tsc2 genes in early neural progenitor cells. Some differences in deep layer versus upper layer neurons in these two models may relate to the timing of Cre expression as the Emx1-Cre transgene begins to be expressed in the forebrain by E10.5 while hGFAP-Cre is turned on around E13.5-E14 (Zhuo et al., 2001). Relative Cre expression levels within the developing and postnatal hippocampus may also explain the neuronal heterotopias seen by Way et al. though the conditional loss of the Tsc2 gene versus Tsc1 may also explain this discrepancy.
In addition to neurons, glia abnormalities have been recognized as a key feature of tubers. In particular, astrocyte abnormalities are almost universal in TSC and there is a growing consensus that these cells are critical to the disorder (Sosunov et al., 2008). This reassessment of glial cells versus neurons is consonant with the widespread roles played by astrocytes including regulation of glutamate transport, potassium homeostasis, and maintenance of the blood-brain barrier. Intriguingly, TSC animal models and brain tissue resected from patients with TSC have demonstrated abnormalities of all of these processes (Boer et al., 2008; Jansen et al., 2005; Wong et al., 2003). In addition to astrocytes, other glia abnormalities have also been reported in TSC. Widespread white matter aberrations have been reported in brains from patients with TSC as well as in the neuronal conditional knockout model of TSC (Meikle et al., 2007; Ridler et al., 2001; Ridler et al., 2007). These findings have been relatively unexplored or attributed to a secondary defect of oligodendrocytes from axonal pathology (Meikle et al., 2008). Notably, we also have found decreased myelin in Tsc1Emx1-Cre CKO mice with stunted and dysplastic processes in the cortex. These results may be a secondary phenomenon from abnormal neuronal-oligodendrocyte interactions given the widespread neuronal abnormalities seen in this mouse model but may represent a cell-autonomous defect in oligodendrocyte development as significant numbers of cortical oligodendrocytes are generated from Emx1 expressing precursors (Kessaris et al., 2006). This is an intriguing point as cortical oligodendrocytes are specified relatively late in development with many cells generated postnatally. As postnatal rapamycin treatment was much more efficacious with astrocytes and oligodendrocyte abnormalities when compared to neurons, glial dysfunction can potentially be uncoupled from neuronal pathology. However, given the multi-lineage nature of this model, generation of oligodendrocyte-specific knockouts of the Tsc1 or Tsc2 genes will be needed to test this contention.
Seizures are extremely common in TSC with up to 80% prevalence in some reports (Crino et al., 2006). This often devastating neurological feature is likely related to the presence of tubers though there is an emerging debate about “tuber-less” mechanisms of epilepsy in TSC (Wong, 2007). Chief amongst these is abnormalities of astrocytes in TSC with abnormalities of glutamate transport and potassium homeostasis as already discussed. In addition, mice with neuronal conditional knockouts of Tsc1 also have overt seizures (Meikle et al., 2008; Meikle et al., 2007; Zeng et al., 2008) supporting multilineage contributions to epilepsy in patients with TSC. Tsc1Emx1-Cre CKO mice have frequent seizures starting around 1 week of age with abnormal posturing and clonic-tonic movements. While these seizures very likely contributed to their death, we have not been able to obtain EEG recordings from these mice given their overall fragility and very small size.
We have not found any brain pathology, seizures or increased mTORC1 activity in the cortex of conditional heterozygous mice. Conventional heterozygous knockout mice with a single functional copy of Tsc1 or Tsc2 have minimal brain pathology though some neuronal abnormalities have been reported in Tsc1+/− mice (Tavazoie et al., 2005), and hippocampal dependent learning difficulties that are reversible with rapamycin have been reported in Tsc2+/− heterozygote mice (Ehninger et al., 2008). Tsc1 heterozygous mice also have been shown to have cognitive impairment without obvious pathological abnormalities (Goorden et al., 2007). However, these animals were not challenged with mTORC1 inhibitors. These findings suggest that haploinsufficiency of either the Tsc1 or Tsc2 genes may underlie some aspect of disease pathogenesis. However, our data best support a model where the functional loss of both copies of either TSC1 or TSC2 in neural progenitor cells is required for mTORC1 dysregulation and the neuropathologic features of TSC including tuber formation.
Treatment of patients with TSC using mTORC1 inhibitors appears to be a very promising therapy for renal and lung manifestations in TSC as well as SEGAs (Bissler et al., 2008; Franz et al., 2006). In this study we used rapamycin to determine if the brain abnormalities seen were mTORC1-dependent and whether inhibition of this signaling pathway could reverse neuronal or glial cell abnormalities. Previous studies using rapamycin or rapamycin analogs in either neuron-specific or astrocyte-specific conditional knockouts of Tsc1 has demonstrated improved survival, decreased seizures and partial phenotypic restoration (Meikle et al., 2008; Zeng et al., 2008). The importance of having neuronal and glial cell abnormalities in a single animal model of TSC is underscored by our findings that postnatal rapamycin can almost completely reverse astrocyte and oligodendrocyte abnormalities while aberrant neuronal organization persisted. This finding is not unexpected from postnatal rapamycin treatment as neural progenitor cells normally first generate neurons during early embryogenesis followed by a switch to astrocytes and then oligodendrocyte production postnatally. It is possible that rapamycin may also reverse or ameliorate abnormal neuronogenesis in TSC, however marked toxicity of mTORC1 inhibitors during fetal and early postnatal life may prevent this usage as mTOR is required for normal brain development Gangloff et al., 2004). Nonetheless, we are now treating Tsc1Emx1-Cre CKO and control embryos with single doses of rapamycin at specific developmental time points to address possible efficacy as well as toxicity during early cortical development. Finally, our results suggest that a postnatal therapeutic window for rapamycin exists in TSC. This is potentially exciting premise if glia in particular are responsible for some of the pathology and morbidity seen in TSC (Sosunov et al., 2008). However, given their frank alterations in neuronal structure and organization, Tsc1Emx1-Cre CKO mice as well as patients with TSC may very well have persistent deficits of learning and abnormal behavior even if glial abnormalities can be corrected by postnatal rapamycin treatment. However, the decrease in neuronal size we see in Tsc1Emx1-Cre CKO mice from rapamycin further suggests that neuronal structure and function can be impacted by postnatal mTORC1 inhibition. Future studies using our model will be invaluable to determine the relative contribution of neuronal versus glial cells to the pathophysiology of TSC.
Supplementary Material
Supplementary Fig. 1. Decreased mTORC2 Signaling in Dorsal Cortex from Tsc1Emx1-Cre CKO compared to control mice. Microdissected dorsal cortical extracts express decreased levels of phospho-NDRG1 in P15 Tsc1Emx1-Cre CKO mice (n=7) compared to littermate control animals (n=7). Total protein loading was similar for each pair of control and Tsc1Emx1-Cre CKO mice using levels of total NDRG1 and β-actin.
Supplementary Fig. 2. Cortical abnormalities and lamination in Tsc1Emx1-Cre CKO mice. NeuN immunofluorescence in somatosensory cortex in control (A) and Tsc1Emx1-Cre CKO (B) mice further demonstrates cortical disorganization and increased cortical thickness. Size bars equal 200 μm. (C) Brn1 expression is seen within a sharp domain in upper cortical neurons of control mice while Tsc1Emx1-Cre CKO cortex (D) has a reduced and diffuse expression throughout the cortex. Size bars equal 200 μm. (E) FoxP2 expression is found within lower layer neurons of control littermates while brains from Tsc1Emx1-Cre CKO cortex (F) also have reduced and diffuse expression. Size bars equal 50 μm.
Supplementary Fig. 3. Coexpression of NeuN and Phospho-S6 positive in cerebral cortex of P18 control (A-C, G-I) and Tsc1Emx1-Cre CKO mice (D-F, J-L) mice. NeuN expression again reveals large neurons and disorganized cortex (E versus B) in CKO brains. At higher magnification, NeuN and phospho-S6 co-expressing neurons appear dysmorphic. Size bar equals 200 μm for A-F and 50 μm for G-L.
Supplementary Fig. 4. Increased numbers of phospho-S6 cells in the genu of the hippocampus from P18 Tsc1Emx1-Cre CKO mice (F) compared to controls (E). The dentate gyrus appears structurally similar in Tsc1Emx1-Cre CKO mice (D) compared to controls (C). DAPI staining for nuclei does not reveal any gross morphological changes within the hippocampus of Tsc1Emx1-Cre CKO mice. Size bar equals 100 μm for A-F.
Highlights Carson et al.
In this study we inactivate the mouse Tsc1 gene in dorsal neural progenitor cells.
We found increased mTORC1 and decreased mTORC2 signaling in the cerebral cortex.
Tsc1Emx1-Cre CKO mice have abnormalities in cortical neurons as well as glia.
Tsc1Emx1-Cre CKO mice are smaller than littermates and die by postnatal day 25.
Postnatal rapamycin treatment rescues mortality and reverses glial abnormalities.
Acknowledgements
We thank Drs. David Gutmann and David Kwiatkowski for gift of Tsc1 floxed mice, encouragement and helpful discussions. This work was supported by NIH grant 5K08NS050484 to K.C.E. Support was also provided by the Vanderbilt Kennedy Center for Research on Human Development and the Tuberous Sclerosis Alliance.
Footnotes
Publisher's Disclaimer: This is a PDF file of an unedited manuscript that has been accepted for publication. As a service to our customers we are providing this early version of the manuscript. The manuscript will undergo copyediting, typesetting, and review of the resulting proof before it is published in its final citable form. Please note that during the production process errors may be discovered which could affect the content, and all legal disclaimers that apply to the journal pertain.
The first two authors contributed equally to this work.
References
- Bissler JJ, et al. Sirolimus for angiomyolipoma in tuberous sclerosis complex or lymphangioleiomyomatosis. N Engl J Med. 2008;358:140–51. doi: 10.1056/NEJMoa063564. [DOI] [PMC free article] [PubMed] [Google Scholar]
- Boer K, et al. Inflammatory processes in cortical tubers and subependymal giant cell tumors of tuberous sclerosis complex. Epilepsy Res. 2008;78:7–21. doi: 10.1016/j.eplepsyres.2007.10.002. [DOI] [PubMed] [Google Scholar]
- Catania MG, et al. Hamartin expression and interaction with tuberin in tumor cell lines and primary cultures. Journal of Neuroscience Research. 2001;63:276–83. doi: 10.1002/1097-4547(20010201)63:3<276::AID-JNR1021>3.0.CO;2-A. [DOI] [PubMed] [Google Scholar]
- Crino PB. Molecular pathogenesis of tuber formation in tuberous sclerosis complex. J Child Neurol. 2004;19:716–25. doi: 10.1177/08830738040190091301. [DOI] [PubMed] [Google Scholar]
- Crino PB, et al. The tuberous sclerosis complex. N Engl J Med. 2006;355:1345–56. doi: 10.1056/NEJMra055323. [DOI] [PubMed] [Google Scholar]
- Dabora SL, et al. Mutational analysis in a cohort of 224 tuberous sclerosis patients indicates increased severity of TSC2, compared with TSC1, disease in multiple organs. American Journal of Human Genetics. 2001;68:64–80. doi: 10.1086/316951. [DOI] [PMC free article] [PubMed] [Google Scholar]
- Dibble CC, et al. Characterization of Rictor phosphorylation sites reveals direct regulation of mTOR complex 2 by S6K1. Mol Cell Biol. 2009;29:5657–70. doi: 10.1128/MCB.00735-09. [DOI] [PMC free article] [PubMed] [Google Scholar]
- Ehninger D, et al. Reversal of learning deficits in a Tsc2+/−mouse model of tuberous sclerosis. Nat Med. 2008;14:843–8. doi: 10.1038/nm1788. [DOI] [PMC free article] [PubMed] [Google Scholar]
- Ess K, et al. Expression Profiling in Tuberous Sclerosis Complex (TSC) Knockout Mouse Astrocytes to Characterize Human TSC Brain Pathology. Glia. 2004;46:28–40. doi: 10.1002/glia.10324. [DOI] [PubMed] [Google Scholar]
- Ess KC. Treatment of infantile spasms in tuberous sclerosis complex: dismal outcomes but future hope? Nat Clin Pract Neurol. 2009;5:72–3. doi: 10.1038/ncpneuro0994. [DOI] [PubMed] [Google Scholar]
- Ess KC, et al. Developmental origin of subependymal giant cell astrocytoma in tuberous sclerosis complex. Neurology. 2005;64:1446–9. doi: 10.1212/01.WNL.0000158653.81008.49. [DOI] [PubMed] [Google Scholar]
- Franz DN, et al. Rapamycin causes regression of astrocytomas in tuberous sclerosis complex. Ann Neurol. 2006;59:490–8. doi: 10.1002/ana.20784. [DOI] [PubMed] [Google Scholar]
- Gangloff YG, et al. Disruption of the mouse mTOR gene leads to early postimplantation lethality and prohibits embryonic stem cell development. Mol Cell Biol. 2004;24:9508–16. doi: 10.1128/MCB.24.21.9508-9516.2004. [DOI] [PMC free article] [PubMed] [Google Scholar]
- Goorden SM, et al. Cognitive deficits in Tsc1+/−mice in the absence of cerebral lesions and seizures. Ann Neurol. 2007;62:648–55. doi: 10.1002/ana.21317. [DOI] [PubMed] [Google Scholar]
- Gorski JA, et al. Cortical excitatory neurons and glia, but not GABAergic neurons, are produced in the Emx1-expressing lineage. J Neurosci. 2002;22:6309–14. doi: 10.1523/JNEUROSCI.22-15-06309.2002. [DOI] [PMC free article] [PubMed] [Google Scholar]
- Guertin DA, et al. Ablation in mice of the mTORC components raptor, rictor, or mLST8 reveals that mTORC2 is required for signaling to Akt-FOXO and PKCalpha, but not S6K1. Dev Cell. 2006;11:859–71. doi: 10.1016/j.devcel.2006.10.007. [DOI] [PubMed] [Google Scholar]
- Huang J, Manning BD. A complex interplay between Akt, TSC2 and the two mTOR complexes. Biochem Soc Trans. 2009;37:217–22. doi: 10.1042/BST0370217. [DOI] [PMC free article] [PubMed] [Google Scholar]
- Huang J, et al. Signaling events downstream of mammalian target of rapamycin complex 2 are attenuated in cells and tumors deficient for the tuberous sclerosis complex tumor suppressors. Cancer Res. 2009;69:6107–14. doi: 10.1158/0008-5472.CAN-09-0975. [DOI] [PMC free article] [PubMed] [Google Scholar]
- Inoki K, et al. Dysregulation of the TSC-mTOR pathway in human disease. Nat Genet. 2005;37:19–24. doi: 10.1038/ng1494. [DOI] [PubMed] [Google Scholar]
- Inoki K, et al. TSC2 mediates cellular energy response to control cell growth and survival. Cell. 2003;115:577–90. doi: 10.1016/s0092-8674(03)00929-2. [DOI] [PubMed] [Google Scholar]
- Jansen LA, et al. Epileptogenesis and reduced inward rectifier potassium current in tuberous sclerosis complex-1-deficient astrocytes. Epilepsia. 2005;46:1871–80. doi: 10.1111/j.1528-1167.2005.00289.x. [DOI] [PubMed] [Google Scholar]
- Jones AC, et al. Comprehensive mutation analysis of TSC1 and TSC2-and phenotypic correlations in 150 families with tuberous sclerosis. American Journal of Human Genetics. 1999;64:1305–15. doi: 10.1086/302381. [DOI] [PMC free article] [PubMed] [Google Scholar]
- Kessaris N, et al. Competing waves of oligodendrocytes in the forebrain and postnatal elimination of an embryonic lineage. Nat Neurosci. 2006;9:173–9. doi: 10.1038/nn1620. [DOI] [PMC free article] [PubMed] [Google Scholar]
- Kobayashi T, et al. Renal carcinogenesis, hepatic hemangiomatosis, and embryonic lethality caused by a germ-line Tsc2 mutation in mice. Cancer Res. 1999;59:1206–11. [PubMed] [Google Scholar]
- Kobayashi T, et al. A germ-line Tsc1 mutation causes tumor development and embryonic lethality that are similar, but not identical to, those caused by Tsc2 mutation in mice. Proceedings of the National Academy of Sciences of the United States of America. 2001;98:8762–7. doi: 10.1073/pnas.151033798. [DOI] [PMC free article] [PubMed] [Google Scholar]
- Kwiatkowski DJ. Rhebbing up mTOR: new insights on TSC1 and TSC2, and the pathogenesis of tuberous sclerosis. Cancer Biol Ther. 2003;2:471–6. doi: 10.4161/cbt.2.5.446. [DOI] [PubMed] [Google Scholar]
- Kwiatkowski DJ, et al. A mouse model of TSC1 reveals sex-dependent lethality from liver hemangiomas, and up-regulation of p70S6 kinase activity in Tsc1 null cells. Human Molecular Genetics. 2002;11:525–34. doi: 10.1093/hmg/11.5.525. [DOI] [PubMed] [Google Scholar]
- Lamb RF, et al. The TSC1 tumour suppressor hamartin regulates cell adhesion through ERM proteins and the GTPase Rho. Nature Cell Biology. 2000;2:281–7. doi: 10.1038/35010550. [DOI] [PubMed] [Google Scholar]
- Meikle L, et al. Response of a neuronal model of tuberous sclerosis to mammalian target of rapamycin (mTOR) inhibitors: effects on mTORC1 and Akt signaling lead to improved survival and function. J Neurosci. 2008;28:5422–32. doi: 10.1523/JNEUROSCI.0955-08.2008. [DOI] [PMC free article] [PubMed] [Google Scholar]
- Meikle L, et al. A mouse model of tuberous sclerosis: neuronal loss of Tsc1 causes dysplastic and ectopic neurons, reduced myelination, seizure activity, and limited survival. J Neurosci. 2007;27:5546–58. doi: 10.1523/JNEUROSCI.5540-06.2007. [DOI] [PMC free article] [PubMed] [Google Scholar]
- Mizuguchi M, Takashima S. Neuropathology of tuberous sclerosis. Brain Dev. 2001;23:508–15. doi: 10.1016/s0387-7604(01)00304-7. [DOI] [PubMed] [Google Scholar]
- Muzumdar MD, et al. A global double-fluorescent Cre reporter mouse. Genesis. 2007;45:593–605. doi: 10.1002/dvg.20335. [DOI] [PubMed] [Google Scholar]
- Onda H, et al. Tsc2(+/−) mice develop tumors in multiple sites that express gelsolin and are influenced by genetic background. Journal of Clinical Investigation. 1999;104:687–95. doi: 10.1172/JCI7319. [DOI] [PMC free article] [PubMed] [Google Scholar]
- Qian X, et al. Timing of CNS cell generation: a programmed sequence of neuron and glial cell production from isolated murine cortical stem cells. Neuron. 2000;28:69–80. doi: 10.1016/s0896-6273(00)00086-6. [DOI] [PubMed] [Google Scholar]
- Ridler K, et al. Widespread anatomical abnormalities of grey and white matter structure in tuberous sclerosis. Psychol Med. 2001;31:1437–46. doi: 10.1017/s0033291701004561. [DOI] [PubMed] [Google Scholar]
- Ridler K, et al. Neuroanatomical correlates of memory deficits in tuberous sclerosis complex. Cereb Cortex. 2007;17:261–71. doi: 10.1093/cercor/bhj144. [DOI] [PubMed] [Google Scholar]
- Rosser T, et al. The diverse clinical manifestations of tuberous sclerosis complex: a review. Semin Pediatr Neurol. 2006;13:27–36. doi: 10.1016/j.spen.2006.01.008. [DOI] [PubMed] [Google Scholar]
- Sancak O, et al. Mutational analysis of the TSC1 and TSC2 genes in a diagnostic setting: genotype--phenotype correlations and comparison of diagnostic DNA techniques in Tuberous Sclerosis Complex. Eur J Hum Genet. 2005;13:731–41. doi: 10.1038/sj.ejhg.5201402. [DOI] [PubMed] [Google Scholar]
- Sarbassov DD, et al. Rictor, a novel binding partner of mTOR, defines a rapamycin-insensitive and raptor-independent pathway that regulates the cytoskeleton. Curr Biol. 2004;14:1296–302. doi: 10.1016/j.cub.2004.06.054. [DOI] [PubMed] [Google Scholar]
- Sarbassov DD, et al. Prolonged rapamycin treatment inhibits mTORC2 assembly and Akt/PKB. Mol Cell. 2006;22:159–68. doi: 10.1016/j.molcel.2006.03.029. [DOI] [PubMed] [Google Scholar]
- Sosunov AA, et al. Tuberous sclerosis: a primary pathology of astrocytes? Epilepsia. 2008;49(Suppl 2):53–62. doi: 10.1111/j.1528-1167.2008.01493.x. [DOI] [PubMed] [Google Scholar]
- Tavazoie SF, et al. Regulation of neuronal morphology and function by the tumor suppressors Tsc1 and Tsc2. Nat Neurosci. 2005;8:1727–34. doi: 10.1038/nn1566. [DOI] [PubMed] [Google Scholar]
- Uhlmann EJ, et al. Astrocyte-specific TSC1 conditional knockout mice exhibit abnormal neuronal organization and seizures. Annals of Neurology. 2002;52:285–96. doi: 10.1002/ana.10283. [DOI] [PubMed] [Google Scholar]
- Way SW, et al. Loss of Tsc2 in radial glia models the brain pathology of tuberous sclerosis complex in the mouse. Hum Mol Genet. 2009;18:1252–65. doi: 10.1093/hmg/ddp025. [DOI] [PMC free article] [PubMed] [Google Scholar]
- Willaime-Morawek S, van der Kooy D. Cortex- and striatum-derived neural stem cells produce distinct progeny in the olfactory bulb and striatum. Eur J Neurosci. 2008;27:2354–62. doi: 10.1111/j.1460-9568.2008.06206.x. [DOI] [PubMed] [Google Scholar]
- Wong M. The utility of tuberless models of tuberous sclerosis. Epilepsia. 2007;48:1629–30. doi: 10.1111/j.1528-1167.2007.01178_1.x. author reply 1632-4. [DOI] [PubMed] [Google Scholar]
- Wong M, et al. Impaired glial glutamate transport in a mouse tuberous sclerosis epilepsy model. Ann Neurol. 2003;54:251–6. doi: 10.1002/ana.10648. [DOI] [PubMed] [Google Scholar]
- Zeng LH, et al. Rapamycin prevents epilepsy in a mouse model of tuberous sclerosis complex. Ann Neurol. 2008;63:444–453. doi: 10.1002/ana.21331. [DOI] [PMC free article] [PubMed] [Google Scholar]
- Zhuo L, et al. hGFAP-cre transgenic mice for manipulation of glial and neuronal function in vivo. Genesis. 2001;31:85–94. doi: 10.1002/gene.10008. [DOI] [PubMed] [Google Scholar]
Associated Data
This section collects any data citations, data availability statements, or supplementary materials included in this article.
Supplementary Materials
Supplementary Fig. 1. Decreased mTORC2 Signaling in Dorsal Cortex from Tsc1Emx1-Cre CKO compared to control mice. Microdissected dorsal cortical extracts express decreased levels of phospho-NDRG1 in P15 Tsc1Emx1-Cre CKO mice (n=7) compared to littermate control animals (n=7). Total protein loading was similar for each pair of control and Tsc1Emx1-Cre CKO mice using levels of total NDRG1 and β-actin.
Supplementary Fig. 2. Cortical abnormalities and lamination in Tsc1Emx1-Cre CKO mice. NeuN immunofluorescence in somatosensory cortex in control (A) and Tsc1Emx1-Cre CKO (B) mice further demonstrates cortical disorganization and increased cortical thickness. Size bars equal 200 μm. (C) Brn1 expression is seen within a sharp domain in upper cortical neurons of control mice while Tsc1Emx1-Cre CKO cortex (D) has a reduced and diffuse expression throughout the cortex. Size bars equal 200 μm. (E) FoxP2 expression is found within lower layer neurons of control littermates while brains from Tsc1Emx1-Cre CKO cortex (F) also have reduced and diffuse expression. Size bars equal 50 μm.
Supplementary Fig. 3. Coexpression of NeuN and Phospho-S6 positive in cerebral cortex of P18 control (A-C, G-I) and Tsc1Emx1-Cre CKO mice (D-F, J-L) mice. NeuN expression again reveals large neurons and disorganized cortex (E versus B) in CKO brains. At higher magnification, NeuN and phospho-S6 co-expressing neurons appear dysmorphic. Size bar equals 200 μm for A-F and 50 μm for G-L.
Supplementary Fig. 4. Increased numbers of phospho-S6 cells in the genu of the hippocampus from P18 Tsc1Emx1-Cre CKO mice (F) compared to controls (E). The dentate gyrus appears structurally similar in Tsc1Emx1-Cre CKO mice (D) compared to controls (C). DAPI staining for nuclei does not reveal any gross morphological changes within the hippocampus of Tsc1Emx1-Cre CKO mice. Size bar equals 100 μm for A-F.