



Abstract
Shotgun proteomics commonly utilizes database search like Mascot to identify proteins from tandem MS/MS spectra. False discovery rate (FDR) is often used to assess the confidence of peptide identifications. However, a widely accepted FDR of 1% sacrifices the sensitivity of peptide identification while improving the accuracy. This article details a machine learning approach combining retention time based support vector regressor (RT-SVR) with q value based statistical analysis to improve peptide and protein identifications with high sensitivity and accuracy. The use of confident peptide identifications as training examples and careful feature selection ensures high R values (>0.900) for all models. The application of RT-SVR model on Mascot results (p=0.10) increases the sensitivity of peptide identifications. q value, as a function of deviation between predicted and experimental RTs(Δ RT), is used to assess the significance of peptide identifications. We demonstrate that the peptide and protein identifications increase by up to 89.4% and 83.5%, respectively, for a specified q value of 0.01 when applying the method to proteomic analysis of the natural killer leukemia cell line (NKL). This study establishes an effective methodology and provides a platform for profiling confident proteomes in more relevant species as well as a future investigation of accurate protein quantification.
Keywords: tandem mass spectrometry, shotgun proteomics, database search, support vector regressor, retention time, q value, peptide identification, NKL cell
1. Introduction
With the advent of high-throughput mass spectrometry (MS), shotgun proteomics has been employed as a major tool to analyze biological samples and produce thousands of MS or tandem MS spectra [1–3]. The method of choice for annotating these spectra with sequences are currently database search engines such as Mascot, SEQUEST, OMSSA and X!Tandem [4–7]. The algorithms generally score the similarities between the experimental and theoretical spectra and rank the best match with the highest score as the predicted peptide spectrum match (PSM). However, the top PSM is not necessarily correct due to the scoring scheme and quality of a spectrum. Target/decoy search strategy and the resulting false discovery rate (FDR) calculation is used to assess the confidence of reported PSMs[8]. However, there is a tradeoff between sensitivity and accuracy of peptide or protein identifications that FDR has to manage [9, 10]. In order to increase sensitivity while maintain accuracy one can incorporate retention time predictors [11–22] as a post-Mascot analysis tool to increase confidence for peptide identifications.
The retention time (RT) of a peptide is defined as the elapsed time between the time of injection and the time of elution of the peak maximum. Previous studies demonstrated that the retention time of a peptide is the function of various peptide parameters, including amino acid composition [23], N-terminal or C-terminal residues[14], location of amino acids within the primary structure [16], peptide length or mass[12], and hydrophobicity [20]. Many sophisticated models have been constructed to predict retention time and used predicted RT to improve peptide identification. For example, Krokhin et al. [14] trained a linear model (SSRC) by linearly correlating RT with a comprehensive hydrophobicity which integrates residue’s hydrophobicity and structural and positional effects. Strittmatter et al. [21] proposed an artificial neural network (ANN) peptide RT prediction model by using positional amino acid information to yield a 16% increase in peptide identification for a complex sample (human plasma) [16]. Klammer et al.[22] adopted a support vector regressor dynamically trained for each chromatographic run, with which 50% more positive peptide identifications were obtained at a false positive rate of 3%. Although a great deal of effort has been made in this field to improve protein identifications in shotgun proteomics, there are still some challenging issues to be addressed. The comparison of the previously published models indicates that the static linear model depends on the chromatographic condition and thus prediction bias would occur when the model is used for a different condition. ANN model needs an extremely large dataset (~345000 training examples) [21] that is often impractical for application. Dynamic SVR model is suitable for relatively small dataset and avoids the RT variation between different chromatographic runs. However, its performance is modest compared to the other two models. In addition, the deviation between predicted and experimental RTs (Δ RT) is favorably used to filter out false positives when applying the trained RT predictor to real data. However, there are limitations in previous approaches to determine a suitable Δ RT threshold. With SSRC [24], the Δ RT threshold was determined by tentatively checking recovery of peptide predictions with varying arbitrary Δ RT values like ±4, ±2, ±1 min. In [22], optimal Δ RT threshold was selected from a range of Δ RT values (0–240 min) at which the highest numbers of true positives were obtained across the largest number of FDR values (in a range of 0.5–10%). These approaches could lead to under or overestimation of peptide identifications by unsuitable Δ RT threshold. Hence, it is necessary to develop a state-of-the-art RT predictor which can increase the sensitivity to maximize the number of predictions while ensure the accuracy of peptide identifications at the same time.
Given that a dynamic SVR model is more universal and practical for real application, we developed a SVR based RT predictor (RT-SVR) to be used in conjunction with Mascot search results obtained from 2D LC-MS/MS experiments. Our proposed RT-SVR model was constructed with multiple peptide spectral matches (PSM) which were obtained from Mascot search results (at FDR~1%) for each run. When applying the trained RT-SVR model to real data for examining peptide identifications, instead of choosing a Δ RT threshold arbitrarily or trained with a set of FDR, we introduced a method called q value assessment to define a dynamic Δ RT threshold that improves the confidence of evaluation for peptide identifications. By using this statistical method, q value rather than Δ RT is employed as the cut-off criteria to filter out the false positives. q value metric was first proposed by Storey et al.[25] to analyze genomic data and later on it was revised and applied to MS-based proteomics by Kail et al.[26, 27]. The q value can be understood as the minimal FDR at which a peptide spectra match (PSM) can be accepted. In practice, q value can be associated with any PSM in a dataset. Since q value is calculated from all PSMs in a dataset, it is considered as a statistical result for the whole dataset like FDR. Previous studies have shown that q value is equivalent to FDR estimation and no bias will be introduced toward under or overestimation [28, 29]. Thus, q value assessment is viewed as a more accurate and reliable estimation of error rate. In our study, a modified q value was calculated based on target and decoy PSMs and then was assigned to a peptide prediction. Finally, we can unambiguously filter out the false positives for a given q value threshold such as 0.01 (Figure 1). By applying our strategy to proteomic analysis of the natural killer leukemia cell line (NKL), the trained RT-SVR models for all datasets obtained from sample fractions show high performance with R value above 0.900. The peptide and protein identifications increase by up to 89.4% and 83.5% respectively in comparison with Mascot search results (at FDR 1%) with a q value of 0.01. Our results thus demonstrate the utility of the RT-SVR with q value assessment as a robust and reliable method for post-Mascot analysis in proteomic applications.
Figure 1.
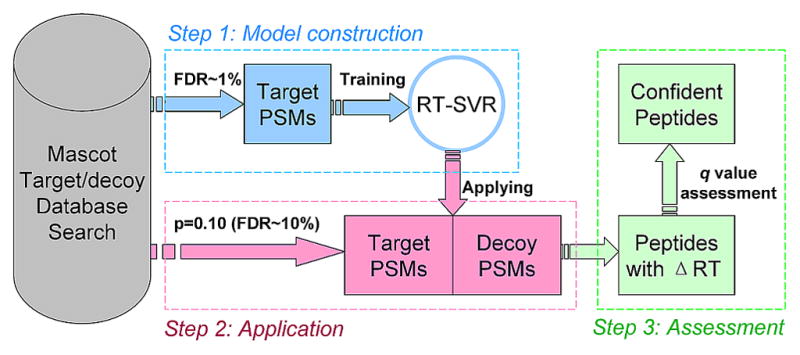
The workflow of RT-SVR in processing proteomic data. The first step is to construct the RT-SVR model. Target PSMs (at 1%FDR) are screened (remove those with Mascot score < Mascot identify threshold) to create training and testing datasets (split with a ratio of 3:1). The second step is to apply the trained RT-SVR to Mascot results (at p=0.10) so as to filter out false positive predictions. Both target and decoy PSMs are processed with RT-SVR following by q value assessment by which confident peptide predictions are selected out at a given q value.
In addition, we combined RT-SVR and Mascot score screening (Mascot Identity Threshold) to rescue those peptide identifications missed by RT-SVR. This combined RT-SVR method yields more peptide and protein identifications.
In order to evaluate the general applicability of our RT-SVR strategy we applied the model to an independent set of large-scale yeast proteomic data acquired using a Thermo LTQ mass spectrometer (downloaded from PeptideAtlas (PAe001337) and processed by the combined RT-SVR). As a comparison, 566 unique proteins were predicted at a q value of 0.01 in contrast with 470 with Mascot (MIH, FDR 1%) and 499 unique proteins reported by Trans-Proteomic Pipeline (TPP, probability filter 0.010). This result suggests that the RT-SVR model is independent of instruments used for shotgun proteomics and is generally applicable to proteomic data analysis acquired on multiple mass spectrometric platforms.
RT-SVR was written in Java. The windows-based graphical user interface can be freely downloaded from http://pages.cs.wisc.edu/~yadi/bioinfo/rtsvr/rtsvr.html.
2. Materials and methods
2.1. Sample preparation for proteomic analysis
107 NKL cells were harvested and washed three times with ice-cold PBS. Cells were lysed with 100μl RIPA lysis buffer (Formulation: 50 mM Tris-HCl (pH7.4), 150 mM NaCl, 0.1% SDS, 1% NP-40) on ice for 20 minutes with 20 seconds of sonication at the beginning. Cellular debris was removed by centrifugation for 30 min at 16,100 ×g at 4°C. Supernatants were collected and protein concentrations were measured using a BCA protein assay kit (Pierce). 50μg of protein was used for acetone precipitation. Acetone (precooled to −80°C) was added gradually (with intermittent vortexing) to the protein extract to a final concentration of 80% (v/v). The solution was then incubated at −20 °C for 60 minutes and centrifuged at 16,100 ×g for 15 minutes. The supernatant was decanted, and the pellet was carefully washed twice using cold acetone to ensure the efficient removal of detergent. The residual acetone was evaporated at ambient temperature. The pellet was dissolved and denatured with 8M urea in 25 mM ammonium bicarbonate buffer, and reduced by incubating with 50 mM DTT at 37°C for 1 hour. The reduced proteins were alkylated for 1 hour in darkness with 100 mM iodoacetamide. The alkylation reaction was quenched by adding DTT to a final concentration of 50 mM. The samples were diluted to a final concentration of 1 M urea. Trypsin was added to the sample at a 30:1 protein to trypsin mass ratio. The sample was incubated at 37°C overnight.
2.2. Off-line first dimension HPLC
Tryptic digests were injected onto Waters Alliance HPLC (Waters) with a high pH-stable RP column (Phenomenex Gemini C18, 150 × 2.1mm, 3 micron) at a flow rate of 150μL/min. The peptides were eluted with a gradient from 5 to 45% solvent B over 60 minutes (Solvent A: 100mM ammonium formate, pH 10; Solvent B: acetonitrile (ACN)). Fractions were collected every 3 min for 60 min. Collected fractions were dried by Speedvac and reconstituted in 30 μL of 0.1% formic acid. 5 μL of each of the 20 fractions were subjected to nanoLC-MS/MS.
2.3. LC-ESI ion trap mass spectrometry and MS/MS analysis
20 fractions collected from high pH RPLC were analyzed using amaZon ion trap mass spectrometer (Bruker Daltonics, Germany) equipped with Eksigent nanoLC-Ultra system (Dublin, CA). For the chromatographic separation, solvent A consisted of 0.1% formic acid in water and solvent B consisted of 0.1% formic acid in ACN. 5 μL of each fraction is injected onto an Agilent Technologies Zorbax 300 SB-C18 5 μm, 5×0.3 mm trap cartridge (Santa Clara, CA) at a flow rate of 5 μL/min for 5 minutes at 95% A 5% B, followed by peptides separation performed on Waters 3μm Atlantis dC18 75 μm × 150 mm analytical column (Milford, MA) using gradient from 0 to 45% solvent B at 250 nL/min over 90 minutes. Acquisition of precursor ions and MS/MS spectra was performed using the parameters as indicated below:
Smart parameter setting (SPS) was set to 700 m/z, compound stability and trap drive level were set at 100%. Dry gas temperature, 125°C, dry gas, 4.0 L/min, capillary voltage, −1300 V, end plate offset, −500V, MS/MS fragmentation amplitude, 1.0V, and Smart Fragmentation set at 30–300%. Data were generated in data dependent mode with strict active exclusion set after two spectra and released after one minute. MS/MS spectra were obtained via collision induced dissociation (CID) fragmentation for the six most abundant MS ions. For MS generation the ICC target was set to 200,000, maximum accumulation time, 50.00 ms, one spectrometric average, rolling average, 2, acquisition range of 300–1500 m/z, and scan speed (enhanced resolution) of 8,100 m/z s−1. For MS/MS generation the ICC target was set to 300,000, maximum accumulation time, 50.00 ms, two spectrometric averages, acquisition range of 100–2000 m/z, and scan speed (Ultrascan) of 32,000 m/z per second.
2.4. MS/MS database search
MS/MS spectra were converted into mgf formatted files by DataAnalysis (Ver 4.0, Bruker Daltonics Bremen, Germany). Deviations in parameters from the default Protein Analysis in DataAnalysis were as follows: intensity threshold, 1000, maximum number of compounds, 1E9, and retention time window 0.001 minute. The resulting mgf files were then searched against the Human SwissProt database (SwissProt_57.5.fasta) with Mascot 2.2.06. The parameters and conditions were set as the following: tryptic digestion, maximum 3 missed cleavages, carbamidomethylation of cysteine as the fixed modification, oxidation of methionine as the variable modification, peptide mass tolerance of 100 ppm, fragment mass tolerance of 0.6 Da, +1, +2 and +3 chosen for charge state. In this study, a simultaneous target-decoy search strategy (automatic decoy search) was adopted for FDR estimation. During the search, every time a protein sequence from the target database is tested, a random sequence of the same length is automatically generated and tested. Set “a bold red peptide required” for protein assembly.
2.5. Extracting training and test datasets
We used Mascot results obtained at a FDR of 1% as the source of training and test datasets. The FDR can be calculated as the number of decoy matches divided by the number of target matches. We accepted the peptide-spectra matches (PSM) above identity threshold as confident identifications when FDR is equal or less than 1%. By adjusting the significance level, p value defined by Mascot, the FDR can be controlled at ~1%. Following this, the resulting peptide identifications were exported as csv formatted files. A custom-written java script was then used to process the exported results and extract those identifications with scores above identity threshold. The corresponding retention times were also included. Finally, the set of peptides and associated retention times were randomly split according to a ratio of 3:1 to form the training and test datasets for each chromatographic run. No data was allowed to be included in both training and test datasets to avoid overfitting. The fraction with 100 or less PSMs at a FDR of 1% was not used for this study because the performance of a support vector regressor (SVR) would be deteriorated greatly if it was generated by a small number of training examples [30]. Via mascot search, there is no peptide contained in the first 1/4 and last 1/4 of the 20 fractions. We used the middle 10 fractions for our study. After checking the number of peptide predictions in each of 10 fractions, we found that 9 fractions met the criteria (confident PSMs >100) and they were used as the data source for dataset #1–9. In addition, we selected the last fraction as source for dataset #10 (containing 77 PSMs) to test if the performance of a SVR trained with small size of data could be deteriorated.
2.6. Constructing dynamic support vector regressor and performance analysis
Given the variations of retention times for a specific analyte with different chromatographic runs, a dynamic retention time regressor is needed to eliminate this bias for each chromatographic run [22]. A support vector regressor learns a function that relates a dependant variable, here retention time, to a set of independent variables (we called features). To generate the independent features, each data point including peptide and the associated retention time in training dataset was rewritten as 45-element support vectors. The 45 elements were treated as features composed of the following: 20 features representing the total number of each amino acid residue in the peptide sequence; 20 binary features representing the identity of the N-terminal amino acid residue; 2 binary features standing for the identity of C-termini (R or K, both 0 if no R/K); one feature for peptide mass; one feature for peptide length and the class feature for retention time. We used the same method to rewrite the data points in test dataset.
A 10-fold cross validation was set to optimize the hyper-parameter selection. Two kernel functions were used: a linear kernel which can report the weight of each feature and a RBF kernel (Gaussian function) which can produce a more flexible and successful regressor.
The performance of SVR model was evaluated by Pearson’s correlation, which measures the correlation coefficient, R value between the predicted and experimental retention times. The R value for two datasets X and Y of length n is given by the following formula,
Where
The whole procedure, including training and test dataset extracting, model learning and performance analysis, was repeated 5 times to eliminate the data variance[31].
2.7. Application of RT-SVR model and statistical analysis for peptide predictions
For each of chromatographic run #1 to #9, we adjusted p value to 0.10 when employing Mascot to do a simultaneous target-decoy search (automatic decoy search). The resulting Mascot report including target and decoy peptide sequence matches (PSM) was exported as .csv formatted files. Following by this, experimental retention time for each PSM was picked up and put in a new column “RT/min” in .csv files. The revised .csv files were then processed by the corresponding RT-SVR model during which the theoretical RTs were predicted and RT errors (ΔRT, differences between experimental and theoretical RT’s) were calculated. The RT error was used to calculate q value which was used to statistically assess the accuracy of peptide predictions.
The following procedure describes the calculation of q value.
Denote the RT errors (Δ RT) of target PSMs f1, f2, …, fmf and the RT errors of decoy PSMs d1, d2, …, dmd. For a given Δ RT threshold t, the false discovery rate (FDR) can be estimated as
E(FP(t)) is the expected value of the number of false positives and E(P(t)) is the expected value of the number of positives. E(FP(t)) and E(P(t)) can be experimentally determined by doing a simultaneous target-decoy search. E(FP(t)) is the number of experimentally accepted decoy PSMs, which is denoted as E(FP(t))=|{di ≤ t;i=1,2,…, md}|. E(P(t)) is the number of experimentally accepted target PSMs denoted as E(P(t))=|{fi ≤ t,i=1,2…, mf}|. Therefore, we can rewrite the formula of FDR estimation as
For a given target PSM with a RT error of s, the associated q value is defined as the minimal FDR value as shown in the following equation:
To calculate q value for a PSM with a RT error of s, 1) compare all other RT errors to s; 2) compute FDR by setting the RT error as threshold if a RT error ≥ s. 3) compare all calculated FDRs and choose the smallest one as the q value for the PSM with a RT error of s.
Throughout the paper we calculate q values at the PSM level; i.e., the same peptide can be reported as a target or decoy identification multiple times. Through the definition, we can consider q value as the minimal FDR at which the PSM can be accepted.
3. Results and Discussion
3.1. Support vector regressor and performance analysis
The information about training and test datasets used for this study is summarized in Table 1 in which the number of confident peptide identifications is listed for each chromatographic run. The size ratio of training dataset to test data set is randomly within 3:1 to 4:1.
Table 1.
The dataset used in this study. All data with scores exceeding identity threshold are extracted from Mascot results obtained at a FDR of 1%.
| Run | Confident peptides | Training | Test |
|---|---|---|---|
| 1 | 376 | 275 | 101 |
| 2 | 364 | 271 | 93 |
| 3 | 306 | 236 | 70 |
| 4 | 215 | 171 | 44 |
| 5 | 293 | 207 | 86 |
| 6 | 410 | 323 | 87 |
| 7 | 284 | 223 | 61 |
| 8 | 374 | 298 | 76 |
| 9 | 206 | 153 | 53 |
| 10 | 77 | 57 | 20 |
We used Alex Smola and Bernhard Scholkopf’s sequential minimal optimization algorithm to train a support vector regression model (SMOreg). Two kernel functions were utilized in this study so that we could compare their performance and then choose the better one for application to protein identifications. Figure 2 demonstrates the comparison of the performance of both kernels. The Bland-Altman plots[32] were made with the results from dataset #1. From the graph, most deviations in retention time (RT error) fall into the region of 95% confidence limit of bias (mean±2SD). The mean and the region of mean±2SD (0.07±1.76 min) with Gaussian kernel are smaller than those (0.33+2.60 min) with linear kernel. Moreover, the R value with Gaussian Kernel is higher than that with linear kernel. Similar results were obtained for other datasets when comparing Gaussian kernels with linear kernels. Therefore, we chose Gaussian kernel to train RT-SVR model for each chromatographic run.
Figure 2.
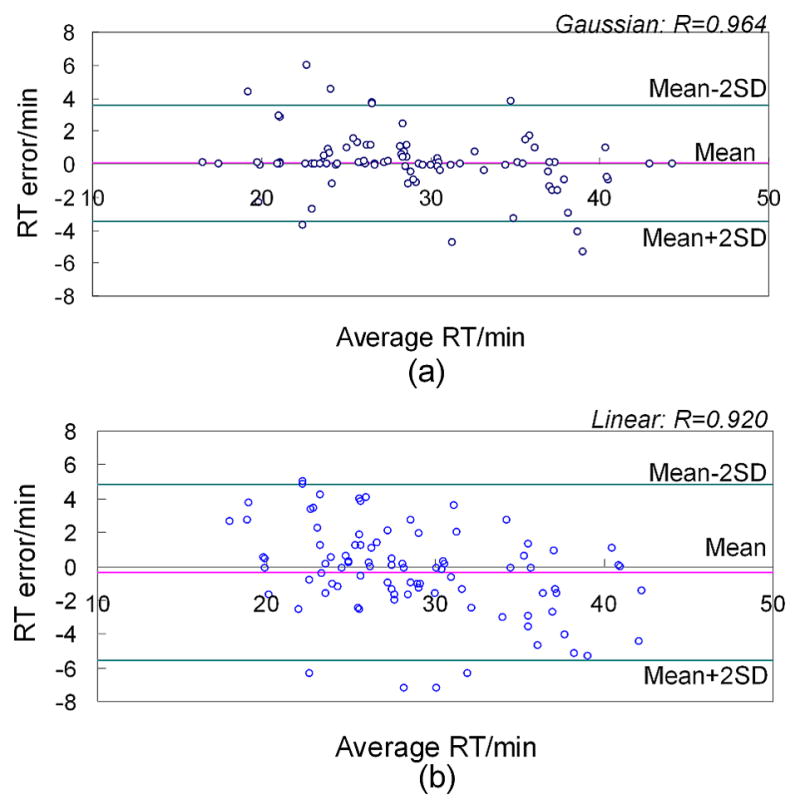
The Bland-Altman plot shows the distribution of RT deviation over the average of the predicted and experimental RTs. The Pearson’s correlation R value is specified at the top right. Dataset #1 was used to make graphs. a) Gaussian kernel; b) Linear kernel.
The determination of hyper-parameters is complicated when training a SVR model. Caution is necessary to choose appropriate hyper-parameters in order to establish a good-performance model. 10-fold cross validation (CV) strategy was used to help choose the values of hyper-parameters. The optimal complexity parameter c was chosen from the range of 1.0 to 10.0 for linear kernel and from 1.0 to 100.0 for Gaussian kernel. The filter types used for both kernels are standardized training data with a function of . The exponent p associated with kernel function is set to 1.0 while the γ in Gaussian model is set to 0.01 because they perform best in all cases by comparing to other values. We used all default values for other hyper-parameters since they did not yield significantly different results.
Some models have been published to study the property of retention time such as linear regressor by Krokhin [14], ANN by Petritis [16] etc. Linear regressor relates the retention time as the function of hydrophobicity. Although it is simple and ready to be used for small dataset, it is restricted to specific chromatographic conditions. Moreover, when applied to peptide identification, the method to choose an arbitrary RT threshold may cause either more false positives or identification loss. ANN method which employed a very large size of dataset (345000 unique peptides) for training is impractical when applied to protein profiling study. As a comparison, we ran Krokhin’s linear model (SSRC) (http://hs2.proteome.ca/SSRCalc/SSRCalc32.html, version 3.2) on our training data and tested the performance. The training dataset was used to calculate relative hydrophobicity with arbitrary value of 1.0 assigned to the two parameters a and b for each peptide in the dataset, followed by a plot of experimental retention time versus relative hydrophobicity. In this manner, the two parameters a and b were trained and used for test datasets to obtain the predicted retention times for the peptides in test set. Finally, the correlation coefficient R was calculated from the predicted and experimental retention times. Given that our chromatographic condition (300 Å with formic acid) is different from the four provided ones, we tested two conditions (“300Å column with TFA conditions” and “formic acid”) and found that R values are larger with “formic acid” condition. Therefore, we set these larger R values as the test results from the SSRC model. The results for comparison are summarized in Table 2, from which we can see that in most cases, both Gaussian and linear RT-SVR outperform SSRC and only for run #10 the SSRC has a comparable performance to RT-SVR. This observation suggests that the RT-SVR model prefers relatively large dataset while the SSRC model works better on small dataset. In addition, it is worth noting that the RT-SVR model performance is not proportional to the size of training dataset. It only depends upon the diversity of dataset. For instance, for Gaussian kernel RT-SVR, R value (0.926) from dataset #6 (323 training examples) is smaller than that (0.956) from dataset #4 (171 training examples). This indicates that the data in dataset #6 are more diverse. This property is consistent with Klammer’s observation [22].
Table 2.
The performance (R value) of RT-SVR and SSRC linear regressor for each dataset
| Data set | RT-SVR
|
SSRC* | |
|---|---|---|---|
| Gaussian | Linear | ||
| 1 | 0.964 | 0.920 | 0.846 |
| 2 | 0.948 | 0.896 | 0.677 |
| 3 | 0.975 | 0.919 | 0.857 |
| 4 | 0.956 | 0.936 | 0.770 |
| 5 | 0.959 | 0.938 | 0.631 |
| 6 | 0.926 | 0.873 | 0.641 |
| 7 | 0.972 | 0.916 | 0.836 |
| 8 | 0.928 | 0.882 | 0.716 |
| 9 | 0.903 | 0.800 | 0.650 |
| 10 | 0.874 | 0.786 | 0.854 |
SSRC is Sequence Specific Retention Calculator (http://hs2.proteome.ca/SSRCalc/SSRCalcHelp.htm, version 3.2)
We also studied if the RT-SVR model is robust with the size of training dataset. A graph of R versus the training dataset size was generated based on all 10 datasets, shown in Figure 3. RT-SVR maintains a stable performance with a standard deviation of 0.032 for Gaussian kernel and 0.053 for linear kernel, while R value for SSRC changes dramatically with a standard deviation of 0.099. Based on these observations, a conclusion can be made that the RT-SVR exhibits a stable performance if the size of training dataset is large enough for model construction.
Figure 3.

The performance and robustness comparison for different RT-SVR models and SSRC linear regressors.
3.2. Factors that affect the RT-SVR model performance
When we train the RT-SVR model, several concerns need to be addressed that could affect the performance of the model. The first concern is whether we can use multiple PSMs rather than unique peptides as examples in training and test datasets. Previous study [22] suggested that it is necessary to eliminate the redundancy of examples and only allow unique peptide sequence to be present in a dataset, which can avoid bias in the regression. However, given the nature of retention property of a compound on an LC column, we believe that there is a benefit to consider redundant PSMs. Theoretically, the elution peak of a given compound follows Gaussian distribution and spans duration from seconds to minutes when eluting with liquid chromatography. Accordingly, when the downstream mass spectrometer samples the compound and produces the final TIC (Total Ion Chromatogram), multiple mass spectra corresponding to the same compound will be acquired. Therefore, all retention times associated with these mass spectra represent the same peptide and should be all included for the RT-SVR model construction. Inspired by this chemical property, we choose multiple PSMs rather than unique peptide to produce training and test datasets. It is worth noting that this training technique will not lead to overfitting because the 45-element vectors corresponding to these PSMs are not the same due to different retention times. We took dataset #1 to compare the performance of RT-SVR models trained with multiple PSMs or unique peptides. The RT-SVR model trained with our method exhibits a higher R value of 0.964 compared to 0.792 with unique peptide training set (both are with Gaussian kernel). Using multiple PSMs to train a RT-SVR model represents a closer approximation to chemical condition of LC-MS based proteomic analysis. Thus, the resulting model has a superior performance to that trained with unique peptides.
Another concern is whether the correct rate of protein identifications in the training data significantly affects the performance of the RT-SVR model. Previous studies manually checked the original dataset to extract confident peptide identifications. By setting a high value of significance level, i.e., 10% FDR, a large source dataset was obtained to produce enough training examples [22, 23]. However, this method may result in less confident training examples which lead to a bias in regression. One way to address this issue is to use more confident source data to produce training and test datasets. This can be done by using Mascot results obtained at a FDR of 1% to form training and test datasets as we adopted in this study. To prove this, we compiled a set of training and test datasets which were randomly extracted from the Mascot results obtained at a FDR of 9.6% (run #5), followed by a RT-SVR with Gaussian kernel being trained and tested. We repeated 5 times and used the average R value to assess the model performance. Consequently, the RT-SVR model trained with the large dataset (430 examples) from less confident Mascot results (FDR=9.6%) produces R value of 0.864, compared to 0.959 produced by its counterpart (trained with 200 examples at FDR=1%). This comparison indicates that accuracy of training data is more important to ensure the good performance of a RT-SVR model.
Another major factor to consider is dataset size because the sample space and data diversity shows significant effect on model performance [30]. To investigate the relationship between the size of training dataset and model performance, we compiled a series of training datasets and a fixed test dataset which are randomly extracted from the dataset #1 obtained at a FDR of 1%. All datasets only contain confident peptide identifications with a Mascot score above Mascot Identity Threshold. A fixed dataset consisting of 101 peptides was first extracted and used to test the model performance. The training datasets with different sizes were then randomly extracted from the remaining part of the source dataset #1. The sizes of training datasets were designed as 50, 100, 150, 200 and 250. Three replicates of each training dataset were produced to eliminate random error due to data variation. A RT-SVR model was constructed by every specific training dataset and then tested with the fixed test dataset. The resulting R values were grouped by the size of training dataset and averaged arithmetically. Figure 4 shows the average R values with the associated standard deviations as error bar versus dataset size. As shown the R values corresponding to 50 and 100 training sets are 0.640 and 0.822, respectively, whereas all others are larger than 0.900. According to this observation, we can say that a size of 150 for training set is large enough to produce a satisfactory model performance (R=0.901±0.013). To strengthen this point, we investigated the quality of protein predictions. The trained RT-SVR models in previous step were applied to the application dataset, here the application dataset run #1 (p=0.10 or FDR=7.5%), to predict proteins with a q value of 0.01. Mascot (MIH) identified 135 proteins from this dataset at a FDR of 1%, which will be used as a comparison. The results are also shown in Figure 4, from which we can observe the trend of protein identifications over the size of training dataset. The model trained with the dataset containing 150 examples predicted 133 proteins, which is comparable to Mascot results. By considering both R value and protein prediction, we can conclude that a training dataset containing 150 or more peptides is good enough for RT-SVR model construction and the subsequent protein identification. Our study conducted on chromatographic run #9 and #10 proved this point. The RT-SVR model trained with a dataset consisting of 153 examples (dataset #9) yielded an R value of 0.903. This model enabled prediction of 108 proteins when being applied to dataset #9, in contrast with 94 identified by Mascot. However, with the RT-SVR model (R value is 0.874) trained with 57 peptides in chromatographic #10, only 40 proteins were identified in comparison to 44 proteins discovered by Mascot.
Figure 4.

The performance of RT-SVR model as a function of the number of training examples. Data are obtained from dataset #1. Each data point represents the average value of 3 replicates.
3.3 The contribution from features to retention time
According to previous studies[14], retention time of a peptide is determined by hydrophobicity of each amino acid residue, retaining property at C- or N-termini, structure and size of the peptide. Given the complex factors that could impact on retention time, it is meaningful to evaluate the overall contribution of each feature we used in this study to allow fine tune of the prediction model. Although we did not employ linear-kernel RT-SVR for protein identification, this model provides a benefit for the study of the contribution of every feature to retention time. It is worth noting that “retention contribution” here is different from the traditionally defined “hydrophobicity”. Figure 5 demonstrates the contributions of several features including 20 amino acid residues, C-terminal R or K, length and mass of peptides. N-terminal amino acid residues were not shown because they exhibited similar contributions to the individual residues. Thus, the retention properties of N-terminal residues can be represented by those individual amino acid residues. The retention contributions were extracted from linear-kernel RT-SVR trained with dataset run #1 to #9, respectively. As shown in top panel, the average retention contributions with associated standard deviations as error bars are plotted with the features. Hydrophobic residues such as I, L, F and W have greater positive contributions while hydrophilic ones like K and R provides greater negative contributions. Although there is minimal contribution from C-terminal R or K, the length and mass make greater positive contributions. These observations are consistent with the theoretical prediction: large, more hydrophobic molecules tend to be retained longer as separated with RPLC. The bottom panel shows individual retention contributions from features for different chromatographic runs. As expected, although similar trends have been observed, changes are not consistent across varying chromatographic runs. This observation suggests that it is necessary to train a specific RT-SVR model for every chromatographic run.
Figure 5.

Retention contributions of some features. Shown are the weights from linear-kernel RT-SVR corresponding to 20 amino acid residues, C-terminal R or K, length and mass. a) Average retention contribution (standard deviation shown as error bars); b) Individual contributions for each dataset.
3.4. Application of RT-SVR to protein identification
For massive proteomic data analysis, Mascot is commonly employed as one of the most popular database search engines for peptide and protein identifications. Mascot scores the similarity between the experimental MS/MS spectrum of a precursor and the theoretical MS/MS spectrum of a database sequence and reports peptide-spectrum matches with the highest score. Mascot identity threshold (MIT) or homology threshold (MHT) is used as the cut-off score threshold to filter out low-confidence peptide identifications. The peptide identifications are reported as confident target or decoy PSMs if their scores exceed a threshold, and then FDR is estimated as the fraction of the number of false positives (confident decoy PSMs) in the total number of positives (confident target PSMs). A customer-defined parameter, called significance level p, can be adjusted to obtain different FDRs and positive peptide identifications as well. In proteomic studies, a FDR around 1% is generally accepted as confident identifications. Although this method of FDR estimation is easy to follow, it may encounter a counterintuitive problem: an identical FDR may lead to different number of PSMs[27]. This results in unreliable assessment of peptide identifications using conventional Mascot search strategy. In addition, algorithmic bias on scoring PSMs may also lead to wrong peptide predictions.
RT-SVR uses retention time as an additional useful feature to reevaluate these peptide identifications. It will not only re-rank high-confidence PSMs but also rescue low-confidence PSMs. Instead of using FDR, we adopted a specific q value metric which is facilitated with retention time deviation to assess statistical significance of peptide identifications. Although q value estimation is widely used to assess the database search results, it has never been used in the retention time based machine learning technique such as the RT-SVR model described in this study. To the best of our knowledge, our work represents the first attempt to introduce and implement the concept of q value estimation to this unique application.
For proteomic studies the RT-SVR model needs to be implemented for the application dataset (Mascot results) produced from the same chromatographic run that is used for model construction. To increase data space and accommodate more low-confidence PSMs to be rescued, the application dataset needs to be obtained from Mascot results at a high FDR (e.g. FDR ~10%). In this study, we ran a simultaneous target-decoy Mascot database search on all chromatographic runs (database search criteria are the same except precursor tolerance is 1.2 Da) with a p value of 0.10 (approximately FDR ~10%) to produce all application datasets (from #1 to #10). We then applied every RT-SVR model to the corresponding dataset from #1 to #9 (dataset #10 is used as performance comparison only) and generated the retention time deviation for each PSM in each dataset. q value was then calculated for each target PSM followed by screening of PSMs at a q value threshold of 0.01. The results are summarized in Table 3. As expected, the number of PSMs and proteins identified by RT-SVR are larger than those by Mascot (MIT) for each dataset, which is due to the fact that some low-confidence PSMs have been recovered by RT-SVR. Figure 6 shows the comparison of the number of confident PSMs obtained by RT-SVR method and Mascot identity threshold (MIT), respectively. As seen, the number of predicted PSMs increases by a range of values from 18.7% (as in dataset #6) to 165% (as in dataset #8), which corresponds to an increase of 4.3% and 89.4% additional unique peptides, respectively.
Table 3.
The results for peptide and protein identifications when applying RT-SVR model with q value assessment on each application dataset.
| Run | PSM(FDR) p=0.10 |
Protein p=0.10 |
ΔRT/min | PSM (FDR=1%, q=0.01) | Protein (FDR=1%, q=0.01) | ||||
|---|---|---|---|---|---|---|---|---|---|
| RT-SVR | MIT | Overlap% | RT-SVR | MIT | Overlap% | ||||
| 1 | 1488 (7.5%) | 174 | ±2.91 | 678 | 329 | 95 | 158 | 135 | 96 |
| 2 | 1947 (7.4%) | 195 | ±0.96 | 419 | 269 | 92 | 127 | 92 | 90 |
| 3 | 1508 (9.3%) | 199 | ±0.25 | 291 | 232 | 87 | 124 | 103 | 89 |
| 4 | 1440 (9.2%) | 172 | ±0.50 | 275 | 196 | 92 | 119 | 92 | 91 |
| 5 | 1906 (9.6%) | 211 | ±0.80 | 425 | 222 | 80 | 147 | 129 | 86 |
| 6 | 2016 (9.5%) | 191 | ±0.21 | 337 | 284 | 87 | 125 | 110 | 93 |
| 7 | 3430 (19.9%) | 248 | ±0.61 | 428 | 240 | 93 | 152 | 120 | 93 |
| 8 | 2312 (10.9%) | 209 | ±2.53 | 716 | 270 | 94 | 167 | 91 | 96 |
| 9 | 1261 (9.7%) | 159 | ±1.00 | 253 | 175 | 87 | 108 | 94 | 89 |
The specified q value is 0.01. The application dataset is obtained from Mascot search at a p value of 0.10. The PSMs and protein hits from Mascot identity threshold (MIT) are at a FDR of 1%. The PSMs and protein hits from RT-SVR are at a q value of 0.01. Overlap% is calculated as the number of identifications that are identified by both Mascot and RT-SVR divided by the total number of identifications by Mascot only.
Figure 6.

The plots of PSMs versus q value or FDR. The curves of PSMs over FDR (for MIT and MHT) are counterintuitive around 1% FDR. The plot of PSMs over q value (for RT-SVR) resolves this issue. Comparison indicates that RT-SVR outperforms MIT and MHT. The results are obtained from application dataset #2.
The use of q value metric other than FDR resolves the counterintuitive issue. Figure 7 shows the comparison of q value and FDR for the statistical validation of the same dataset #2. Dotted lines show the PSMs obtained from MIT and MHT over FDR while the solid line represents the PSMs over q value. A counterintuitive issue can be seen around ~1% FDR at which two different numbers of PSMs correspond to the same FDR value. As a comparison, no ambiguity issue is found for q value assessment. This is because the ambiguity is resolved mathematically by q value that is defined as the minimal FDR for any specific PSM. The primary distinction between the FDR and the q value is that the former is a property of a set of PSMs, whereas the latter is a property of a single PSM. We can therefore associate a unique q value with every target PSM in our dataset. It is worth noting that q value is equivalent to FDR because it is a statistical estimate based on the whole dataset although it is assigned to a single PSM [28, 33].
Figure 7.

The comparison of PSMs identified with RT-SVR and MIT at a q value of 0.01.
q value threshold is user-defined and can be adjusted (as p value in Mascot search) to result in different Δ RT thresholds. The distribution of q value over Δ RT for dataset #2 is plotted in Figure 8. As we can see, the specified q value of 0.01 defines a Δ RT threshold of ± 0.96 min, which identifies 419 target PSMs as the confident peptide identifications. If we increase the q value to 0.02, which defines a Δ RT threshold of ±4.8min, 978 PSMs would be identified. This flexibility of user-defined q value is beneficial when one wants to study more peptides with slightly higher false positive rate.
Figure 8.

The distribution of q value over RT error (Δ RT). Δ RT threshold depends on q value. Data obtained from dataset #2.
The use of q value as the cut-off threshold to assess the confidence of peptide identifications overcomes the limitations of using a fixed Δ RT threshold as in previous studies [22, 24]. Randomly choosing or training a fixed Δ RT threshold to cut off predicted peptides often results in more false positives or lose true positives. Here, the specified q value such as 0.01 defines the selection of a dynamic Δ RT threshold for a given dataset. Figure 9 demonstrates the selection of Δ RT threshold for all 9 application datasets. Datasets #3 and #6 show small Δ RT thresholds (±0.25 min and ±0.21min respectively), which correspond to a small number of PSMs identified. In contrast, datasets #1 and #8 have large Δ RT thresholds (± 2.91 min and ±2.53 min respectively), which lead to an increase of the number of peptide identifications. The different selection of Δ RT thresholds is determined by the performance of the corresponding RT-SVR model and the quality of application dataset. Regardless of the Δ RT threshold, the accuracy of the peptide predictions is only determined by q value.
Figure 9.

The dynamic Δ RT thresholds for all 9 datasets are determined by a specified q value of 0.01. The number on top of each bar represents the upper bound of Δ RT threshold while the lower bound not shown has the same value but negative sign.
3.5 Inclusion of mascot identity threshold (MIT) into RT-SVR to increase prediction coverage
Table 3 shows that approximately 10% peptide identifications obtained by MIT method (at FDR 1%) fail to be identified by the RT-SVR model. This is in part due to model bias that considers some valid PSMs as outliers. To address this issue, we incorporated MIT into RT-SVR to obtain maximal coverage of peptide identifications. As two parallel approaches, MIT identifies peptides at a FDR of 1% while RT-SVR identifies peptides at a q value of 0.01 following the proposed protocols. Finally, we compile MIT and RT-SVR results together to produce the final report. By this means, we rescued all missed peptide identifications. Sample results from dataset #1 are provided in supplementary Table S3.
3.6 General applicability of the RT-SVR to proteomic data acquired on other MS platforms
In order to investigate the general applicability of our approach to shotgun proteomics data obtained using other MS instruments, we selected datasets acquired on a Thermo LTQ mass spectrometer due to its widespread use in large-scale proteomics studies. Two duplicate datasets of Yeast shotgun proteomics raw data were downloaded from PeptideAtlas (PAe001337). The details about raw data, search parameters and Trans-Proteomic Pipeline (TPP) results can be seen via ftp://ftp.peptideatlas.org/pub/PeptideAtlas/Repository/PAe001337. The raw data were converted into mgf data with MM file conversion tool (http://www.massmatrix.net/mm-cgi/downloads.py). The resulting mgf data were then searched with Mascot against SwissProt yeast database. We used the same search parameters as those shown online. Following the protocols we proposed in this study, for each dataset, we constructed a RT-SVR model based on Mascot results at FDR~1% and then applied the model to the larger Mascot searching results at p=0.10. In total, the RT-SVR resulted in 566 unique protein identifications from two duplicate datasets at a q value of 0.01, while Mascot (MIH) predicted 470 unique proteins at a FDR of 1% and TPP reported 499 unique proteins with a probability filter of 0.010. The proteins identified by RT-SVR are summarized in supplementary Table S4. Thus, we believe that RT-SVR method can also offer superior performance for MS-based proteomic analysis using LTQ platform.
4. Conclusions
Retention time, as one of the characteristic properties of a peptide sequence, can be used for distinguishing the confident peptide identifications from the false positives. Models that are built to predict retention time often fail to perform as expected if one simply assumes a linear correlation between RT and other intrinsic properties of a peptide. Support vector regressor with a Gaussian kernel is superior to others due to nonlinear regression and small dataset requirements. The peptides in training and test datasets affect the performance of a SVR model. Correct peptide identifications extracted from Mascot results at a FDR of 1% are favored. Given that Gaussian distribution regulates peptide separation and MS acquisition, multiple PSMs rather than unique peptides are chosen to produce training dataset and a better RT-SVR model can be trained. The size of training dataset also affects the performance of the RT-SVR model. According to our study, a dataset consisting of 150 confident peptides will lead to a high performance model (R > 0.900). Given the variation of retention time contributions from the features with chromatographic conditions, a specific RT-SVR model is needed for each chromatographic run.
When applying the trained RT-SVR model to a real dataset for peptide or protein identification, the main issue is how to accurately and effectively assess the confidence of the predictions. The method of choice in this study is q value estimation. According to our knowledge, this is the first report on the application of q value assessment to RT prediction. q value is calculated based on target-decoy search and resolves the counterintuitive issue caused by traditional FDR method. With q value assessment, peptides can be unambiguously identified. In this study, by using q value assessment, we have shown that RT-SVR model substantially outperforms Mascot, in the best case identifying 89.4% more peptides and 83.5% more proteins than using Mascot identity threshold at a q value of 0.01. These results suggest that the RT-SVR model with q value assessment has a great potential as a post-Mascot analysis tool to improve protein identifications in shotgun proteomics. The software package is written in Java and the windows-based graphical user interface can be freely downloaded from http://pages.cs.wisc.edu/~yadi/bioinfo/rtsvr/rtsvr.html.
Supplementary Material
Acknowledgments
This work was supported in part by a Department of Defense Pilot Award (W81XWH-11-1-0181), National Science Foundation (CHE-0957784), and National Institutes of Health through grant 1R01DK071801. L.L. acknowledges a Vilas Associate Award and an H.I. Romnes Research Fellowship.
ABBREVIATIONS
- NKL
natural killer leukemia cell line
- RPLC
reversed phase liquid chromatography
- MS/MS
tandem mass spectrometry
- PSM
peptide spectrum match
- RT
retention time
- Δ RT
deviation between predicted and experimental RT
- SVR
support vector regressor
- FDR
false discovery rate
- MIT
Mascot identity threshold
- MHT
Mascot homology threshold
Footnotes
SUPPORTING INFORMATION AVAILBALE
Publisher's Disclaimer: This is a PDF file of an unedited manuscript that has been accepted for publication. As a service to our customers we are providing this early version of the manuscript. The manuscript will undergo copyediting, typesetting, and review of the resulting proof before it is published in its final citable form. Please note that during the production process errors may be discovered which could affect the content, and all legal disclaimers that apply to the journal pertain.
Contributor Information
Weifeng Cao, Email: wcao2@wisc.edu.
Lingjun Li, Email: lli@pharmacy.wisc.edu.
References
- 1.Hunt DF, Michel H, Dickinson TA, Shabanowitz J, Cox AL, Sakaguchi K, et al. Peptides presented to the immune system by the murine class II major histocompatibility complex molecule I-Ad. Science. 1992;256:1817–20. doi: 10.1126/science.1319610. [DOI] [PubMed] [Google Scholar]
- 2.Wolters DA, Washburn MP, Yates JR., 3rd An automated multidimensional protein identification technology for shotgun proteomics. Anal Chem. 2001;73:5683–90. doi: 10.1021/ac010617e. [DOI] [PubMed] [Google Scholar]
- 3.Foster LJ, de Hoog CL, Zhang Y, Xie X, Mootha VK, Mann M. A mammalian organelle map by protein correlation profiling. Cell. 2006;125:187–99. doi: 10.1016/j.cell.2006.03.022. [DOI] [PubMed] [Google Scholar]
- 4.Eng JK, Mccormack AL, Yates JR. An Approach to Correlate Tandem Mass-Spectral Data of Peptides with Amino-Acid-Sequences in a Protein Database. J Am Soc Mass Spectr. 1994;5:976–89. doi: 10.1016/1044-0305(94)80016-2. [DOI] [PubMed] [Google Scholar]
- 5.Perkins DN, Pappin DJ, Creasy DM, Cottrell JS. Probability-based protein identification by searching sequence databases using mass spectrometry data. Electrophoresis. 1999;20:3551–67. doi: 10.1002/(SICI)1522-2683(19991201)20:18<3551::AID-ELPS3551>3.0.CO;2-2. [DOI] [PubMed] [Google Scholar]
- 6.Craig R, Beavis RC. TANDEM: matching proteins with tandem mass spectra. Bioinformatics. 2004;20:1466–7. doi: 10.1093/bioinformatics/bth092. [DOI] [PubMed] [Google Scholar]
- 7.Geer LY, Markey SP, Kowalak JA, Wagner L, Xu M, Maynard DM, et al. Open mass spectrometry search algorithm. J Proteome Res. 2004;3:958–64. doi: 10.1021/pr0499491. [DOI] [PubMed] [Google Scholar]
- 8.Elias JE, Haas W, Faherty BK, Gygi SP. Comparative evaluation of mass spectrometry platforms used in large-scale proteomics investigations. Nat Methods. 2005;2:667–75. doi: 10.1038/nmeth785. [DOI] [PubMed] [Google Scholar]
- 9.Cargile BJ, Bundy JL, Stephenson JL., Jr Potential for false positive identifications from large databases through tandem mass spectrometry. J Proteome Res. 2004;3:1082–5. doi: 10.1021/pr049946o. [DOI] [PubMed] [Google Scholar]
- 10.Qian WJ, Liu T, Monroe ME, Strittmatter EF, Jacobs JM, Kangas LJ, et al. Probability-based evaluation of peptide and protein identifications from tandem mass spectrometry and SEQUEST analysis: the human proteome. J Proteome Res. 2005;4:53–62. doi: 10.1021/pr0498638. [DOI] [PubMed] [Google Scholar]
- 11.Petritis K, Kangas LJ, Yan B, Monroe ME, Strittmatter EF, Qian WJ, et al. Improved peptide elution time prediction for reversed-phase liquid chromatography-MS by incorporating peptide sequence information. Anal Chem. 2006;78:5026–39. doi: 10.1021/ac060143p. [DOI] [PMC free article] [PubMed] [Google Scholar]
- 12.Mant CT, Zhou NE, Hodges RS. Correlation of protein retention times in reversed-phase chromatography with polypeptide chain length and hydrophobicity. J Chromatogr. 1989;476:363–75. doi: 10.1016/s0021-9673(01)93882-8. [DOI] [PubMed] [Google Scholar]
- 13.Mant CT, Hodges RS. Context-dependent effects on the hydrophilicity/hydrophobicity of side-chains during reversed-phase high-performance liquid chromatography: Implications for prediction of peptide retention behaviour. J Chromatogr A. 2006;1125:211–9. doi: 10.1016/j.chroma.2006.05.063. [DOI] [PMC free article] [PubMed] [Google Scholar]
- 14.Krokhin OV, Craig R, Spicer V, Ens W, Standing KG, Beavis RC, et al. An improved model for prediction of retention times of tryptic peptides in ion pair reversed-phase HPLC: its application to protein peptide mapping by off-line HPLC-MALDI MS. Mol Cell Proteomics. 2004;3:908–19. doi: 10.1074/mcp.M400031-MCP200. [DOI] [PubMed] [Google Scholar]
- 15.Baczek T, Wiczling P, Marszall M, Heyden YV, Kaliszan R. Prediction of peptide retention at different HPLC conditions from multiple linear regression models. J Proteome Res. 2005;4:555–63. doi: 10.1021/pr049780r. [DOI] [PubMed] [Google Scholar]
- 16.Petritis K, Kangas LJ, Ferguson PL, Anderson GA, Pasa-Tolic L, Lipton MS, et al. Use of artificial neural networks for the accurate prediction of peptide liquid chromatography elution times in proteome analyses. Anal Chem. 2003;75:1039–48. doi: 10.1021/ac0205154. [DOI] [PubMed] [Google Scholar]
- 17.Shinoda K, Sugimoto M, Yachie N, Sugiyama N, Masuda T, Robert M, et al. Prediction of liquid chromatographic retention times of peptides generated by protease digestion of the Escherichia coli proteome using artificial neural networks. J Proteome Res. 2006;5:3312–7. doi: 10.1021/pr0602038. [DOI] [PubMed] [Google Scholar]
- 18.Palmblad M, Ramstrom M, Markides KE, Hakansson P, Bergquist J. Prediction of chromatographic retention and protein identification in liquid chromatography/mass spectrometry. Anal Chem. 2002;74:5826–30. doi: 10.1021/ac0256890. [DOI] [PubMed] [Google Scholar]
- 19.Kawakami T, Tateishi K, Yamano Y, Ishikawa T, Kuroki K, Nishimura T. Protein identification from product ion spectra of peptides validated by correlation between measured and predicted elution times in liquid chromatography/mass spectrometry. Proteomics. 2005;5:856–64. doi: 10.1002/pmic.200401047. [DOI] [PubMed] [Google Scholar]
- 20.Palmblad M, Ramstrom M, Bailey CG, McCutchen-Maloney SL, Bergquist J, Zeller LC. Protein identification by liquid chromatography-mass spectrometry using retention time prediction. J Chromatogr B Analyt Technol Biomed Life Sci. 2004;803:131–5. doi: 10.1016/j.jchromb.2003.11.007. [DOI] [PubMed] [Google Scholar]
- 21.Strittmatter EF, Kangas LJ, Petritis K, Mottaz HM, Anderson GA, Shen Y, et al. Application of peptide LC retention time information in a discriminant function for peptide identification by tandem mass spectrometry. J Proteome Res. 2004;3:760–9. doi: 10.1021/pr049965y. [DOI] [PubMed] [Google Scholar]
- 22.Klammer AA, Yi X, MacCoss MJ, Noble WS. Improving tandem mass spectrum identification using peptide retention time prediction across diverse chromatography conditions. Anal Chem. 2007;79:6111–8. doi: 10.1021/ac070262k. [DOI] [PubMed] [Google Scholar]
- 23.Le Bihan T, Robinson MD, Stewart, Figeys D. Definition and characterization of a “trypsinosome” from specific peptide characteristics by nano-HPLC-MS/MS and in silico analysis of complex protein mixtures. J Proteome Res. 2004;3:1138–48. doi: 10.1021/pr049909x. [DOI] [PubMed] [Google Scholar]
- 24.Krokhin OV. Sequence-specific retention calculator. Algorithm for peptide retention prediction in ion-pair RP-HPLC: application to 300- and 100-A pore size C18 sorbents. Anal Chem. 2006;78:7785–95. doi: 10.1021/ac060777w. [DOI] [PubMed] [Google Scholar]
- 25.Storey JD, Xiao W, Leek JT, Tompkins RG, Davis RW. Significance analysis of time course microarray experiments. Proc Natl Acad Sci U S A. 2005;102:12837–42. doi: 10.1073/pnas.0504609102. [DOI] [PMC free article] [PubMed] [Google Scholar]
- 26.Kall L, Storey JD, MacCoss MJ, Noble WS. Posterior error probabilities and false discovery rates: two sides of the same coin. J Proteome Res. 2008;7:40–4. doi: 10.1021/pr700739d. [DOI] [PubMed] [Google Scholar]
- 27.Kall L, Storey JD, MacCoss MJ, Noble WS. Assigning significance to peptides identified by tandem mass spectrometry using decoy databases. J Proteome Res. 2008;7:29–34. doi: 10.1021/pr700600n. [DOI] [PubMed] [Google Scholar]
- 28.Kall L, Canterbury JD, Weston J, Noble WS, MacCoss MJ. Semi-supervised learning for peptide identification from shotgun proteomics datasets. Nat Methods. 2007;4:923–5. doi: 10.1038/nmeth1113. [DOI] [PubMed] [Google Scholar]
- 29.Brosch M, Yu L, Hubbard T, Choudhary J. Accurate and sensitive peptide identification with Mascot Percolator. J Proteome Res. 2009;8:3176–81. doi: 10.1021/pr800982s. [DOI] [PMC free article] [PubMed] [Google Scholar]
- 30.Moruz L, Tomazela D, Kall L. Training, selection, and robust calibration of retention time models for targeted proteomics. J Proteome Res. 2010;9:5209–16. doi: 10.1021/pr1005058. [DOI] [PubMed] [Google Scholar]
- 31.Huttlin EL, Hegeman AD, Harms AC, Sussman MR. Prediction of error associated with false-positive rate determination for peptide identification in large-scale proteomics experiments using a combined reverse and forward peptide sequence database strategy. J Proteome Res. 2007;6:392–8. doi: 10.1021/pr0603194. [DOI] [PMC free article] [PubMed] [Google Scholar]
- 32.Bland JM, Altman DJ. Regression analysis. Lancet. 1986;1:908–9. doi: 10.1016/s0140-6736(86)91008-1. [DOI] [PubMed] [Google Scholar]
- 33.Spivak M, Weston J, Bottou L, Kall L, Noble WS. Improvements to the percolator algorithm for Peptide identification from shotgun proteomics data sets. J Proteome Res. 2009;8:3737–45. doi: 10.1021/pr801109k. [DOI] [PMC free article] [PubMed] [Google Scholar]
Associated Data
This section collects any data citations, data availability statements, or supplementary materials included in this article.