

Abstract
Leptin is a master regulator of energy homeostasis. Its expression, prevalently localized in adipocytes, is positively related to adipose mass. Epigenetics is emerging as an important contributor to the changes in gene expression undergone by adipose tissue during obesity. We herein investigated the involvement of methylation-dependent mechanisms in leptin regulation in humans. We studied the methylation profile of a 305 bp region in the leptin promoter and analyzed the correspondent leptin expression in visceral adipocyte fraction (AF) and stromal vascular fraction (SVF) of white adipose tissue (WAT) and liver. We found an inverse relationship between methylation and leptin expression with AF displaying a lower methylation density (8%) than SVF and liver (18%, 21%). We evidenced a hot spot region, which mostly differentiates AF versus liver. This includes C15 and 21, which are within the recognition sequences for the transcription factors Sp1 and C/EBP, and C22–23/24, flanking a TATA box. In vitro studies demonstrated that demethylation (by decitabine) increases or de novo activates leptin expression in primary fibroblasts and HeLa cells, respectively. A longitudinal study carried out in patients analyzed before and after bariatric surgery-induced weight loss indicated that in this case decrease in WAT leptin expression (about 50%) does not correspond to changes in promoter methylation density. In conclusion, methylation density in the leptin promoter constitutes one control level for cell type specific leptin expression, whereas weight-loss induced changes in leptin expression does not seem to be methylation-dependent.
Key words: leptin, methylation, CpG islands, adipocyte, gastric bypass, weight loss, tissue specificity, decitabine
Introduction
Leptin (the product of the ob gene) is considered a main player in the regulation of energy homeostasis.1 The close and positive relationship existing between leptin expression and individual adiposity sets the basis for leptin being the afferent signal from the periphery, informing the center about the status of the energy stores.2 Leptin concentration does not only influence body weight regulation and eating behavior, but is a key regulator of several other functions including among others: reproduction, bone homeostasis, maturation of the immune system, insulin sensitivity.1,3
Regulation of leptin expression is therefore crucial for the fine tuning of vital functions and is under the control of several factors, including insulin, glucocorticoids and TNFα.4 Originally defined as a white adipose tissue (WAT) specific factor, with the progressive increase in sensitivity of techniques adopted for RNA detection, leptin expression has been eventually reported in other tissues. Presence of leptin transcripts have been in fact found in placenta, liver, skeletal muscle, stomach and interestingly in certain brain regions during the developmental stages.5 Differently from what found in WAT, for which leptin represents a hallmark of specificity, in the other mentioned tissues leptin presence, always found at much lower abundance, is related to specific conditions that include for instance induction by colecistochinine 8 in the stomach or by hexosamine in the muscle.6 Mechanisms in place to switch on/off leptin expression are still a matter of investigation.
Since leptin cloning a major effort has been dedicated to the search for cis-regulatory elements flanking leptin sequence. Of relevance Sp1, LP1 and C/EBP elements have been identified in the 5′ promoter region of leptin and all seem to contribute independently to hormonal and metabolic regulation of the hormone.7 In a recent study Birsoy and coworkers utilized an elegant in vivo imaging approach with a transgenic mouse strain expressing a luciferase reporter gene under the control of leptin regulatory sequences. They found that the DNA elements required for qualitative and quantitative expression of the leptin gene reside between −22 and +150 Kb of the transcription start site of the leptin gene.8 Their findings demonstrated the contribution of cis-elements in the regulation of leptin expression, but they did not provide any explanation on how this may take place. In addition transcription factors so far implied in leptin regulation are not WAT specific, thus suggesting that constraints other than their presence in a given tissue limit leptin expression. Specifically, Sp1 belongs to a family of ubiquitously expressed C(2)H(2)-type zinc finger-containing DNA binding proteins that activate or repress transcription of many genes in response to general physiological and pathological stimuli.9 Concerning C/EBP, it is a family of transcription factors that control cell proliferation and terminal differentiation in a variety of cells including hepatocytes,10,11 gut epithelial cells,12 macrophages,13 myelomonocytes14 and neurons.15
Leptin expression is importantly regulated by obesity: increase in adipose mass results in significant leptin induction, and consistently, during weight loss, leptin expression in WAT is reduced.16 This characteristic is common to several other adipokines and it is now accepted that variations in the level of these factors contribute to the onset of obesity related complications including insulin resistance, inflammation, atherosclerosis.17
In the recent years epigenetic regulation of gene expression emerged as an important contributor to the changes in size, cytology and morphology undergone by adipocytes during obesity.18,19 A better comprehension of the epigenetic mechanisms affecting weight homeostasis and in particular leptin regulation may be useful for a further understanding of the molecular mechanisms implied in excessive fat deposition and the associated complications, and eventually lead to the implementation of new therapeutic approaches.
DNA methylation is one of the best characterized epigenetic modifications which is carried out by DNA methyltransferases (DNMTs) and it is believed to be a reversible process, although mechanisms of active DNA methylation remain partially unraveled.20,21
In mammalian genomes DNA methylation involves the addition of a methyl group to the 5′ position of the cytosine pyrimidine ring and occurs predominantly within the CpG dinucleotides, grouped in clusters, called CpG islands. They are typically 300–3,000 base pairs in length and are present in and nearby approximately 40% of mammalian gene promoters.22 The relationship between methylation of the leptin (LEP) promoter and leptin expression has been mostly investigated in vitro during adipose conversion. Melzner and collaborators provided evidence that methylation in the LEP promoter region is a crucial determinant of leptin expression. In particular they reported a general drop in methylation going from human preadipocytes, not expressing leptin (73% of methylation), to adipocytes (less than 10% methylation). Collas and coworkers investigated how methylation density in the LEP promoter region (27 CpGs are considered) is associated to adipose conversion potential and leptin transcription in various human mesenchymal cell (MCs) types the origin of which included: adipose tissue (ASCs), bone marrow, muscle and embryonic stem cells (hESCs).23–25 Their findings revealed a hypermethylated pattern in the latter, likely implied in the restricted capacity to undergo adipose conversion of hESC. Regarding the three formers, they found a hypomethylated pattern of LEP promoter in all MCs, which hardly change upon induction of adipogenesis regardless of their differentiation potential. Further, they did not find any relationship between overall density of LEP promoter methylation and leptin mRNA abundance in any of the conditions examined in ASCs including differentiated versus undifferentiated cells, senescent versus not senescent cells. Exceptions to this general lack of correspondence between promoter methylation and leptin regulation is found at 6 CpGs including, among others, those flanking the TATA box and that present within the C/EBP binding site26 all significantly less methylated upon adipose conversion.
Finally Jousse and colleagues conducted a study on the role of nutritional imprint on leptin regulation in mouse. They reported that nutritional stress on the mother resulted in the removal of methyl groups from CpGs in the promoter region of the leptin gene in the offspring, determining a permanent modification in the dynamics of leptin gene expression, with enhanced induction of the hormone in response to a meal.27
Methylation patterns are established during ontogeny and were previously believed to be stably maintained in fully differentiated cells.28 Compared with other epigenetic modifications, DNA methylation is thought to be relatively stable thanks to the strength of its covalent bound. Despite its role in long-term gene silencing, DNA methylation is more dynamic than originally thought. Methylation patterns can change in adult cells, altering gene expression and contributing to carcinogenesis, autoimmunity, senescence,29–32 and active DNA demethylation has been observed during specific stages of development33 and in long term memory consolidation in the adult CNS (reviewed in ref. 34). Emerging findings showed that DNA methylation/demethylation takes place in terminally differentiated cells like neurons.34 For instance several evidences support the idea that DNA methylation is involved in memory formation in the adult CNS. It has been demonstrated that de novo DNMT expression is upregulated in the adult rat hippocampus after contextual fear conditioning and blocking DNMT activity blocked contextual fear conditioning.35–38
Losing or gaining weight during adulthood implies important changes in the adipose tissue that are not limited to its size or distribution, but affects its cellularity,39 physiology and gene expression profile (reviewed in ref. 40). The tissue is in fact substantially remodeled in order to store or to loose considerable amounts of energy stores: the molecular mechanisms underlying such changes are still a matter of investigation.
We herein investigated the relationship between methylation density on LEP promoter and cell-type-determined leptin gene expression. We chose adult cell types/tissues that cover a wide range of leptin gene expression in steady (stable weight) conditions including: WAT Adipocyte fraction (AF), WAT Stromal Vascular Fraction (SVF) and liver. Further, based on the concept outlined above, namely possibility of changes in methylation patterns in differentiated cells, we carried out a longitudinal study to ask whether changes in adipose tissue size, occurring intra-vitam in humans, may lead to rearrangements of the LEP promoter methylation density.
Results
Steady state leptin gene expression in different tissues.
The primary site of leptin gene expression is WAT. However, other tissues have been reported to express leptin gene, despite at lower level. Our first goal was to investigate the relationship between leptin transcript abundance and LEP promoter methylation status in tissues belonging to the same pool of obese adult individuals that had maintained their body weight stable in the previous 12 months. To address this issue we collected biopsies of liver and visceral (VISC) WAT from six patients. WAT was split into its two major components AF and SVF. We compared leptin expression levels of AF, SVF and liver by real time PCR. Our results indicate that AF, as expected, is the tissue with the most abundant leptin expression, that leptin mRNA is present in the SVF (less than half of the expression found in AF) whereas is almost undetectable in liver (Fig. 1A). Given the previously reported difference between leptin gene expression in subcutaneous (SC) and VISC WAT,41,42 we wanted to analyze this aspect in a group of patients (n = 3) for which these biopsies were available. As shown in Figure 1B leptin expression tended to be higher in AF from SC WAT versus VISC WAT. We next asked whether leptin expression in these tissues is associated with a particular methylation signature on the LEP promoter.
Figure 1.
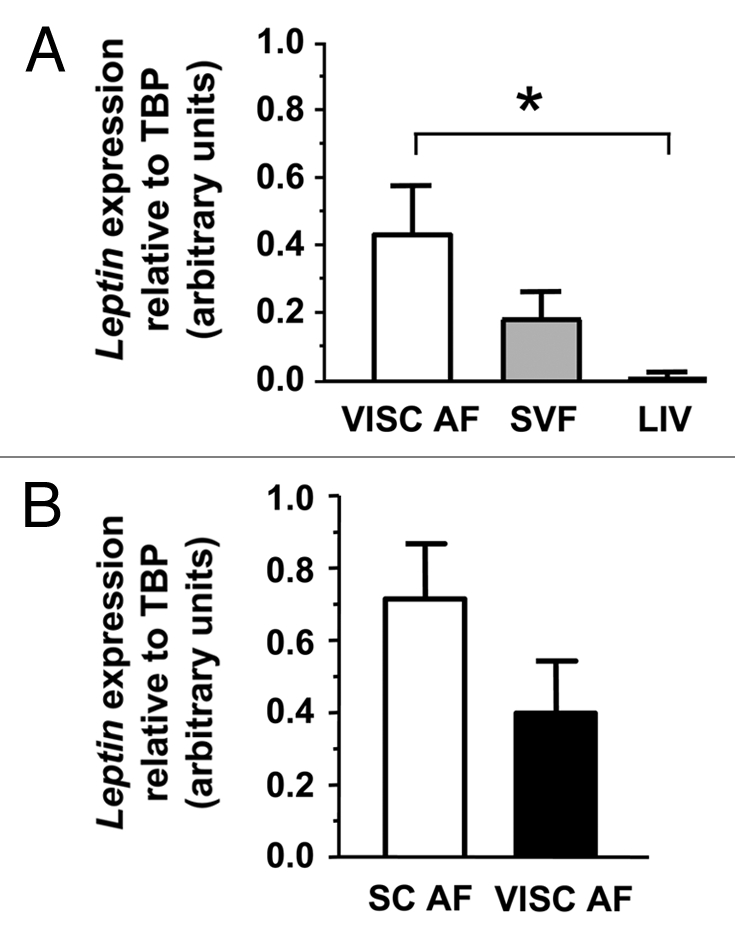
Leptin expression in different tissues. Leptin mRNA abundance (expressed in arbitrary units) in VISC AF, VISC SVF and Liver of 6 patients (A), and in SC AF versus VISC AF (n = 3) (B) quantified by Real-Time PCR and normalized against that of Tata Binding Protein (TBP). SE, error bars. One-way repeated measures ANOVA, post-hoc test with Bonferroni adjustment *p < 0.05.
Methylation profiling of LEP promoter in different tissues.
We selected a region of 305 pb of the human LEP promoter, spanning from −226 to +79 with respect to the Transcription Start Site (TSS), which includes 31 cytosines in CpG dinucleotides (Fig. 2A). The methylation status was evaluated by three different parameters: (1) the Overall Methylation (OM), which is the percentage of methylated CpGs measured across all the epialleles analyzed, independently of CpG localization; (2) the number of fully UnMethylated Epialleles (UME) and; (3) the number of UnMethylated CpG sites (UMC). All three were expressed in terms of percentage.
Figure 2.

Methylation density in LEP promoter region. (A) Schematization of the 3′ LEP promoter region we investigated, which spans from −279 to +79 respect to the Transcription Start Site (TSS) for a total length of 305 bp. Initiation of translation is also indicated. Red vertical lines represents the 31 CpGs identified. Region localization on human Chromosome 7 is reported, as annotated in the NCBI genebank database. (B and C) Cumulative analysis of the methylation frequency in AF, SVF and liver from human biopsies (n = 6). (B) Quantification of the Overall Methylation, OM (upper panel), UME and UMC (lower panel) for each kind of tissue, statistically adjusted for the number of epialleles analyzed. One-way ANCOVA; post-hoc test with Bonferroni adjustment: AF vs. SVF and AF vs. LIV, *p < 0.05, **p < 0.01; (C) Representative methylation pattern for each tissue of one patient. Epialleles are displayed in rows; CpG positions are displayed in columns (progressive numbering at the top, base-pair localization at the bottom). Black dots: methylated CpGs; white dots: un-methylated CpGs. (D) Quantification of the Overall Methylation in AF from SC and VISC WAT (n = 3). (E) Leptin expression is inversely correlated to the overall methylation in VISC adipocytes from 6 obese patients (R2 = 0.83, p < 0.01).
OM gives information about the averaged methylation amount and, notwithstanding the high variability of cytosine methylation within different epialleles, we found that VISC AF showed a generalized lower level of methylation (OM = 8.3% ± 2.3) with respect to SVF and liver, that are characterized by more densely methylated patterns (respectively OM = 18.5% ± 2.3 and 20.8% ± 2.4; Fig. 2B upper panel).
By taking into account UME and UMC, we have a better understanding of the distribution of methylated CpGs. UME assessment revealed differences among the 3 tissues with VISC AF UME values, respectively, 5 and 10 times higher than SVF and liver (Fig. 2B lower panel).
UMC focuses on specific CpGs taking into account those that are never methylated and therefore represent crucial regulative residues at a given tissue. Our analysis revealed that AF displays 5 times more unmethylated sites as compared to SVF and liver (Fig. 2B lower panel).
In general methylation level showed an inverse relationship with the correspondent leptin gene expression: VISC AF has in fact the lowest OM value and the highest leptin expression, and consistently, liver shows the highest OM and almost no leptin. Along the same line of findings, methylation density is higher (albeit not significantly) in adipocytes (8.8%) from VISC WAT as compared to SC WAT (6.7%) (Fig. 2D).
Regression analysis performed on VISC AF from single patients provided a significant inverse relationship between leptin relative expression and OM. This is illustrated in the scattergram of Figure 2E (R2 = 0.83) and is in accordance with the general hypothesis that methylation acts as a repressive mechanism of gene transcription. To further clarify which sub-region plays a more prominent role in determining leptin expression, data were analyzed considering the methylation profile across the 31 CpGs under consideration. Figure 3 shows the average methylation percentage of every single CpG of VISC AF and liver, these two tissues displaying the higher difference. AF profile is generally homogeneous and low densely methylated from C1 to 18 (under 10%), while the 3′ terminus (C19–31) is more densely methylated (Fig. 3). Liver profile is always above that of AF, revealing a general higher methylation level, reaching very high peaks for specific positions. The most significant difference between AF and liver emerged for CpGs 3, 21, 22, 23/24 (p < 0.001). Interestingly, CpGs 21, 22 and 23/24 are, respectively, within the recognition sequence for the transcription factor C/EBP and flanking the TATA box region. These “hot spots” are flanked in both 5′ and 3′ ends by other CpGs that display a difference, albeit at lower significance (p < 0.05). In the central region only C15 displays a significant difference (p < 0.05). C15 is within a recognition sequence for the transcription factor Sp1.
Figure 3.

Methylation profiles and critical CpGs. Plot of the mean methylation levels across the 31 CpGs of VISC AF and liver (SE, vertical bars). Log-linear analysis; Bonferroni adjustment for multiple analyses, *p < 0.05; **p < 0.01. Below the x axis, CpGs within or in proximity of target recognition sequences for transcription factors were evidenced. Horizontal bars below asterisks indicate that statistical significance is common to two or more CpGs.
Demethylation is able to increase or reactivate leptin expression.
The above demonstrated inverse relationship between leptin expression and the methylation level of the proximal LEP promoter region suggests that methylation may be one cell specific mechanism involved in silencing leptin expression. To investigate in this direction we designed functional experiments on cell cultures. Two different cell types were considered: primary human fibroblasts, potentially able to undergo adipogenesis if treated with the appropriate hormonal cocktail, and HeLa, an immortalized tumorigenic cell line. Quantitative PCR revealed that leptin transcripts are present, despite at low abundance in the former cell model, whereas leptin expression is completely absent in the latter. We then wanted to investigate the possibility that modulating methylation level would result in changes of leptin gene expression.
We treated both cell types with 100 µM of the demethylating agent decitabine (DAC); duration of the treatment was, respectively, 4 days for fibroblasts and 3 days for HeLa, that display a higher proliferation rate. In both cases DAC treatment, as expected, resulted in a reduced cell proliferation rate (Fig. 4A and C). DAC treatment caused a 7-fold increase of leptin expression as compared to untreated control in fibroblasts (Fig. 4B). A moderate but significant induction of leptin expression was observed also in HeLa cells (Fig. 4D).
Figure 4.

Leptin expression in skin fibroblasts and HeLa. (A, C) Representative images of human primary skin fibroblasts (A) and HeLa cells (C) cultured in normal conditions (Control) and upon decitabine (DAC) treatment, which caused an inhibition of cell growth. Fibroblasts and Hela cells were respectively treated for 4 and 3 days with 100 µM DAC. Calibration bars, 50 µm. (B,D) Leptin expression in DAC versus untreated cells, quantified by Real-Time PCR and normalized against that of TBP. SE, error bars. t-test, *p < 0.05. For each condition at least five wells were considered.
To control the efficacy of DAC treatment, genomic DNA was extracted from cells and processed to evaluate the methylation status of the LEP promoter. Results revealed that DAC induced on average 43% decrease of the overall methylation. Higher demethylation levels (61%) were observed in the region spanning C15/21–24 (Table 1).
Table 1.
Methylation quantification of primary skin fibroblasts treated with the demethylating agent decitabine (DAC) versus untreated cells (CRT)
| Methylation quantification | CRT | DAC | % Fold change (DAC/CRT) |
| TOT met (OM) | 14% | 8% | −43% |
| Un-met. EPIAL. (UME) | 8% | 22% | +275% |
| Un-met. CpG (UMC) | 16% | 78% | +487% |
| Met CpG 15/21-24 | 18% | 7% | −61% |
We analyzed 26 epialleles in control cells and 21 in DAC-treated cells. OM, UME and UMC (see text for explanation) and percentage of methylation at specific positions 15, 21 and 22–23/24 were considered. In the last column on the right the percentage of fold change (increase/decrease, +/−) of DAC-treated cells versus control is reported.
Role of methylation in the reduced leptin expression observed in patients undergoing gastric bypass surgery.
Difference in leptin expression due to tissue specificity (and then to a typically chronic condition) seem to be at least partly explained by the methylation status of the promoter region under consideration. We next asked if methylation may be involved in the dynamic regulation of leptin in WAT during the important decrease of leptin expression generally associated to weight loss, and repeatedly observed43 in obese patients after gastric bypass surgery.
Pre- and post-surgery biopsies of SC WAT (average follow up of 2 years) were collected from eight patients undergoing gastric bypass surgery, who lost on average 30% of their initial weight (Fig. 5A). gDNA and RNA were extracted from the unfractionated tissues, that in most cases was a tiny amount. Quantitative real time PCR on pre/post SC WAT biopsies from the 8 patients under study confirmed an average decrease in leptin mRNA abundance (pre 0.39 ± 0.10, post 0.14 ± 0.05 arbitrary units; paired t-test p < 0.05, Fig. 5B).
Figure 5.

LEP promoter methylation in SC WAT biopsies pre and post weight loss (n = 8). (A) Leptin expression following weight loss. (B) Weight loss after 2 years from the bariatric surgery. Paired t-test, *p<0.05, ***p<0.001. (C) Methylation of the 31 CpG in PRE and POST conditions. (D) Methylation quantifications. No difference was observed between PRE and POST weight loss (ANCOVA with Bonferroni's post-hoc correction).
We analyzed the corresponding methylation patterns applying the same parameters already described in the previous paragraphs. No significant difference was detected between pre- and post-conditions as shown by the mean methylation level across the 31 CpGs and the quantification of the three parameters OM, UME and UMC (Fig. 5C and D).
These data suggest that methylation is not implied in the changes of leptin expression that occur in WAT upon bariatric surgery induced-weight loss.
Discussion
Our findings allow to establish that methylation of a proximal region in the LEP promoter constitutes a significant determinant of leptin expression in human adult tissues. In line with this, they indicate that pharmacological demethylation results in enhanced expression of leptin in cultured cells. Finally, data obtained in a longitudinal study suggest that changes in leptin mRNA abundance due to bariatric surgery induced-weight loss are not accompanied by correspondent changes in the methylation level of the region above mentioned, thus implying that steady and dynamic state are differently regulated.
According to our data LEP promoter methylation in terminally differentiated VISC adipocytes from 6 individuals is higher than that of SVF and liver from the same subjects, this being perfectly consistent with the lower leptin expression therein found.
This confirms and reinforces what previously found by Stoger44 who analyzed 21 CpGs (partially overlapping with ours) in the LEP promoter region and reported hypomethylation in WAT and hypermethylation in tissues/cells that typically express no or very low level of leptin, like peripheral blood leukocytes and sperm. His findings qualitatively characterize methylation levels in various districts but do not establish a direct correspondence between expression in a given sample and the correspondent methylation density. Being leptin expression highly variable, this becomes a crucial aspect that we further defined by employing tissues obtained from the same patient, so that methylation patterns are analyzed within the same pool of individuals and against their specific mRNA abundance. Indeed our results clearly showed that at higher leptin expression levels corresponds lower overall methylation amount (OM) on LEP promoter. Other studies found such correspondence during in vitro adipogenesis by comparing the percentage of CpG methylation in preadipocytes (no leptin expression) and in adipocytes (abundant leptin).25,45 In addition the two parameters used to quantify methylation, unmethylated epialleles (UME) and unmethylated CpGs (UMC), revealed additional information about the methylation distribution across different CpGs. AF, that constitutes the main source of leptin production, displayed the highest UME (almost 50%), in other words indicating that half of epialleles are fully unmethylated and then able to provide complete open access to the transcriptional machinery. In addition, 50% of the 31 CpGs in AF were found never methylated against about 10% of SVF and liver. Association between leptin expression in adult tissues and correspondent methylation is strengthened by our in vitro experiments, demonstrating that demethylation obtained by decitabine results in enhanced expression of leptin. A general demethylation treatment is in fact sufficient to cause an increase of leptin expression in primary skin fibroblast and, when methyl groups are removed a de novo basal transcription takes place even in HeLa cells, which otherwise do not express leptin, indicating that methylation constitutes one of the control levels for leptin expression.
Besides, dissecting the 305 bp region under consideration we could identify two sub-regions (5′: CpGs 1–18, 3′: CpGs 19–31) according to the percentage of methylation, which is respectively lower and higher in both liver and AF. This is consistent with what found by Noer who analyzed methylation density in a promoter region almost totally overlapping with ours25 and by Stoger who considered a shorter region (CpGs 11–31).44
In our samples the difference between AF and liver is particularly significant for the CpGs 3, 21 and 22–23/24. The latter 4 are localized respectively inside or nearby the recognition sequences for the transcription factor C/EBP and the TATA box region.7,46
In tissues presenting low abundant leptin, like peripheral blood cells, C21 is methylated at high frequency when compared to the regional average.44 Of interest, Stoger noted that this site remains frequently methylated even in those epialleles of the AF that are almost totally unmethylated. Accordingly, in our samples C21, despite its relevance in differentiating AF from liver, is within its region (±5 positions) the site with the highest methylation frequency both in AF and liver (17% and 55%, respectively).
In addition our results show that leptin expression increase following DAC treatment is associated to a more pronounced drop in methylation for CpGs 15/21–24 (40% of control) than what observed overall (60% of control). Being obvious that DAC cannot exert a region specific action and not meaning to provide a direct demonstration that the methylation state of the cytosine within the C/EBP and flanking the TATA box are determinants for leptin expression, our results are perfectly in line with what found by Melzner and collaborators45 who analyzed methylation dependent transcriptional activity of a proximal 317 bp human LEP promoter fragment in Lisa-2 undifferentiated cells. According to their data, luciferase activity, therein used as a reporter of promoter activity, was importantly downregulated by the specific methylation of the CpG site contained in the C/EBP binding element and was totally abrogated by methylation of the CpGs proximal to the TATA box. According to their findings less relevant was the methylation of the CpG within the Sp1 site. Nuclear protein binding assays, also employed by these authors, using probes methylated and unmethylated at the C/EBP binding sequence, further proved the importance of the epigenetic control at this element, since binding affinity was significantly lower in the case of the methylated probe.
Several CpGs in the 5′ end (C1–18) exhibited difference in the methylation density, albeit with lower significance. With the exception of C3, also reported by Noer26 to be one of the few significantly demethylated in ASCs undergoing adipose conversion and C15 residing within the putative recognition sequence for the transcription factor Sp1, the others had not been previously associated with leptin expression. C3 displays important differences among the tissues analyzed although no putative binding sites for transcription factors were evidenced within that region. What seem to emerge from our and other authors' work is thus the following: when single positions are considered, the absolute frequency of methylation per se is not predictive of the expression at a given tissue: rather fold difference (typically 3–4) in the frequency among low and high leptin tissues are far more informative. This is well illustrated in Figure 3A: even in high leptin-expressing tissue (AF) the most significant positions often correspond to CpGs that display a higher methylation frequency when compared to the regional average.
The association between methylation status and expression was found despite a high level of variability among epialleles derived from the same sample. Previously described by others,44 this aspect could be due in our case to an heterogeneity in cell composition that remains notwithstanding subfractionation: AF includes in fact adipocytes of different size, so presumably expressing different levels of leptin and SVF is a mixture of different cells, including preadipocytes, inflammatory and endothelial cells.
Further, LEP promoter, as well explained by Stoger,44 does not exhibit the classical imprinted pattern, that results in epialleles that are either densely methylated or almost completely unmethylated. This contributes to create a wide range of methylation densities even in epialleles of the same individual.
Taking this into account we could speculate that methylation patterns of LEP promoter is not defined with the timing of the classical epigenetic imprints, established in the embryo by the time of gastrulation,47 and rather coincides with later phases of cell specification. A key period for adipogenesis in the human embryo is considered the second trimester of gestation.48 Nevertheless, specific studies are required to further elucidate this point and understand in which period during fetal life epigenetic modifications might be implied to switch leptin on or off, depending on the cell type.
In the second part of the present study we asked whether important variation of leptin expression intra-vitam could be associated with modifications in the pattern of methylation of LEP promoter. Variation in leptin expression (more than 50% decrease on average) was due to important weight loss (about 30% of the original weight) achieved by eight patients following bariatric surgery. In this case we did not observe any association between intra-individual variations in methylation density and leptin expression. This result is in line with what obtained by Okada and coworkers in mice exposed to high fat diet, that, despite an important variation (in this case upregulation) of both body weight and leptin expression, did not modify the methylation pattern of their LEP promoter.49 Milagro et al.50 investigated this issue in rats exposed to cafeteria diet and analyzed a different more distal part of the rat LEP promoter (from −694 to −372 bp) including 13 CpGs. This region was slightly more methylated in obese rats with only one single CpG significantly different.
To our knowledge these are the first data on LEP promoter methylation obtained in a longitudinal study in humans before and after important weight loss due to bariatric surgery. In a recent paper Cordero and coworkers51 described difference at baseline in methylation patterns in responders and non responders to a low calorie diet, but did not investigate the changes over time.
In conclusion, data herein presented suggest that methylation density in the LEP promoter indeed constitutes one control level for leptin expression in a chronic state like that specified by cell type. This is consistent with methylation being a stable epigenetic modification taking place during development and closely related to cell division.23
By contrast, dynamic changes in WAT leptin expression occurring intra-vitam as a result of weight loss are not associated with alterations in leptin methylation patterns.
Methods
Patients.
The study included three groups of severely obese participants (BMI >40 Kg/m2) undergoing gastric bypass surgery: (1) a group of 6 individuals for the investigation of the methylation density of LEP promoter in VISC WAT (AF and SVF) and liver, (2) a group of 3 patients for the investigation of the methylation density and leptin expression in adipocytes from SC versus VISC WAT, (3) a group of 8 individuals to analyze leptin methylation differences on SC WAT following weight loss. Main clinical characteristics of the patients are reported in Table 2. For the follow-up study, specimens were obtained from SC WAT during abdominal remodeling surgery.
Table 2.
Clinical characteristics of patients (all women) employed in the study
| Parameters | Group 1 (n = 6) | Group 2 (n = 3) | Group 3# (n = 8) |
| Age (yr) | 41.0 ± 4.8 | 37.0 ± 4.9 | 45.7 ± 5.0 |
| BMI (Kg/m2) | 52.5 ± 6.8 | 54.3 ± 12.5 | 45.8 ± 1.7 |
| BMI post weight loss (Kg/m2) | 32.2 ± 1.7** | ||
| Percentage weight loss (%) | 28.6 ± 3.5 | ||
| Blood Glucose (mg/dl) | 105.6 ± 5.1 | 102.3 ± 5.0 | 131.2 ± 10.7 |
| Blood Glucose pwl (mg/dl) | 84.8 ± 2.3* | ||
| Presence of comorbidities | 1 DM2, 1 HS, 1 HT | 1 HS | 4 DM2. |
| Presence of comorbidities pwl | none |
For patients belonging to this group, two parameters are reported before and after weight loss (pwl). vs. pre-weight loss paired t-test.
p < 0.05,
p < 0.01. DM2, type 2 diabetes; HS, hepatic steatosis; HT, hypertension.
All participants provided informed, written consensus, and the protocol was approved by the local Ethics Committee.52
Adipose tissue biopsy samples and cell fraction isolation.
SC WAT and liver biopsies were dissected and promptly frozen into liquid nitrogen and stored at −80°C. Fresh VISC and SC adipose tissue (2–3 g) was collected during surgery, cut in little pieces and incubated 1 hour at 37°C with 2 mg/ml collagenase. The digestion was stopped by adding 3 volumes of DMEM completed with 10% FBS, then the homogenate was filtered through a 100 µm mesh. The filtrate was then centrifuged 1,000 g for 5 min at RT in order to separate AF in the upper phase and SVF in the lower phase.
The two cell fractions were separately collected in different tubes for further processing.
Isolation of total RNA and real time PCR.
Total RNA was isolated from frozen tissues or from cells with Isol-RNA Lysis Reagent (Ref. No. 2302700; 5prime) and its integrity was evaluated on formaldehyde denaturing agarose gel. RNA was treated with RNase-free DNase (Ref. No. 10776785 001; Roche Molecular Biochemicals) to remove any contaminating genomic DNA. First-strand cDNA synthesis was performed using oligo hexamers (Pharmacia) (review ref. 53 for detailed protocols).
Taq-Man quantitative PCR (50°C for 2 min, 95°C for 10 min, followed by 40 cycles of 95°C for 15 s 60°C for for 1 min) amplify samples for leptin (Human Leptin Taqman assay, Applied Biosystems; Hs 00174877_m1). The relative abundance of mRNAs was calculated with Tata Binding Protein mRNA as the invariant control (Human TBP Taqman assay, Applied Biosystems; Hs 0427620_m1).
Culture cells.
Human primary skin fibroblasts were cultured in 199 medium, with 10% Fetal Bovine Serum (FBS), penicillin G (100 U/ml) and gentamycin (8 ng/ml) (Sigma). HeLa cells were cultured in Dulbecco's Modified Eagle's Medium with 10% FBS and 100 U/ml penicillin-streptomycin (Sigma). Both cell lines were seeded in 350 mm dishes (7 × 10⁴ cell/well density). The day after cells were treated with 100 µM of Decitabine (DAC) and the medium was replaced every day with fresh DAC for 4 and 3 days, respectively, in the case of fibroblasts and Hela.
Cells were processed for RNA extraction, retrotranscription and RT-PCR as already described in the dedicated paragraph.
gDNA extraction and bisulfonation.
gDNAs were automated extracted and purified with the Maxwell® 16 DNA Purification Kits (n.cat. AS1030; Promega) from fibroblast and Hela cells, and biopsies of liver, AF and SVF. After purification, DNA concentration and quality were determined by UV spectrophotometric analysis. 250 ng of gDNA of each sample were treated with bisulfite by using the methylSEQr Bisulfite Conversion Kit (Applied Biosystem; part n. 4374960), according to the manufacture's instructions.
PCR amplification, ligation, cloning and sequencing of epialleles.
We analyzed the human LEP promoter region from nucleotides 65913947–65914251 of the Homo sapiens chromosome 7 genomic contig, GRCh37.p2 reference primary assembly (NCBI Reference Sequence: NT_007933.15), corresponding to −226 to 79 with respect to the start ATG codon of the leptin gene. The 305-bp sequence was amplified from the BSgDNA using the following primers designed with MethPrimer software: F 5′-TTT TTG GGA GGT ATT TAA GGG T-3′ and R 5′-ACC AAA AAA AAC CAA CAA AAA A-3′. PCR amplification was performed with the Hot Start Taq polymerase (ref. n. 203203, Qiagen) in a volume of reaction of 10 µl (95°C for 15′, followed by 40 cycles of 95°C for 30″, 52°C for 45″, 72°C for 1′, and a final extension of 7′ at 72°C).
PCR products were controlled by gel electrophoresis and cloned into the pCR®2.1 vector using the protocol described in the TA cloning Kit (k2040-40, Invitrogen). Each clone so generated is herein defined as an EPIALLELE. Sequencing was performed with the M13 primer and Big Dye terminator v.1. sequencing kit (Part No. 4336774, Applied Biosystems) in a final volume of 10 µl using the following cycle profile: a preliminary denaturation step at 96°C for 1′ and 25 cycles of 20″ at 96°C and 4′ at 50°C, on a 2720 Thermal Cycler, Applied Biosystem. Sequences were purified by sephadex G50 (cat. N. G5050-50g, Sigma) packed in columns. Finally, 1 µl of the eluate was mixed with 8 µl Hi-Di formamide (Part No. 4311320, Applied Biosystems), denatured for two minutes at 90°C, and loaded on to a genetic analyzer ABI310, Applied Biosystems.
Methylation analysis.
Methylation patterns were analyzed with QUMA (Quantification tool for Methylation Analysis; Riken, Japan), a web-based tool for CpG methylation analysis which provides control tools to exclude low quality bisulfite sequences. The quality conditions applied include: 5%, upper limit of incomplete bisulfite conversion; 95%, lower limit of percent converted CpHs; 10%, upper limit of alignment mismatch (number of alignment mismatches and gaps between genomic and bisulfite sequences); 90%, lower limit of percent of alignment identity between genomic and bisulfite sequences. Only the sequences which satisfy these conditions were further analyzed.
Fifteen to twenty clones (epialleles) were analyzed for each sample to study the methylation status of the 31 CpGs distributed within the region of interest. The degree of methylation was evaluated by measuring the following parameters: the overall methylation frequency, the number of never methylated CpGs and the number of never methylated epialleles.
Statistical analysis.
For each parameter UME, UMC and OM, one-way analysis of covariance (ANCOVA) was used to evaluate differences among tissues, using the number of cells as covariate in the statistical model. Post-hoc comparisons were conducted using the Bonferroni's correction when necessary.
Log-linear analysis was employed to assess the relationships (main and interaction effects) among tissues (3), subjects (6 or 8) and CpG positions (31), regarding the methylation status in each cell. Statistical significance was assumed for p-values less than 0.05.
Data are expressed as mean ± Standard Error of the Mean (SEM) for at least three independent experiments.
Acknowledgments
M. Maffei is an Associate Telethon Scientist. M. Marchi and S.L. are supported by a Telethon fellowship. This work was supported by the Telethon Foundation (grant n. TCP99016 to M.Maffei) and Italian ministry of education (grant n. 20083ZAXYC_004 to F.S.).
Abbreviations
- AF
adipose fraction
- C/EBP
CCAAT-enhancer-binding protein
- CpG
cytosine phosphoguanosine
- CNS
central nervous system
- DAC
decitabine
- DNMT
DNA methyltransferase
- LEP
leptin
- OM
overall methylation
- UME
unmethylated epialleles
- UMC
unmethylated CpGs
- SC
subcutaneous
- Sp1
specificity protein 1
- SVF
stromal vascular fraction
- VISC
visceral
- WAT
white adipose tissue
Disclosure of Potential Conflicts of Interest
No potential conflicts of interest were disclosed.
References
- 1.Friedman JM. Leptin at 14 y of age: an ongoing story. Am J Clin Nutr. 2009;89:973–979. doi: 10.3945/ajcn.2008.26788B. [DOI] [PMC free article] [PubMed] [Google Scholar]
- 2.Li MD. Leptin and beyond: an odyssey to the central control of body weight. Yale J Biol Med. 2011;84:1–7. [PMC free article] [PubMed] [Google Scholar]
- 3.Fruhbeck G. Intracellular signalling pathways activated by leptin. Biochem J. 2006;393:7–20. doi: 10.1042/BJ20051578. [DOI] [PMC free article] [PubMed] [Google Scholar]
- 4.Fried SK, Ricci MR, Russell CD, Laferrere B. Regulation of leptin production in humans. J Nutr. 2000;130:3127–3131. doi: 10.1093/jn/130.12.3127S. [DOI] [PubMed] [Google Scholar]
- 5.Margetic S, Gazzola C, Pegg GG, Hill RA. Leptin: a review of its peripheral actions and interactions. Int J Obes Relat Metab Disord. 2002;26:1407–1433. doi: 10.1038/sj.ijo.0802142. [DOI] [PubMed] [Google Scholar]
- 6.Considine RV. Regulation of leptin production. Rev Endocr Metab Disord. 2001;2:357–363. doi: 10.1023/a:1011896331159. [DOI] [PubMed] [Google Scholar]
- 7.Mason MM, He Y, Chen H, Quon MJ, Reitman M. Regulation of leptin promoter function by Sp1, C/EBP and a novel factor. Endocrinology. 1998;139:1013–1022. doi: 10.1210/endo.139.3.5792. [DOI] [PubMed] [Google Scholar]
- 8.Birsoy K, Soukas A, Torrens J, Ceccarini G, Montez J, Maffei M, et al. Cellular program controlling the recovery of adipose tissue mass: An in vivo imaging approach. Proc Natl Acad Sci USA. 2008;105:12985–12990. doi: 10.1073/pnas.0805621105. [DOI] [PMC free article] [PubMed] [Google Scholar]
- 9.Solomon SS, Majumdar G, Martinez-Hernandez A, Raghow R. A critical role of Sp1 transcription factor in regulating gene expression in response to insulin and other hormones. Life Sci. 2008;83:305–312. doi: 10.1016/j.lfs.2008.06.024. [DOI] [PubMed] [Google Scholar]
- 10.Diehl AM. Roles of CCAAT/enhancer-binding proteins in regulation of liver regenerative growth. J Biol Chem. 1998;273:30843–30846. doi: 10.1074/jbc.273.47.30843. [DOI] [PubMed] [Google Scholar]
- 11.Darlington GJ. Molecular mechanisms of liver development and differentiation. Curr Opin Cell Biol. 1999;11:678–682. doi: 10.1016/s0955-0674(99)00035-6. [DOI] [PubMed] [Google Scholar]
- 12.Chandrasekaran C, Gordon JI. Cell lineage-specific and differentiation-dependent patterns of CCAAT/enhancer binding protein alpha expression in the gut epithelium of normal and transgenic mice. Proc Natl Acad Sci USA. 1993;90:8871–8875. doi: 10.1073/pnas.90.19.8871. [DOI] [PMC free article] [PubMed] [Google Scholar]
- 13.Natsuka S, Akira S, Nishio Y, Hashimoto S, Sugita T, Isshiki H, Kishimoto T. Macrophage differentiation-specific expression of NF-IL6, a transcription factor for interleukin-6. Blood. 1992;79:460–466. [PubMed] [Google Scholar]
- 14.Scott LM, Civin CI, Rorth P, Friedman AD. A novel temporal expression pattern of three C/EBP family members in differentiating myelomonocytic cells. Blood. 1992;80:1725–1735. [PubMed] [Google Scholar]
- 15.Menard C, Hein P, Paquin A, Savelson A, Yang XM, Lederfein D, et al. An essential role for a MEK-C/EBP pathway during growth factor-regulated cortical neurogenesis. Neuron. 2002;36:597–610. doi: 10.1016/s0896-6273(02)01026-7. [DOI] [PubMed] [Google Scholar]
- 16.Maffei M, Halaas J, Ravussin E, Pratley RE, Lee GH, Zhang Y, et al. Leptin levels in human and rodent: measurement of plasma leptin and ob RNA in obese and weight-reduced subjects. Nat Med. 1995;1:1155–1161. doi: 10.1038/nm1195-1155. [DOI] [PubMed] [Google Scholar]
- 17.Rasouli N, Kern PA. Adipocytokines and the metabolic complications of obesity. J Clin Endocrinol Metab. 2008;93:64–73. doi: 10.1210/jc.2008-1613. [DOI] [PMC free article] [PubMed] [Google Scholar]
- 18.Campion J, Milagro F, Martinez JA. Epigenetics and obesity. Prog Mol Biol Transl Sci. 94:291–347. doi: 10.1016/B978-0-12-375003-7.00011-X. [DOI] [PubMed] [Google Scholar]
- 19.Campion J, Milagro FI, Martinez JA. Individuality and epigenetics in obesity. Obes Rev. 2009;10:383–392. doi: 10.1111/j.1467-789X.2009.00595.x. [DOI] [PubMed] [Google Scholar]
- 20.Ooi SK, Bestor TH. The colorful history of active DNA demethylation. Cell. 2008;133:1145–1148. doi: 10.1016/j.cell.2008.06.009. [DOI] [PubMed] [Google Scholar]
- 21.Wu SC, Zhang Y. Active DNA demethylation: many roads lead to Rome. Nat Rev Mol Cell Biol. 11:607–620. doi: 10.1038/nrm2950. [DOI] [PMC free article] [PubMed] [Google Scholar]
- 22.Fatemi M, Pao MM, Jeong S, Gal-Yam EN, Egger G, Weisenberger DJ, Jones PA. Footprinting of mammalian promoters: use of a CpG DNA methyltransferase revealing nucleosome positions at a single molecule level. Nucleic Acids Res. 2005;33:176. doi: 10.1093/nar/gni180. [DOI] [PMC free article] [PubMed] [Google Scholar]
- 23.Sorensen AL, Jacobsen BM, Reiner AH, Andersen IS, Collas P. Promoter DNA methylation patterns of differentiated cells are largely programmed at the progenitor stage. Molecular biology of the cell. 21:2066–2077. doi: 10.1091/mbc.E10-01-0018. [DOI] [PMC free article] [PubMed] [Google Scholar]
- 24.Sorensen AL, Timoskainen S, West FD, Vekterud K, Boquest AC, Ahrlund-Richter L, et al. Lineage-specific promoter DNA methylation patterns segregate adult progenitor cell types. Stem cells and development. 19:1257–1266. doi: 10.1089/scd.2009.0309. [DOI] [PubMed] [Google Scholar]
- 25.Noer A, Boquest AC, Collas P. Dynamics of adipogenic promoter DNA methylation during clonal culture of human adipose stem cells to senescence. BMC Cell Biol. 2007;8:18. doi: 10.1186/1471-2121-8-18. [DOI] [PMC free article] [PubMed] [Google Scholar]
- 26.Noer A, Sorensen AL, Boquest AC, Collas P. Stable CpG hypomethylation of adipogenic promoters in freshly isolated, cultured and differentiated mesenchymal stem cells from adipose tissue. Molecular biology of the cell. 2006;17:3543–3556. doi: 10.1091/mbc.E06-04-0322. [DOI] [PMC free article] [PubMed] [Google Scholar]
- 27.Jousse C, Parry L, Lambert-Langlais S, Maurin AC, Averous J, Bruhat A, et al. Perinatal undernutrition affects the methylation and expression of the leptin gene in adults: implication for the understanding of metabolic syndrome. Faseb J. doi: 10.1096/fj.11-181792. [DOI] [PubMed] [Google Scholar]
- 28.Razin A, Cedar H. DNA methylation and embryogenesis. Exs. 1993;64:343–357. doi: 10.1007/978-3-0348-9118-9_15. [DOI] [PubMed] [Google Scholar]
- 29.Laird PW, Jaenisch R. DNA methylation and cancer. Hum Mol Genet. 1994;3:1487–1495. doi: 10.1093/hmg/3.suppl_1.1487. [DOI] [PubMed] [Google Scholar]
- 30.Wilson VL, Smith RA, Ma S, Cutler RG. Genomic 5-methyldeoxycytidine decreases with age. J Biol Chem. 1987;262:9948–9951. [PubMed] [Google Scholar]
- 31.Richardson B, Scheinbart L, Strahler J, Gross L, Hanash S, Johnson M. Evidence for impaired T cell DNA methylation in systemic lupus erythematosus and rheumatoid arthritis. Arthritis Rheum. 1990;33:1665–1673. doi: 10.1002/art.1780331109. [DOI] [PubMed] [Google Scholar]
- 32.Counts JL, Goodman JI. Hypomethylation of DNA: an epigenetic mechanism involved in tumor promotion. Mol Carcinog. 1994;11:185–188. doi: 10.1002/mc.2940110402. [DOI] [PubMed] [Google Scholar]
- 33.Wu SC, Zhang Y. Active DNA demethylation: many roads lead to Rome. Nat Rev Mol Cell Biol. 2010;11:607–620. doi: 10.1038/nrm2950. [DOI] [PMC free article] [PubMed] [Google Scholar]
- 34.Day JJ, Sweatt JD. DNA methylation and memory formation. Nat Neurosci. 13:1319–1323. doi: 10.1038/nn.2666. [DOI] [PMC free article] [PubMed] [Google Scholar]
- 35.Miller CA, Sweatt JD. Covalent modification of DNA regulates memory formation. Neuron. 2007;53:857–869. doi: 10.1016/j.neuron.2007.02.022. [DOI] [PubMed] [Google Scholar]
- 36.Feng J, Zhou Y, Campbell SL, Le T, Li E, Sweatt JD, et al. Dnmt1 and Dnmt3a maintain DNA methylation and regulate synaptic function in adult forebrain neurons. Nat Neurosci. 13:423–430. doi: 10.1038/nn.2514. [DOI] [PMC free article] [PubMed] [Google Scholar]
- 37.Miller CA, Campbell SL, Sweatt JD. DNA methylation and histone acetylation work in concert to regulate memory formation and synaptic plasticity. Neurobiol Learn Mem. 2008;89:599–603. doi: 10.1016/j.nlm.2007.07.016. [DOI] [PMC free article] [PubMed] [Google Scholar]
- 38.Miller CA, Gavin CF, White JA, Parrish RR, Honasoge A, Yancey CR, et al. Cortical DNA methylation maintains remote memory. Nat Neurosci. 13:664–666. doi: 10.1038/nn.2560. [DOI] [PMC free article] [PubMed] [Google Scholar]
- 39.Bays HE, Laferrere B, Dixon J, Aronne L, Gonzalez-Campoy JM, Apovian C, Wolfe BM. Adiposopathy and bariatric surgery: ‘is sick fat’ a surgical disease? International journal of clinical practice. 2009;63:1285–1300. doi: 10.1111/j.1742-1241.2009.02151.x. [DOI] [PMC free article] [PubMed] [Google Scholar]
- 40.Viguerie N, Poitou C, Cancello R, Stich V, Clement K, Langin D. Transcriptomics applied to obesity and caloric restriction. Biochimie. 2005;87:117–123. doi: 10.1016/j.biochi.2004.12.011. [DOI] [PubMed] [Google Scholar]
- 41.van Harmelen V, Dicker A, Ryden M, Hauner H, Lonnqvist F, Naslund E, Arner P. Increased lipolysis and decreased leptin production by human omental as compared with subcutaneous preadipocytes. Diabetes. 2002;51:2029–2036. doi: 10.2337/diabetes.51.7.2029. [DOI] [PubMed] [Google Scholar]
- 42.Orel M, Lichnovska R, Gwozdziewiczova S, Zlamalova N, Klementa I, Merkunova A, Hrebicek J. Gender differences in tumor necrosis factor alpha and leptin secretion from subcutaneous and visceral fat tissue. Physiological research/Academia Scientiarum Bohemoslovaca. 2004;53:501–505. [PubMed] [Google Scholar]
- 43.Geloneze B, Tambascia MA, Pareja JC, Repetto EM, Magna LA, Pereira SG. Serum leptin levels after bariatric surgery across a range of glucose tolerance from normal to diabetes. Obes Surg. 2001;11:693–698. doi: 10.1381/09608920160558623. [DOI] [PubMed] [Google Scholar]
- 44.Stoger R. In vivo methylation patterns of the leptin promoter in human and mouse. Epigenetics. 2006;1:155–162. doi: 10.4161/epi.1.4.3400. [DOI] [PubMed] [Google Scholar]
- 45.Melzner I, Scott V, Dorsch K, Fischer P, Wabitsch M, Bruderlein S, et al. Leptin gene expression in human preadipocytes is switched on by maturation-induced demethylation of distinct CpGs in its proximal promoter. J Biol Chem. 2002;277:45420–45427. doi: 10.1074/jbc.M208511200. [DOI] [PubMed] [Google Scholar]
- 46.Lin TC, Lee TC, Hsu SL, Yang CS. The molecular mechanism of leptin secretion and expression induced by aristolochic acid in kidney fibroblast. PLoS One. 2011;6:16654. doi: 10.1371/journal.pone.0016654. [DOI] [PMC free article] [PubMed] [Google Scholar]
- 47.Reik W, Walter J. Evolution of imprinting mechanisms: the battle of the sexes begins in the zygote. Nat Genet. 2001;27:255–256. doi: 10.1038/85804. [DOI] [PubMed] [Google Scholar]
- 48.Poissonnet CM, Burdi AR, Garn SM. The chronology of adipose tissue appearance and distribution in the human fetus. Early Hum Dev. 1984;10:1–11. doi: 10.1016/0378-3782(84)90106-3. [DOI] [PubMed] [Google Scholar]
- 49.Okada Y, Sakaue H, Nagare T, Kasuga M. Diet-induced upregulation of gene expression in adipocytes without changes in DNA methylation. Kobe J Med Sci. 2009;54:241–249. [PubMed] [Google Scholar]
- 50.Milagro FI, Campion J, Garcia-Diaz DF, Goyenechea E, Paternain L, Martinez JA. High fat diet-induced obesity modifies the methylation pattern of leptin promoter in rats. J Physiol Biochem. 2009;65:1–9. doi: 10.1007/BF03165964. [DOI] [PubMed] [Google Scholar]
- 51.Cordero P, Campion J, Milagro FI, Goyenechea E, Steemburgo T, Javierre BM, Martinez JA. Leptin and TNFalpha promoter methylation levels measured by MSP could predict the response to a low-calorie diet. J Physiol Biochem. 2011 doi: 10.1007/s13105-011-0084-4. [DOI] [PubMed] [Google Scholar]
- 52.Nannipieri M, Cecchetti F, Anselmino M, Camastra S, Niccolini P, Lamacchia M, et al. Expression of thyrotropin and thyroid hormone receptors in adipose tissue of patients with morbid obesity and/or type 2 diabetes: effects of weight loss. Int J Obes (Lond) 2009;33:1001–1006. doi: 10.1038/ijo.2009.140. [DOI] [PubMed] [Google Scholar]
- 53.Chiellini C, Costa M, Novelli SE, Amri EZ, Benzi L, Bertacca A, et al. Identification of cathepsin K as a novel marker of adiposity in white adipose tissue. J Cell Physiol. 2003;195:309–321. doi: 10.1002/jcp.10253. [DOI] [PubMed] [Google Scholar]