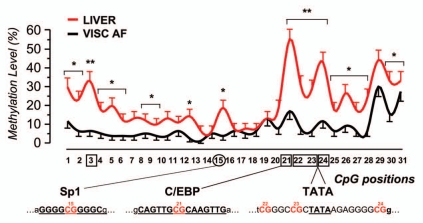
Figure 3.
Methylation profiles and critical CpGs. Plot of the mean methylation levels across the 31 CpGs of VISC AF and liver (SE, vertical bars). Log-linear analysis; Bonferroni adjustment for multiple analyses, *p < 0.05; **p < 0.01. Below the x axis, CpGs within or in proximity of target recognition sequences for transcription factors were evidenced. Horizontal bars below asterisks indicate that statistical significance is common to two or more CpGs.

