

Abstract
Background
During infection, Mycobacterium tuberculosis confronts a generally hostile and nutrient-poor in vivo host environment. Existing models and analyses of M. tuberculosis metabolic networks are able to reproduce experimentally measured cellular growth rates and identify genes required for growth in a range of different in vitro media. However, these models, under in vitro conditions, do not provide an adequate description of the metabolic processes required by the pathogen to infect and persist in a host.
Results
To better account for the metabolic activity of M. tuberculosis in the host environment, we developed a set of procedures to systematically modify an existing in vitro metabolic network by enhancing the agreement between calculated and in vivo-measured gene essentiality data. After our modifications, the new in vivo network contained 663 genes, 838 metabolites, and 1,049 reactions and had a significantly increased sensitivity (0.81) in predicted gene essentiality than the in vitro network (0.31). We verified the modifications generated from the purely computational analysis through a review of the literature and found, for example, that, as the analysis suggested, lipids are used as the main source for carbon metabolism and oxygen must be available for the pathogen under in vivo conditions. Moreover, we used the developed in vivo network to predict the effects of double-gene deletions on M. tuberculosis growth in the host environment, explore metabolic adaptations to life in an acidic environment, highlight the importance of different enzymes in the tricarboxylic acid-cycle under different limiting nutrient conditions, investigate the effects of inhibiting multiple reactions, and look at the importance of both aerobic and anaerobic cellular respiration during infection.
Conclusions
The network modifications we implemented suggest a distinctive set of metabolic conditions and requirements faced by M. tuberculosis during host infection compared with in vitro growth. Likewise, the double-gene deletion calculations highlight the importance of specific metabolic pathways used by the pathogen in the host environment. The newly constructed network provides a quantitative model to study the metabolism and associated drug targets of M. tuberculosis under in vivo conditions.
Background
Tuberculosis (TB) continues to be a major health threat, with 9.2 million new cases and 1.7 million deaths reported worldwide in 2006 [1,2]. It has been estimated that one-third of the human population is infected with Mycobacterium tuberculosis, the causative agent of TB [3]. Worldwide efforts to treat and eliminate TB are confronting many obstacles, including drug-resistant bacterial strains, lack of compliance with the complicated drug regimens, and an increased patient population with compromised immune systems associated with acquired immunodeficiency syndrome [3,4].
In general, bacterial metabolism is an attractive drug target for two main reasons: 1) metabolism is required for the bacterium to sustain itself and 2) many bacterial metabolic targets are absent in humans. Novel efforts in developing drugs that target the intracellular metabolism of M. tuberculosis often focus on metabolic pathways that are specific to M. tuberculosis [5,6]. However, TB is a complex disease caused by bacterial populations located in discrete microenvironments of the host with access to a varying availability of nutrients [7]. This, coupled with the differences in bacterial metabolism under in vivo and in vitro conditions [8-10], creates a challenge in modeling and understanding the metabolic requirements of M. tuberculosis inside a host.
Recently, genome-scale metabolic network reconstructions for different organisms have enabled systematic analyses of metabolic functions and predictions of metabolism-related phenotypes [11,12]. By collecting all possible biochemical reactions for specific organisms, different groups have reconstructed metabolic networks for bacteria (e.g., for Escherichia coli [13], Helicobacter pylori [14], and M. tuberculosis [15,16]), eukaryotic microorganisms [17-19], mice [20], and even humans [21]. The Web site of the Systems Biology Research Group at the University of California, San Diego, provides a continuously updated list of genome-scale metabolic network reconstructions [22]. Analysis of metabolic networks can provide insights into an organism's ability to grow under specific conditions. For example, given a specific set of nutrient conditions, flux balance analysis (FBA) of metabolic networks can accurately predict microbial cellular growth rates [13,15-17,23]. In a recent work, Raghunathan et al. [24] used an approximate representation of in-host nutrient availability inferred from the literature to simulate the in-host metabolism of Salmonella typhimurium. Moreover, metabolic network analyses can then be used to identify organism-specific essential genes by predicting the attenuation of microbial growth of specific deletion mutants [13-17,19]. Metabolic genes that are essential for pathogen growth but are not present in humans constitute actual and potential drug targets [6,19].
Using the sequenced genome of M. tuberculosis [25] together with literature data on known metabolic reactions, extensive metabolic network reconstructions have been carried out for this organism [15,16]. Analyses of these networks based on FBA revealed that they contain sufficient information to predict growth rates and identify genes that are essential for the growth of M. tuberculosis in select media [15,16]. We have also used the in vitro network to model the drug-induced growth inhibition of M. tuberculosis when grown on defined media [26]. However, simulation of M. tuberculosis growth in an in vivo host environment based on an in vitro model is hindered by a lack of understanding of the pathogen's metabolism in the often poorly defined in vivo environment [7,27]. To experimentally explore the cellular activities of this pathogen in hosts, several methodologies have been developed. High-throughput gene expression experiments have been performed for M. tuberculosis in murine macrophage cells [28] and cells from mouse lung tissue [29]. Gene expression data have been interpreted, using the metabolic network of M. tuberculosis, to predict the production of mycolic acid [30]. Gene deletion experiments on M. tuberculosis, including individual [31-33] and high-throughput gene deletion studies [34], have identified genes that are essential in the murine host environment. In particular, Sassetti et al. developed the transposon site hybridization (TraSH) technique to identify genes required for M. tuberculosis growth in an in vitro medium [35] and genes specifically required for survival during in vivo infection [34]. This assay tested 2,979 genes, including a large fraction of genes known to be involved in metabolism.
For modeling, gene essentiality data per se are typically used to verify that a genome-scale metabolic network reconstruction is accurate; however, these data can also be used in the refinement process itself, either for specific pathways [36] or for the entire network [37-39], in which gene annotations, reactions, and biomass objective functions are adjusted based on gene essentiality data [37-39]. Moving away from these more or less ad hoc corrections, Kumar and Maranas [39] explored an automated and systematic way of reconciling in silico/in vivo growth predictions in large-scale metabolic networks. Here, we build on and extend these refinement methodologies to develop an enhanced set of systematic procedures to modify the in vitro metabolic network model of M. tuberculosis iNJ661 [15] and develop a network model that is more consistent with in vivo metabolism during the initial eight-week post-infection period. Importantly, the resultant network modifications provide indirect insights into the nutrient availability and metabolic states of M. tuberculosis in the mouse host environment. Furthermore, we used the newly developed in vivo network to predict the growth of double-deletion mutants to identify drug targets that are either specific for the host environment or common to both in vivo and in vitro conditions.
Methods
To develop a M. tuberculosis metabolic network model commensurate with an in vivo cellular environment, we modified an existing network in two separate steps. First, we corrected an existing in vitro network model to account for missing or inconsistent chemical reactions and metabolites, and then, through a systematic set of procedures, we modified this network to be compatible with gene essentiality data generated under in vivo conditions.
Modified in vitro network iNJ661m
We used the iNJ661 metabolic network model of M. tuberculosis H37Rv [15], which reproduces in vitro experimentally observed growth rates in different media, as the starting point for our work. Our modified in vitro network, iNJ661 m, models cellular growth in Middlebrook 7H9 medium supplemented with glucose and glycerol. We then used the GSMN-TB metabolic network of M. tuberculosis [16] to supplement reactions and metabolites in the modified network. We corrected the network with respect to biotin synthesis, fumarate and succinate synthesis, added the methylcitrate cycle, added a redundant annotation for the β-hydroxybutyryl-CoA dehydrogenase enzyme, and made minor changes to the biomass function (see Supplemental Section S1 in Additional file 1 for details). These modifications did not change the previously reported growth rates [15]. The resulting iNJ661m network model contained 663 genes, 838 metabolites, and 1,049 reactions. The developed network is provided in the Additional files in both Systems Biology Markup Language (Additional file 2) and Excel formats (Additional file 3).
Prediction of essentiality of single genes and gene pairs
We used FBA of the metabolic networks to predict the essentiality of single genes. Using linear programming, FBA can maximize the cellular growth rate subject to the steady-state mass balance of all the intracellular metabolites and the stoichiometric constraints defined by the reactions [40-42]. For the metabolic network models, we performed FBA to calculate the growth rate of wild-type M. tuberculosis and the growth rates of all single-gene deletion mutants. If the ratio of a single-gene deletion mutant growth rate to wild-type growth rate was less than a threshold (0.2), we labeled the gene as essential; otherwise, it was deemed as non-essential. Since the growth rate ratios obtained from FBA were either <10-4 or >0.2, the chosen threshold value of 0.2 differentiated growth rate ratios close to zero from those significantly higher than zero.
We compared the predicted gene essentiality with experimentally determined in vivo essentiality in mice [34,36] and defined four categories of predictions: true positives (TP), denoting genes that were predicted to be essential and were also essential in the experiment; true negatives (TN), denoting genes that were both predicted and experimentally determined to be non-essential; false negatives (FN), representing genes that were predicted to be non-essential but were experimentally essential; and false positives (FP), denoting genes that were predicted to be essential but were experimentally non-essential.
We predicted the synthetic essentiality of gene pairs in M. tuberculosis by calculating the growth rates of all possible double-gene deletion mutants in the metabolic network models. Two genes were classified as synthetically essential if each single individual gene deletion did not affect the growth of the organism, whereas the double-gene deletion impaired growth. Similar to the predictions for single-gene deletion mutants, we classified a deleted gene pair as synthetically essential if the ratio of the growth rate of the double-gene deletion mutant to that of the wild-type bacterium was smaller than the threshold (0.2) and the ratios for the two single-gene deletions were greater than the threshold.
Modifications used to construct the in vivo network iNJ661v
We developed a systematic set of procedures to optimally modify an existing metabolic network based on discrepancies in gene essentiality between computational predictions and experimental data. We applied the procedures to modify the original in vitro network, iNJ661 m, to optimally reproduce gene essentiality under an in vivo condition and create an in vivo network, iNJ661v. Figure 1 shows an overview of the five main steps of the procedure set, each of which is discussed in detail below. In Step I, we compared the gene essentiality of iNJ661m with experimental in vivo data and identified the set of FP and FN predictions. In Step II, for each incorrect prediction, we attempted to obtain a set of possible modifications to correct the predictions, commensurate with a minimum number of adjustments to iNJ661 m. In Step III, we combined all obtained modifications for each of the incorrect predictions and screened the sets of combined modifications to identify rational and consistent sets of metabolic modifications. In Step IV, we analyzed the availability and blockage of nutrient uptakes based on the original iNJ661m network and attempted to use small, chemically uncomplicated molecules as nutrient sources and to reduce the number of uptakes. Finally, in Step V, we reviewed the relevant literature to verify the biochemical and biological veracity of the introduced modifications. This set of procedure generated a number of different resultant networks, each representing a "minimal" adjustment that can optimally reproduce the given gene essentiality data. Because it is desirable to create a single unique network representation suitable for modeling and computational analysis, and because we do not have enough information to a priori discriminate against any particular network representation, we combined all networks as long as the combination did not generate any new incorrect predictions. Thus, the resultant network description iNJ661v corresponds to an unbiased assembly of minimal adjustments compatible with the experimental data.
Figure 1.

Main steps for the development of the iNJ661v network. In Step I, we compared the gene essentiality of iNJ661m with experimental in vivo data and identified the set of false positive (FP) and false negative (FN) predictions. In Step II, for each incorrect prediction, we attempted to obtain a set of possible modifications. In Step III, we combined all the suggested modifications for each different incorrect prediction and screened the network realizations to obtain adequate and consistent metabolic modifications. In Step IV, we analyzed the availability and blockage of nutrient uptakes. In Step V, we reviewed the relevant literature to verify the biochemical and biological veracity of the introduced modifications. TN, true negative; TP, true positive.
Step I: Collation of the FP and FN predictions
The wrongly predicted FP and FN genes were collated as identified from the gene essentiality predictions described above.
Step II: FP correction procedure
Figure 2 shows the two types of network modifications we used to remove FP predictions. For each FP prediction, we first attempted to correct it by removing metabolites from the biomass objective function of the original iNJ661m network. In the original iNJ661 network, 16 vitamins and cofactors were included as part of the biomass based on in vitro gene essentiality data but without any experimental verification [15], suggesting that these metabolites might not be part of the biomass when M. tuberculosis grows in a different nutritional environment. Therefore, we systematically investigated the removal of one or more of these 16 metabolites. Initially, we removed one metabolite at a time from the biomass objective function and recorded the removals that corrected the FP prediction and caused no original TP prediction to become FN. If the single-metabolite removal did not correct the FP prediction, we expanded the removal to include all pairwise removals, and so on, until exhaustion or until the prediction was corrected. The second set of attempts to correct FP predictions introduced new nutrient uptakes and/or changed irreversible reactions to reversible. This procedure is based on the optimization model that Kumar and Maranas [39] developed to resolve FP inconsistencies in the E. coli metabolic network by adding a minimum number of reactions from a pool of reactions collected from multi-organism databases (MetaCyc [43] and KEGG [44]). We used the same optimization model, where the pool of potentially added reactions consisted of 1) all uptake reactions blocked in the original iNJ661m network and 2) all irreversible reactions in iNJ661m with their directions reversed. We used this model to obtain the modification(s) that changed the minimum number of irreversible reactions, and accepted the modification(s) if the changed irreversible reaction(s) was (were) reported as thermodynamically reversible in either the metabolic network of E.coli [13] or that of Bacillus subtilis [45]. These two networks include thermodynamic reversibility data. All attempts to correct for the FP predictions by removal of metabolites from the biomass objective function and addition of reactions were performed in parallel. Each modification used the same iNJ661m network as the starting point. The set of identified modifications was then analyzed together in Step III: analysis of combined modifications.
Figure 2.

Procedure to correct false positive (FP) gene essentiality predictions. For each predicted FP gene, we attempted to correct the prediction by (I) removing metabolites from the biomass objective function and (II) introducing new nutrient uptakes and/or changing irreversible reactions to reversible (using the optimization model developed by Kumar and Maranas [39]). When a modification was successful, as determined by the criteria shown in Figure 4, we recorded and collected it in a set of possible modifications. TN, true negative; RXN, reaction; Y, yes.
Step II: FN correction procedure
Figure 3 shows the more complex procedures we used to correct the FN predictions. We initially listed all reactions catalyzed by the product of FN genes. For each reaction, we first examined whether the reaction required the presence of both a FN gene and one or more TN genes. If this were the case, no correction of the FN prediction was possible because a correction would have caused the predicted TN genes to become FP. If this were not the case, we attempted to correct the FN prediction by blocking the ability of isozyme(s) of the FN gene product to catalyze the reaction. Next, we examined whether the reaction was in a dead-end pathway, i.e., a pathway containing metabolites that cannot be produced, metabolites that cannot be consumed, or both. If a metabolite could not be produced, and the uptake reaction for this metabolite existed but was blocked in iNJ66 m, we restored the uptake. If a metabolite could not be consumed, we added this metabolite to the biomass objective function with a coefficient of 10-6 mmol/gDW, that is, mmol per gram dry weight of M. tuberculosis. This coefficient was used in the biomass objective function of the original iNJ661 network to include metabolites for which quantitative biomass composition data were not available [15]. Finally, if the above analysis of the dead-end pathway did not correct the FN prediction or the reaction was not in a dead-end pathway, we attempted to correct the FN prediction by suppressing one or more reactions in iNJ661 m. For this procedure, we used the optimization model developed by Kumar and Maranas [39] for resolving FN inconsistencies and selected the modification(s) that suppressed the minimum number of reactions.
Figure 3.

Procedure to correct false negative (FN) gene essentiality predictions. For each reaction associated with a FN gene, we first examined whether the reaction required the presence of both the FN gene and one or more TN genes. If this was not the case, we attempted to correct the FN prediction by blocking the functions of isozyme(s). Next, we examined whether the reaction was in a dead-end pathway, i.e., a pathway containing metabolites that cannot be produced, metabolites that cannot be consumed, or both. If this was the case, we added (I) metabolite uptakes or (II) metabolites to the biomass objective function. The last attempt was to correct the FN prediction by suppressing one or more reactions (using the optimization model developed by Kumar and Maranas [39]). When a modification was successful, as determined by the criteria shown in Figure 4, we recorded and collected it in a set of possible modifications. RXN, reaction; TN, true negative; TP, true positive; Y, yes; N, no.
Note that, to correct for FP and FN predictions in the Step II procedures, we needed to assess whether a modification was adequate. Figure 4 shows the criteria we used to determine this. A modification was adequate if, after applying the modification to iNJ661 m, the following three criteria were satisfied: 1) the calculated wild-type growth rate was greater than the minimal rate (taken to be 0.027 h-1, according to the growth rate of M. tuberculosis in mouse macrophages [32]), 2) the FP or FN prediction was corrected, and 3) no TP(TN) prediction became FN(FP).
Figure 4.

Criteria to judge whether a modification for an incorrect prediction is adequate. A modification was deemed to be adequate if, after applying the modification to iNJ661 m, the following criteria were met: 1) the calculated wild-type growth rate was greater than the minimal rate (taken to be 0.027 h-1, according the growth rate of M. tuberculosis in mouse macrophages [32]), 2) the false positive (FP) or false negative (FN) prediction was corrected, and 3) no true positive (TP) or true negative (TN) prediction became FN or FP, respectively. Y, yes; N, no.
Step III: Analysis of combined modifications
After the completion of Step II, there might be more than one modification used to correct for each of the FP or FN predictions, and we needed to analyze the consequences of combining these modifications into a single network description. Figure 5 summarizes these analyses. We first listed all possible network realizations, where each realization represented a set of combined modifications. Thus, if there were two possible modifications that correct for the prediction of gene A, three possible modifications that correct for the prediction of gene B, etc., then there would be 2*3*... possible network realizations, where each realization includes one modification for each incorrect prediction. Next, for each network realization, we checked whether the network contained contradictory modifications, e.g., one modification in the network blocked a reaction flux, whereas another modification allowed for the same reaction flux, or one modification added a metabolite to the biomass objective function, whereas another modification removed it. If contradictory modifications were not detected, then we applied the modifications to iNJ661m and verified that 1) the wild-type growth rate (calculated from FBA) was greater than the minimal rate, 2) incorrect predictions were corrected, and 3) correct predictions (TP or TN) were still correct. If true, we recorded the network as plausible. Finally, from all plausible networks, we selected the ones that were associated with the smallest number of adjustments (i.e., the smallest number of irreversible reaction changes and reaction suppressions).
Figure 5.

Procedures to analyze combined modifications for different incorrect predictions. Each network realization included one modification for every incorrect prediction. A plausible network realization satisfied the following criteria: 1) the network contained no contradictory modification, and, after the combined modifications to iNJ661m were applied, 2) the wild-type growth rate (calculated from flux balance analysis) was greater than the minimal rate (taken to be 0.027 h-1 according the growth rate of M. tuberculosis in mouse macrophages [32]), 3) incorrect predictions were corrected, and 4) existing correct predictions before the applied modification were still correct. Finally, from all plausible network realizations, we selected the networks that were associated with minimum adjustment. TN, true negative; TP, true positive; FN, false negative; TN, true negative; Y, yes; N, no.
Step IV: Nutrient uptake analysis
In Step II, we allowed for the addition and removal of a fixed set of nutrient uptakes, leaving other nutrient uptakes (blocked or unblocked) of iNJ661m unexamined. Here, we re-examined these uptakes in light of the altered nutritional environment under in vivo conditions. The harsh nutritional environment that M. tuberculosis confronts when the bacterium infects a mouse suggests that nutrient uptake is limited and restricted to generally available small molecules as possible metabolite sources. Thus, we implemented a nutrient uptake-based analysis procedure to eliminate uptakes of complex nutrients as much as possible while minimizing the number of additional small-molecule uptakes and maintaining the compatibility with the in vivo gene essentiality data. The primary location of M. tuberculosis in a recently infected animal is the phagosomal compartments of macrophages. In this environment, large molecules are typically broken down into smaller ones. For example, macrophages decompose proteins into amino acids [46], which in turn are decomposed into smaller molecules, such as nitrite and nitrate [47]. Therefore, we assumed that the in vivo nutrient environment did not contain a significant abundance of all large molecules, such as amino acids, but rather was primarily composed of small molecules, such as nitrite, nitrate, ammonia, phosphate, and so on. However, as some large molecules may not be broken down, we still kept the uptakes for these molecules in two cases: 1) if their uptakes was added during the correction of a false gene essentiality prediction (for example, fatty acids); and 2) if deletions of these uptakes caused a growth rate lower than the defined threshold or generated new false gene essentiality predictions.
Before doing any calculation, we first assembled a set of available small-molecular-weight metabolites that 1) contained the necessary atomic elements found among the biomass molecules, i.e., carbon, nitrogen, oxygen, phosphorus, sulphur, iron, potassium, and sodium; 2) had a recorded uptake reaction in iNJ661m; and 3) contained a minimum number of other elements. Based on the elements, these small-molecule metabolites were then grouped accordingly: carbon monoxide (CO) and carbon dioxide (CO2) for carbon; ammonium (NH4+), nitrite (NO2-), and nitrate (NO3-) for nitrogen; O2 for oxygen; phosphate (HPO42-) for phosphorus; sulphate (SO42-) for sulphur; ferrous (Fe2+) and ferric (Fe3+) ions for iron; K+ for potassium; and Na+ for sodium. Note that nitric oxide (NO) is a small nitrogen-containing molecule that was not included in the analysis as it is generated as part of the host defense system rather than acting as a nitrogen source [48]. Commensurately, we also blocked the reaction catalyzed by cytochrome c oxidase because experiments have suggested that NO prevents the function of this enzyme [48]. Note that this is the only literature source we used before proceeding to the literature analysis and verification in Step V.
For each network realization from Step III, we divided all uptake reactions into the following two sets: 1) a "minimal" uptake set comprising the uptakes of H2O and H+, all uptakes added in Step II, and the uptakes of the small molecules defined above (minimal set); and 2) an "extended" uptake set comprising all other defined uptake reactions in iNJ661m (extended set). Initially, we allowed uptake reactions from the minimal set and blocked all reactions from the extended set. As expected, this resulted in a non-biological network displaying an overall growth rate of zero. We then used the minimization procedure adopted from Kumar and Maranas [39] to determine the smallest set of uptake reactions in the extended set that restored a minimal growth rate and introduced no new FP or FN predictions.
Next, we fixed this set of uptake reactions and investigated which small-molecule uptake reactions from the minimal set were dispensable, i.e., we tried to find a minimal set of uptakes that was still compatible with growth. To do this, we allowed metabolite uptakes for all members of the small-molecule set and investigated removal of specific uptakes based on each element group as defined above. We did this by systematically removing, for each element group, all combinations of small-molecule uptakes and recording which combinations resulted in a wild-type growth rate that was greater than the minimal rate and where each of the TP and TN predictions were preserved. For example, for the carbon group, we investigated the possibilities of 1) removing both the CO and CO2 uptakes, 2) removing only the CO uptake, and 3) removing only the CO2 uptake. When investigating the next element group, all other small-molecule metabolite uptakes were restored. Finally, we selected the minimal number of small-molecule uptakes for each element that was compatible with maintaining wild-type growth and preserving the true gene essentiality predictions.
All the computational correction procedures above (Steps II-IV) were fully automated and attempted to capture all feasible minimal modifications to the network that optimized compatibility with the gene essentiality data. Supplemental Section S2 in Additional file 1 shows a more detailed description of these procedures. Since all feasible corrections for each false prediction were collected, it was possible to obtain more than one resultant network. To generate the single in vivo network iNJ661v, we included all feasible modifications, as long as no new incorrect predictions or contradictory nutrient uptakes were generated.
Step V: Literature analysis and verification
We reviewed the available literature on M. tuberculosis to examine the biological rationale of our modifications. The presence of supporting data from the literature suggested that our systematic procedures could provide insights into in vivo metabolism. The absence of literature citations for specific modifications indicated the need for possible future experimental work to link metabolism and gene essentiality data.
Statistic analyses of metabolic networks
We used statistical methods to compare the ability of the three metabolic network models (iNJ661, iNJ661 m, and iNJ661v) to predict experimental in vivo gene essentiality [34]. For each of the three networks, we obtained the total numbers of TP, TN, FN, and FP genes and compared the corresponding sensitivity and specificity. We also calculated Matthews correlation coefficients (MCCs) to evaluate the ability of the networks to predict and classify gene essentiality [49]. The MCC measures the correlation between observed and predicted binary classifications and ranges in values from +1 to -1, with +1 indicating a perfect prediction, 0 indicating a random prediction, and -1 indicating an inverse prediction. The calculated sensitivity, specificity, and MCCs depend on the value chosen for the growth rate ratio threshold to determine gene essentiality. To gauge the overall performance of the designed metabolic network model, we calculated receiver operating characteristic (ROC) curves for the studied networks. The ROC curve provides sensitivity as a function of 1 minus specificity across all possible thresholds [50], and, by estimating the 95% confidence interval of the area under the ROC curve (AUC), we can quantitatively assess and compare the global performance of each metabolic network model [51].
Results
Development of the modified in vivo network iNJ661v
Sassetti et al. [35] experimentally identified the genes essential for M. tuberculosis growth within an in vitro medium. We used the data from this in vitro experiment to verify the ability of iNJ661 and iNJ661m to predict in vitro gene essentiality. In addition, Sassetti and Rubin [34] adapted the TraSH technique to test for genes specifically required for the survival of M. tuberculosis during infection of the pathogen in mice [34]. Although this technique cannot positively identify in vivo essential genes whose deletion mutants are highly attenuated within the in vitro medium, the differentially identified set provides unique insights into the changed metabolic state of the pathogen [34]. In addition, Murphy et al. [36] showed that the otsB2 gene is essential for M. tuberculosis under in vivo conditions. We used the data from these two in vivo experiments [34,36] as the basis for our manipulations of metabolic reactions and metabolites to obtain a metabolic network (iNJ661v) that was compatible with pathogen growth under in vivo conditions.
Table 1 shows the predicted gene essentiality data based on FBA of iNJ661 [15], iNJ661 m, and GSMN-TB [16] as well as a comparison of the results with in vitro experimental datasets [35]. To verify our ability to correctly analyze the metabolic networks, we first repeated the original work of Jamshidi and Palsson [15] using the criterion that any gene whose deletion mutant had a growth rate less than that of the wild type, i.e., the mutant growth rate ratio was <1, was considered to be essential for growth. Our analysis of iNJ661 yielded 153 TP genes and 84 FN genes using a growth rate ratio threshold of 1.0. Due to minor numerical differences in cutoffs and constraint values in the FBA, these numbers were slightly different from the published results (154 TP and 83 FN) [15]. When the growth rate ratio threshold was lowered to 0.2, the sensitivity decreased from 0.65 to 0.57, whereas the specificity increased from 0.77 to 0.81. In addition, iNJ661 gave MCC values ranging from 0.39 to 0.42 depending on the specific threshold. We also performed the same calculations for iNJ661m and GSMN-TB. We obtained very similar results for iNJ661 m, suggesting that iNJ661m had the same ability to predict in vitro gene essentiality. The agreement between the GSMN-TB-predicted essentiality and the in vitro experimental data was slightly better than that for the other two networks, with MCC values for GSMN-TB ranging from 0.49-0.52.
Table 1.
Comparison of predicted and experimental gene essentiality using different networks and different growth conditions.
| Network | Experiment Condition |
Threshold | Number of Gene Essentiality Predictions | Sensitivity | Specificity | Matthews Correlation Coefficient | |||
|---|---|---|---|---|---|---|---|---|---|
| TP | FN | FP | TN | ||||||
| iNJ661 | In vitro | <1.0 | 153 | 84 | 71 | 236 | 0.65 | 0.77 | 0.42 |
| iNJ661m | In vitro | <1.0 | 153 | 85 | 71 | 237 | 0.64 | 0.77 | 0.42 |
| GSMN-TB | In vitro | <1.0 | 156 | 85 | 58 | 294 | 0.65 | 0.84 | 0.49 |
| GSMN-TBv | In vitro | <1.0 | 160 | 81 | 75 | 277 | 0.66 | 0.79 | 0.45 |
| iNJ661v | In vitro | <1.0 | 140 | 98 | 80 | 228 | 0.59 | 0.74 | 0.33 |
| iNJ661 | In vitro | ≤0.2 | 135 | 102 | 59 | 248 | 0.57 | 0.81 | 0.39 |
| iNJ661m | In vitro | ≤0.2 | 135 | 103 | 59 | 249 | 0.57 | 0.81 | 0.39 |
| GSMN-TB | In vitro | ≤0.2 | 152 | 89 | 47 | 305 | 0.63 | 0.87 | 0.52 |
| GSMN-TBv | In vitro | ≤0.2 | 156 | 85 | 65 | 287 | 0.65 | 0.82 | 0.47 |
| iNJ661v | In vitro | ≤0.2 | 123 | 115 | 63 | 245 | 0.52 | 0.80 | 0.33 |
| iNJ661 | In vivo | <1.0 | 16 | 20 | 97 | 242 | 0.44 | 0.71 | 0.10 |
| iNJ661m | In vivo | <1.0 | 16 | 20 | 94 | 246 | 0.44 | 0.72 | 0.11 |
| GSMN-TB | In vivo | <1.0 | 10 | 34 | 76 | 317 | 0.23 | 0.81 | 0.03 |
| GSMN-TBv | In vivo | <1.0 | 16 | 28 | 93 | 300 | 0.36 | 0.76 | 0.09 |
| iNJ661v | In vivo | <1.0 | 31 | 5 | 77 | 263 | 0.86 | 0.77 | 0.41 |
| iNJ661 | In vivo | ≤0.2 | 11 | 25 | 76 | 263 | 0.31 | 0.78 | 0.06 |
| iNJ661m | In vivo | ≤0.2 | 11 | 25 | 76 | 264 | 0.31 | 0.78 | 0.06 |
| GSMN-TB | In vivo | ≤0.2 | 10 | 34 | 65 | 328 | 0.23 | 0.83 | 0.05 |
| GSMN-TBv | In vivo | ≤0.2 | 16 | 28 | 83 | 310 | 0.36 | 0.79 | 0.11 |
| iNJ661v | In vivo | ≤0.2 | 29 | 7 | 52 | 288 | 0.81 | 0.85 | 0.47 |
A true positive (TP) prediction refers to a gene correctly predicted to be essential, whereas a false negative (FN) prediction refers to a gene incorrectly predicted to be non-essential. A false positive (FP) prediction refers to a gene incorrectly predicted to be essential, whereas a true negative (TN) prediction refers to a gene correctly predicted to be non-essential. Sensitivity = TP/(TP + FN). Specificity = TN/(TN + FP). Matthews correlation coefficient = (TP × TN - FP × FN)/[(TP + FP)(TP + FN)(TN + FP)(TN + FN)]1/2. GSMN-TBv indicates the GSMN-TB network with its in vivo biomass objective function.
In contrast to the in vitro results, the in vivo-predicted essentiality of iNJ661, iNJ661 m, and GSMN-TB was less satisfactory. Using the designated in vivo biomass composition formulation in the GSMN-TB network (indicated as GSMN-TBv) provided a slightly larger sensitivity in the essentiality prediction, but the improvement was only modest. The sensitivity for the predicted essentiality of these networks ranged from 0.23 to 0.44 depending on the threshold used. MCC values also decreased to 0.03-0.11 when we used these networks to predict in vivo essentiality. The relatively poor match between these predictions and the in vivo experimental data suggests that iNJ661, iNJ661 m, and GSMN-TB(v) are inappropriate to describe the metabolic activity of M. tuberculosis under in vivo conditions.
Therefore, we attempted to obtain the new network by modifying an existing metabolic network of M. tuberculosis. Among the two available networks [15,16], we selected iNJ661 as the starting point because it is based on the H37Rv strain of M. tuberculosis used in the in vivo gene essentiality experiments [34,36]. In contrast, the GSMN-TB construct is meant to be a general, non-strain specific model of M. tuberculosis metabolism. iNJ661 also successfully predicts the growth rate of M. tuberculosis H37Rv in two different media: Youmans and the "chemically defined rich culture media," while the growth rates predicted from GSMN-TB are only compared with experimental data for M. bovis BCG. Since the key aim of our work is to mimic as faithfully as possible the H37Rv strain, we choose not to use the GSMN-TB network as our starting point, although we used reactions relevant to the H37Rv strain from the GSMN-TB network to augment our construction.
We used iNJ661 m, the slightly improved version of iNJ661, as a starting point and performed the systematic procedures shown in Figure 1 to develop a modified metabolic network (iNJ661v) to better describe the in vivo metabolic activity of M. tuberculosis. Table 1 shows that the comparison between the in vivo experimental essentiality and the predicted essentiality of iNJ661m at the end of Step I yielded 76 FP and 25 FN predictions with a threshold of ≤0.2. All 25 FN and 76 FP genes were taken as input to Step II. The automated FP and FN correction procedures shown in Figures 2 and 3 were able to correct 24 of the 76 FP predictions and 18 of the 25 FN predictions, respectively. Additional file 1, Table S1 shows all the possible minimal corrective modifications for each of 42 (24 + 18) predictions.
Since there were multiple ways in which we could combine the different modifications, it became necessary to try to reduce the number of possible network realizations, as outlined in Step III. As shown in Additional file 1, Table S1, we had 35 groups of genes whose products each catalyze the same reaction and whose predictions can be corrected by creating the necessary conditions that makes the reaction essential for FN predictions or non-essential for FP predictions. For 30 groups there is only one possible modification, for two groups there are five possible modifications each, and for three groups there are two possible modifications each, resulting in a total of 130 × 52 × 23 = 200 possible network realizations. Next, we examined each one of these using the criteria shown in Figure 5 to weed out inadequate networks. Table 2 shows the modifications that survived this analysis, resulting in 31 groups with only one possible modification and four groups with two possible modifications each, resulting in a total of 131 × 24 = 16 plausible network realizations.
Table 2.
Summary of modifications to correct gene essentiality predictions after Step III.
| Gene Group No. | Gene No. | Gene Locus | Gene Name | FP/FN | Pathway | Function/Reaction | Modification to Correct the False Gene Essentiality Prediction | Supporting Literature (References) |
|---|---|---|---|---|---|---|---|---|
| 1 | 1 | Rv1099c | Rv1099c | FN | Glycolysis/gluconeogenesis | Convert fructose-1,6-bisphosphate into fructose-6-phosphate | (1) Blocked the uptake of glucose from environment | [8,28,32,52-57] |
| 2 | 2 | Rv2702 | ppgK | FN | Glycolysis/gluconeogenesis | Conversion between glucose-6-phosphate and glucose | (1) Blocked the conversion from maltose to glucose and blocked the uptake of glucose (2) Blocked the conversion between maltose and trehalose and blocked the uptake of glucose |
[8,28,32,52-57] |
| 3 | 3 4 5 |
Rv1350 Rv1483 Rv2947c |
fabG2 inhA pks15 |
FP FP FP |
Fatty acid metabolism | Synthesis of fatty acids | (1) Allowed the uptakes of the following fatty acids: hexadecanoate, octadecanoate, octanoate, dodecanoate, arachidic acid, and hexacosanoate | [8,28,32,52-57] |
| 4 | 6 | Rv2503c | scoB | FP | Fatty acid metabolism | Functions as 3-oxoacid CoA-transferase | (1) Let the reaction catalyzed by acetyl-CoA:acetoacetyl-CoA transferase be reversible | |
| 5 | 7 | Rv3229c | desA3 | FN | Fatty acid metabolism | Palmitoyl-CoA desaturation | (1) Blocked the synthesis of hexadecenoate | [8,28,32,52-57] |
| 6 | 8 | Rv1185c | fadD21 | FN | Fatty acid metabolism | Synthesis of fatty acid-CoA | (1) Blocked the ability of fadD9 (Rv2590), fadD24 (Rv1529), and fadD23 (Rv3826) to catalyze the synthesis of fatty acid-CoA | |
| 7 | 9 | Rv0098 | Rv0098 | FN | Fatty acid metabolism | Mycolic acid synthesis | (1) Blocked the ability of fabG1 (Rv1483) to catalyze the same reaction | |
| 8 | 10 | Rv2483c | plsC | FN | Fatty acid metabolism | Synthesis of 1,2-diacyl-sn-glycerol 3-phosphate (a phospholipid) | (1) Blocked the ability of Rv2182c to catalyze the same reaction | |
| 9 | 11 | Rv1416 | ribH | FP | Vitamin and cofactor metabolism | Synthesis of riboflavin | (1) Removed riboflavin and flavin mononucleotide (FMN) from the biomass objective function | |
| 10 | 12 | Rv1412 | ribC | FP | Vitamin and cofactor metabolism | Synthesis of riboflavin | (1) Removed riboflavin and FMN from the biomass objective function | |
| 11 | 13 | Rv2671 | ribD | FP | Vitamin and cofactor metabolism | Synthesis of riboflavin precursor | (1) Removed riboflavin and FMN from the biomass objective function | |
| 12 | 14 | Rv2786c | ribF | FP | Vitamin and cofactor metabolism | Synthesis of FMN from riboflavin | (1) Removed FMN from the biomass objective function | |
| 13 | 15 | Rv2421c | Rv2421c | FP | Vitamin and cofactor metabolism | Synthesis of deamino-NAD+ | (1) Removed nicotinamide adenine dinucleotide (NAD) and nicotinamide adenine dinucleotide phosphate (NADP) from the biomass objective function | |
| 14 | 16 | Rv1596 | nadC | FP | Vitamin and cofactor metabolism | Functions as nicotinate-nucleotide diphosphorylase | (1) Removed NAD and NADP from the biomass objective function | |
| 15 | 17 | Rv3215 | entC | FP | Vitamin and cofactor metabolism | Synthesis of isochorismate | (1) Removed menaquinol 8 from the biomass objective fucntion | |
| 16 | 18 | Rv1568 | bioA | FN | Vitamin and cofactor metabolism | Synthesis of a precursor of biotin | (1) Added biotinyl-5'-AMP to the biomass objective function | |
| 17 | 19 | Rv1569 | bioF | FN | Vitamin and cofactor metabolism | Synthesis of a precursor of biotin | (1) Added biotinyl-5'-AMP to the biomass objective function and blocked the ability of bioF2 (Rv0032) to catalyze the same reaction | |
| 18 | 20 | Rv1589 | bioB | FN | Vitamin and cofactor metabolism | Synthesis of biotin | (1) Added biotinyl-5'-AMP to the biomass objective function | |
| 19 | 21 | Rv2211c | gcvT | FN | Vitamin and cofactor metabolism | Conversion between 5-formyltetrahydrofolate and 5,10-methenyltetrahydrofolate | (1) Added the metabolite 5-formyltetrahydrofolate to the biomass objective function | |
| 20 | 22 | Rv3001c | ilvC | FP | Amino acid metabolism | Synthesis of 2,3-dihydroxy-3-methylbutanoate and 2,3-dihydroxy-3-methylpentanoate | (1) Allowed the uptakes of isoleucine and valine | [61] |
| 21 | 23 | Rv3002c | ilvN | FP | Amino acid metabolism | Synthesis of acetolactate | (1) Allowed the uptake of valine | [61] |
| 22 | 24 25 26 27 |
Rv2220c Rv1878 Rv2222c Rv2860c |
glnA1 glnA3 glnA2 glnA4 |
FP FP FP FP |
Amino acid metabolism | Synthesis of glutamine | (1) Let the reaction of glutamate synthesis from glutamine to be reversible (2) Let the conversion to CTP and glutamate from UTP and glutamine be reversible |
|
| 23 | 28 | Rv3754 | tyrA | FP | Amino acid metabolism | Functions as prephenate dehydrogenase | (1) Allowed the uptake of tyrosine | |
| 24 | 29 | Rv3042c | serB2 | FN | Amino acid metabolism | Remove a phosphate group from phosphoserine to produce serine | (1) Blocked the ability of serB (Rv0505c) to catalyze the same reaction | |
| 25 | 30 | Rv2231c | cobC | FN | Amino acid metabolism | Convert glutamate into histidinol-phosphate | (1) Blocked the ability of hisC2 (Rv3772) and hisC (Rv1600) to catalyze the conversion | |
| 26 | 31 | Rv2945c | lppX | FN | Transport | Transport phthiocerol dimycocerosate A and phenol phthiocerol dimycocerosate out of the cell | (1) Added extracellular phthiocerol dimycocerosate A to the biomass objective function (2) Added extracellular phenol phthiocerol dimycocerosate to the biomass objective function |
[62] |
| 27 | 32 33 34 |
Rv1236 Rv1237 Rv1238 |
sugA sugB sugC |
FN | Transport | Transport of glucose, maltoheptaose, maltose, ribose, trehalose, and xylose into cell | (1) Allowed xylose uptake and added xylose to the biomass objective function | |
| 28 | 35 | Rv3236c | kefB | FN | Transport | Transport of K+ and Na+ into the cell | (1) Blocked the function of potassium ABC transporter (2) Blocked the function of the Na+ antiporter |
|
| 29 | 36 | Rv1699 | pyrG | FP | Nucleotide metabolism | Synthesis of CTP from UTP | (1) Allowed the uptake of cytidine | |
| 30 | 37 | Rv1385 | pyrF | FP | Nucleotide metabolism | Functions as orotidine-5'-phosphate decarboxylase | (1) Allowed the uptake of cytidine | |
| 31 | 38 | Rv2139 | pyrD | FP | Nucleotide metabolism | Functions as dihydroorotic acid dehydrogenase | (1) Allowed the uptake of cytidine | |
| 32 | 39 | Rv3393 | iunH | FP | Nucleotide metabolism | Hydrolysis of inosine | (1) Let the reaction catalyzed by ribokinase be reversible | |
| 33 | 40 | Rv2465c | rpi | FP | Pentose phosphate pathway | Functions as ribose-5-phosphate isomerase | (1) Allowed the secretion of D-arabinose | |
| 34 | 41 | Rv3628 | ppa | FP | Multiple pathways | Functions as inorganic diphosphatase | (1) let the reaction catalyzed by nucleoside triphosphate tripolyhydrolase of deoxy-GTP (dGTP) to be reversible | |
| 35 | 42 | Rv3588c | Rv3588c | FN | Multiple pathways | Conversion between carboxylic acid and carbon dioxide | (1) Blocked the ability of Rv3273 to catalyze the same reaction | |
Of the 25 genes that were incorrectly predicted to be non-essential (FN) under in vivo conditions, 18 genes were corrected and became essential in the iNJ661v network. Of the 76 genes that were incorrectly predicted to be essential (FP) under in vivo conditions, 24 genes were corrected and became non-essential in the iNJ661v network. We classified the overall 42 (18 + 24) genes into 35 gene groups, defined as a group of genes whose products catalyze the same reaction(s).
In Step IV, we re-examined the assigned nutrient uptakes in the networks as outlined in the Methods Section. This analysis was performed for each of the 16 network realizations from Step III, each yielding the same set of uptakes. Table 3 shows that this set of uptakes comprises the default uptakes of H2O and H+ (these two metabolites are always considered to be available), a minimum number of uptakes of small molecules, uptakes added based on the Step II analysis, and glycerol. We further decreased the upper limit of glycerol input to 0.06 mmol·h-1·gram dry weight-1 until lower values of the glycerol input caused the fum gene to be incorrectly predicted as essential under in vivo conditions. Each of the resultant 16 networks contained the same set of uptakes and yielded the same number of correct predictions. Since we had no prior information to discriminate among these networks, we applied all modifications to iNJ661 m. Because this combination did not generate any new incorrect gene essentiality predictions, we designated this network as the "optimal" unbiased construction of the in vivo network iNJ661v.
Table 3.
Nutrient uptakes in the iNJ661v network.
| Uptake type | Nutrients | Supporting Literature (References) | |
|---|---|---|---|
| Default uptakes | H2O H+ |
||
| Oxygen | O2 | [7,31] | |
| Phosphorus | HPO42- | ||
| Uptakes of small | Sulphur | SO42- | |
| molecules | Iron | Fe3+ | [64] |
| Potassium | K+ | ||
| Sodium | Na+ | ||
| Nitrogen | NO3-, NH4+ | [63] | |
| Uptakes added in Step II | Hexadecanoate, octadecanoate, octanoate, dodecanoate, arachidic acid, and hexacosanoate |
[8,28,32,52-57] | |
| Isoleucine and valine |
[61] | ||
| cytidine and xylose |
|||
| Other necessary uptakes | Glycerol | [8,28,32,52-57] | |
The iNJ661v network contained 663 genes, 838 metabolites, and 1,049 reactions and is provided in the Additional files in both Systems Biology Markup Language (Additional file 4) and Excel formats (Additional file 5). Based on this network, we re-calculated gene essentiality through FBA and compared the predictions with the experimental essentiality data in mice [34,36]. Table 1 shows the results from the comparison of the in vivo gene essentiality predictions of iNJ661v with those obtained using the in vitro networks. The sensitivity and specificity of the iNJ661v network model were substantially larger than those of the other two networks regardless of the threshold used to determine essentiality. When iNJ661v was used to predict in vivo essentiality, we gained in our ability to classify essentiality (MCC values of ~0.41-0.47) compared with using the in vitro networks (MCC values of ~0.06-0.11). Thus, a significant correlation between experimental gene essentiality in mice and calculated mutant growth rates was only present in iNJ661v.
We further applied threshold-independent statistical tests to compare the abilities of iNJ661, iNJ661 m, and iNJ661v to predict experimental gene essentiality under in vivo conditions. Figure 6 shows the ROC curves of the three networks. For each curve, we obtained the 95% confidence interval of the AUC (iNJ661: 0.57 ± 0.09, iNJ661m: 0.57 ± 0.09, and iNJ661v: 0.84 ± 0.06). The AUCs of the in vitro models iNJ661m and iNJ661 were not significantly larger than those of random predictions (0.50), indicating the inability of these networks to predict in vivo essentiality. Conversely, the AUC of iNJ661v was significantly larger than those of the other two networks, demonstrating that iNJ661v was better able to predict experimental gene essentiality in mice.
Figure 6.
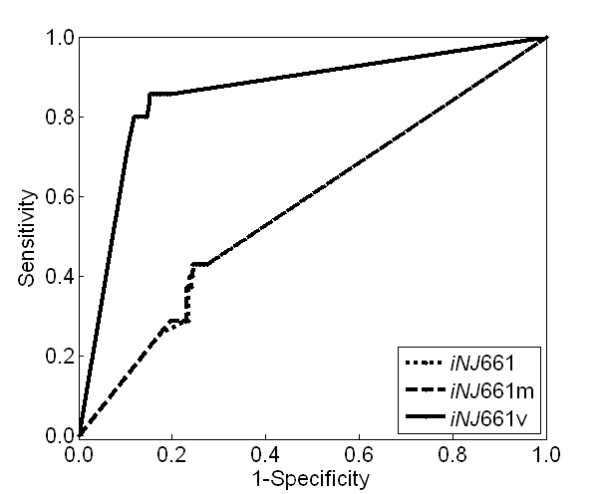
Receiver operating characteristic (ROC) curves for gene essentiality predictions of Mycobacterium tuberculosis. Sensitivity [TP/(TP + FN)] and 1 minus specificity [1 - TN/(TN + FP)] (where TP: true positive, FN: false negative, TN: true negative, and FP: false positive) were calculated as a function of the growth ratio thresholds used to determine gene essentiality in three different network models: iNJ661 (dotted curve), iNJ661m (dashed curve), and iNJ661v (solid curve).
After Step IV, the iNJ661v network still contained several incorrect gene essentiality predictions. Table 4 shows the seven FN predictions that we were unable to correct. We failed to correct the predictions for the atpB, nirA, proV, accD1, and cobL genes because each one of them is required together with one or more TN genes. For example, the FN gene proV is required together with the TN genes proW, proX, and proZ for the transport of choline, carnitine, glycine betaine, and proline into the cell [15]. Any "correction" of proV would change the TN predictions for proW, proX, and proZ into FP. It is likely that the gene products of proV have other essential functions that may or may not be related to metabolic functions and were not accounted for in the current network description. Conversely, we failed to correct the prediction for the Rv3534c gene because it belongs to a pathway containing a metabolite without a source. Thus, further studies are necessary to discover how this metabolite is synthesized and how this information can be incorporated into the network.
Table 4.
False negative (FN) predictions that could not be corrected by our network modifications.
| Gene Locus | Gene Name | Pathway | Function/Reaction | Reasons Why Network Modification Could Not Be Made |
|---|---|---|---|---|
| Rv1304 | atpB | Purine metabolism | Synthesis of ATP | The product of this gene catalyzes the reaction together with that of the TN gene atpH |
| Rv2391 | nirA | Vitamin and cofactor metabolism | Reduction of nitrite | The product of this gene catalyzes the reaction together with that of the TN gene nirB |
| Rv3758c | proV | Transport | Transport of choline, L-carnitine, glycine betaine, and proline | The product of this gene catalyzes the transport of choline, L-carnitine, glycine betaine, and proline together with the TN genes proZ, proW, and proX |
| Rv2502c | accD1 | Sugar metabolism | Convert propionyl-CoA into S-methylmalonyl-CoA | The product of this gene catalyzes the reaction together with the TN gene accA2 |
| Rv2072c | cobL | Porphyrin metabolism | Production of S-adenosyl-L-homocysteine | The product of this gene catalyzes the synthesis of cobalamin together with the TN genes cobK, cobM, cobH, cobN, cobI, and cobG |
| Rv3534c | Rv3534c | Pyruvate metabolism | Convert 4-hydroxy-2-oxopentanoate into pyruvate | In a pathway without any synthesis or uptake reaction for the metabolite 4-hydroxy-2-oxopentanoate |
| Rv2241 | aceE | Glycolysis/gluconeogenesis | Convert pyruvate into acetyl-CoA | Unable to determine the reason |
A false negative (FN) prediction refers to a gene incorrectly predicted to be non-essential.
Literature Analysis and Verification
By design, our automated and systematic analysis of the in silico/in vivo growth inconsistencies generated by the original iNJ661m metabolic network created a network (iNJ661v) that was more compatible with in vivo growth. The metabolic modifications reflected how the pathogen adjusts its metabolism to adapt to the environment that M. tuberculosis confronts during infection in the mouse. Here, we discuss the performed modifications vis-a-vis the available relevant literature within the context of the affected metabolic pathways. Table 2 shows the reviewed literature associated with each of the performed modifications ordered by the affected pathway.
In the "glycolysis/gluconeogenesis" pathways, we deleted the uptake of glucose from the environment and blocked the synthesis of glucose from maltose and trehalose to correct the FN predictions of the Rv1099c and ppgK genes. This modification suggested that the host environment may lack glucose and, thus, forces M. tuberculosis to generate glucose through gluconeogenesis (the pathway to synthesize glucose from the citric acid cycle). In the "fatty acid metabolism" pathways, to correct the FP prediction of the fabG2, inhA, and pks15 genes and the FN prediction of the desA3 gene, we added the uptakes of several fatty acids from the host environment and blocked the synthesis of a fatty acid, hexadecenoate. This modification suggested that fatty acids were available in the host environment and that M. tuberculosis stopped synthesizing them under in vivo conditions. In summary, the modifications in these two groups of pathways, along with the retention of glycerol uptake (see Table 3), suggested that the survival of M. tuberculosis during infection in the mouse required lipids (composed of fatty acids and glycerol) instead of glucose as its primary source of carbon. The important role of lipids as carbon sources is evident from the observed up-regulation of genes involved in fatty acid catabolism during M. tuberculosis in vivo growth [8,28,52-55], M. tuberculosis growth in dipalmitoyl phosphatidylcholine (a lipid present in the mammalian lung) medium [32], the ability of the bacterium to hydrolyze lecithin into fatty acids [8,56], and the potential role of human serum as a highly effective fatty acid source [57].
In the pathways associated with "vitamin and cofactor metabolism," we removed riboflavin from the biomass objective function to correct the FP prediction of the ribH, ribC, and ribD genes. The removal suggested that riboflavin was not required for the survival of M. tuberculosis under in vivo conditions, which is supported by the observation that riboflavin is used for glycolysis (the pathway of glucose catabolism) in M. tuberculosis [58] and that glucose is not a carbon source for the pathogen in the host environment [8]. In the same pathways, we also corrected the FN predictions associated with the bioA, bioF, and bioB genes by adapting the biomass objective function to include biotinyl-5'-adenosine monophosphate (AMP) and blocked the ability of the gene product of the bioF2 gene to catalyze the synthesis of the precursor of biotin. Because biotinyl-5'-AMP is the activated form of biotin [59], the inclusion of biotinyl-5'-AMP suggests that biotin is required for the survival of M. tuberculosis under in vivo conditions. This observation is compatible with biotin playing a role in gluconeogenesis [60] and that M. tuberculosis obtains glucose through gluconeogenesis under in vivo conditions [8]. The blockade of BioF2 indicated that the enzyme may be inhibited under in vivo conditions, which is commensurate with the observed down-regulation of bioF2 in the presence of hydrogen peroxide (H2O2) [28], a reactive oxygen species that would be encountered in an intra-phagosomal environment.
In the "amino acid metabolism" pathways, we added uptakes of isoleucine and valine to correct the FP predictions of the ilvC and ilvN genes, suggesting that M. tuberculosis might be able to absorb these amino acids from the host environment. Although we could not directly verify these uptakes in M. tuberculosis, experiments have shown that a M. tuberculosis strain that lacks the ability to synthesize three amino acids (valine, isoleucine, and leucine) could persist in mice for four weeks [61]. This suggests that these amino acids might be available, although in limited amounts, in the host environment to compensate for the organism's inability to synthesize these amino acids.
We also examined the modifications with respect to genes and reactions involved in "transport pathways." In this group of pathways, we added two extracellular lipids, phthiocerol dimycocerosate A and phenol phthiocerol dimycocerosate, to the biomass objective function to correct the FN prediction of the lppX gene. The biomass objective function of iNJ661 and the in vivo biomass objective function of GSMN-TB include intracellular phthiocerol dimycocerosate A. In fact, these lipids are known to be secreted by M. tuberculosis into the environment and subsequently are associated with the pathogen envelope, where they aid in avoiding host immune attacks [62]. It is somewhat unusual to add extracellular metabolites to the biomass objective function; however, given the localization of the two lipids to the pathogen's envelope, they can be considered as integral to the pathogen and, hence, to the biomass. Moreover, our additions of the uptakes of NO3-, O2, and Fe3+ (see Table 3) were supported by the existence of NO3- in infected tissue [63], the detection of O2 in mouse lung granulomas [7,31], and the ability of M. tuberculosis to synthesize mycobactin, a chemical with a very high affinity for iron, to obtain iron from the host environment [64].
The lack of detailed experimental evidence for many modifications, as shown in Table 2, indicates that there are currently gaps of knowledge associated with M. tuberculosis metabolism. For example, in the transport pathways, we corrected the FN predictions of the sugA, sugB, and sugC genes by adding xylose uptake and including xylose in the biomass objective function. These modifications suggest that M. tuberculosis should have a xylose utilization pathway, although this is absent in current metabolic network descriptions of M. tuberculosis. The existence of such a pathway is indicated by the experimental observation that M. tuberculosis is able to use xylose under the presence of glycerol [65]. Conversely, although sequence analysis has suggested that the sugABC operon encodes a sugar-transporting system, it is unclear what sugar molecules the system transports [66], suggesting that there might be other possible reasons for the sugABC transport system to be essential.
Growth prediction of double-deletion mutants
Double-gene deletion experiments provide insights into redundant pathways, non-obvious coupling of metabolite flows, and potential new drug targets. For example, although neither the ERG11A gene nor the ERG11B gene in Aspergillus fumigatus is individually essential, the deletion mutant of these two genes is not viable in immune-compromised mice, suggesting the pair of genes as a combined drug target [67]. Large-scale experimental double-gene deletion requires substantial efforts, whereas the corresponding in silico simulations of deleted gene pairs are readily available. Comparative studies for yeast (Saccharomyces cerevisiae) have shown that 49% of the predicted synthetically lethal double-deletion mutants are correct [68-70]. In silico studies of the growth of double-deletion mutants of metabolic genes have also been performed for E. coli [71], Helicobacter pylori [14], and Leishmania major [19], although the bulk of these predictions could not be verified due to the paucity of experimental data.
We initially examined the capability of iNJ661m and iNJ661v to model the growth of two experimentally examined double-gene deletion mutants. In the first case, experimental work showed that the growth of the ΔpanCD mutant (deletion of Rv3602c and Rv3601c) is highly attenuated in mice [72]. FBA of both iNJ661m and iNJ661v predicted that ΔpanCD mutants have a growth rate of zero, consistent with the experimental observation. Although not confirmed experimentally, our analysis of iNJ661m indicated that the growth attenuation may also take place within an in vitro medium. In the second case, experimental work has indicated that the mutant Δicl1Δicl2 (deletion of Rv0467 and Rv1915) of M. tuberculosis cannot survive in mice but can grow under certain in vitro conditions [32]. FBA of iNJ661m predicted that the growth rate of Δicl1Δicl2 was equal to that of wild-type M. tuberculosis, whereas analysis of iNJ661v predicted that the growth rate of Δicl1Δicl2 was only 26% of the wild-type rate, suggesting that iNJ661v was a better predictor for in vivo growth.
We then performed a comprehensive FBA of iNJ661m and iNJ661v to simulate the growth of M. tuberculosis double-gene deletion mutants under an in vitro condition and an in vivo condition, respectively, and predicted synthetic lethality. Additional file 1, Table S2 shows the complete results of these calculations, and Additional file 1, Figure S1 shows the mapping of synthetic essential gene pairs in iNJ661v to carbon metabolism-related pathways. Figure 7 shows the number of essential gene pairs that were uniquely and commonly predicted by these two networks (iNJ661m and iNJ661v). The iNJ661v network predicted a substantially larger number of synthetically lethal genes under in vivo conditions than the iNJ661m network under in vitro conditions. This was partly due to the more constrained nutritional environment faced by iNJ661v with respect to carbon metabolism. Although drugs effective under in vitro conditions may not be effective under in vivo conditions, the converse may also be true [9]. The additional 131 gene pairs identified in iNJ661v indicate novel potential drug targets under in vivo conditions. Likewise, the 35 gene pairs that were predicted to be essential under both conditions may represent more robust drug targets based on their insensitivity to environmental conditions.
Figure 7.

Number of essential gene pairs predicted using iNJ661m and iNJ661v. Flux balance analysis of iNJ661m under in vivo conditions predicted 78 essential gene pairs, whereas iNJ661v predicted 166 essential gene pairs. There were 35 gene pairs predicted to be essential by both network descriptions; 131 gene pairs were only predicted to be essential using iNJ661v, whereas 43 gene pairs were only predicted to be essential using iNJ661 m. Most of the jointly predicted gene pairs were involved in amino acid and nucleotide metabolism.
The bulk of the 131 gene pairs uniquely predicted to be essential for bacterial growth using iNJ661v were related to carbon and energy metabolism. This reflects the modifications that we implemented in iNJ661v to reproduce the in vivo gene essentiality data in these parts of the metabolic network. Synthetic lethality in carbon metabolism was primarily located in the two different pathways that can be used to synthesize glucose precursors from glycerol and fatty acids (as shown by the red color in Additional file 1, Figure S1 and Table S2). Other enzyme pairs that exhibited synthetic essentiality in iNJ661v were those who catalyzed the same reaction, i.e., each enzyme by itself was not essential, but if they were both deleted at the same time, the reaction could not proceed and the organism would stop growing. Additional file 1, Table S2 shows that this group includes Rv2476c, gltB, and gltD, whose gene products were necessary for converting α-ketoglutarate into glutamate. An additional 76 synthetically essential gene pairs were involved in energy metabolism. We also analyzed the 35 synthetically essential gene pairs that were common to both iNJ661m and iNJ661v. This set was enriched in gene pairs that were involved in amino acid and nucleotide metabolism, supporting the suggestion that these metabolic processes could be common drug targets under both in vitro and in vivo conditions [34].
Exploration of the metabolism of M. tuberculosis using the in vivo iNJ661v network
The gene essentiality data used to help construct the in vivo network produced non-obvious changes in the flow of metabolites and uptakes of nutrients from the environment. Analyses of this in vivo-compatible metabolic network of M. tuberculosis allow us to probe the metabolic state and metabolic adaptation of the pathogen to the host environment, opening-up new avenues for targeting specific enzymes or pathways that cannot be observed under in vitro conditions. Here, we briefly explored the M. tuberculosis metabolism as related to its adaptation to living in an acidic environment, the importance of the tricarboxylic acid (TCA)-cycle under different limiting nutrient conditions, the effects of inhibiting multiple reactions, and the modes of cellular respiration during infection.
The macrophage phagosome presents a generally hostile environment with an acidic pH ranging from 6.2 to 4.5 [73]. The specific mechanism by which M. tuberculosis adapts to this acidic condition has not been fully elucidated [74]. One well-known protective feature is the waxy (primarily mycolic acid) cell envelope that forms a barrier against unwanted H+ entry [74]. In the context of metabolism, it is speculated that the urease reaction presents another acid adaptation mechanism by converting H+ and urea into NH4+ and CO2 [75,76]. The produced NH4+ also contributes to the M. tuberculosis survival by preventing the maturation of the phagosome [77]. We used the iNJ661v network to explore additional acid adaptation mechanisms based on the metabolic flow of H+. We used flux variability analysis (FVA) to estimate the ranges of reaction fluxes in the metabolic network at the optimal growth rate. This allowed us to estimate the range of the overall H+ exchange between the environment and the M. tuberculosis cells at the optimal growth rate for wild type iNJ661v. The protonation state of the metabolites is chosen to correspond to pH 7.2 [78]. Because we only considered the steady state H+ flux in both in vitro and in vivo metabolic network models, the protonation states of the metabolites were not changed in this calculation. Table 5 shows that the overall H+ exchange was within a narrow range of negative values, suggesting that the in vivo metabolism consumed H+ as a whole, contributing to the relief of acidic stress. The primary reaction important for this H+ consumption was the nitrite reductase (NR) reaction that uses H+ and reduces NO2- into NH4+. Table 5 shows that the fluxes through NR of wild type iNJ661v were positive but did not vary, suggesting that there must be flux through this reaction at the optimal growth of wild type cells. Conversely, for mutants whose NR was removed (denoted as ΔNR in Table 5), the overall H+ exchange could only be positive. Given the neutralization as well as the protective effect of creating NH4+ [77], NR is a strong candidate for playing an important function in the in vivo adaptation of M. tuberculosis in acidic environments.
Table 5.
Flux ranges for overall hydrogen ion (H+) exchanges and other related reactions.
| Network | Strain |
Overall H
+
exchange (mmol/h/gDW) |
Nitrite reductase flux (mmol/h/gDW) |
Urease flux (mmol/h/gDW) |
|||
|---|---|---|---|---|---|---|---|
| Min | Max | Min | Max | Min | Max | ||
| iNJ661v | Wild type | -1.99 | -1.93 | 1.00 | 1.00 | 0.00 | 0.00 |
| ΔNR | 0.04 | 0.07 | 0.00 | 0.00 | 0.00 | 0.00 | |
| iNJ661v | Wild type | -3.96 | -3.90 | 1.00 | 1.00 | 0.99 | 1.00 |
| with urea uptake |
ΔNR | -1.94 | -1.90 | 0.00 | 0.00 | 0.99 | 1.00 |
| iNJ661m | Wild type | 2.36 | 3.09 | 0.00 | 0.00 | 0.00 | 0.00 |
| ΔNR | 2.36 | 3.09 | 0.00 | 0.00 | 0.00 | 0.00 | |
| iNJ661m | Wild type | 0.43 | 0.91 | 0.00 | 0.00 | 0.99 | 1.00 |
| with urea uptake |
ΔNR | 0.43 | 0.91 | 0.00 | 0.00 | 0.99 | 1.00 |
Overall hydrogen ion (H+) exchange indicates the total H+ exchange between the environment and the Mycobacterium tuberculosis cells. A negative value of the exchange indicates that M. tuberculosis consumes H+ as a whole, while a positive value indicates that the metabolism generate a H+ surplus, i.e., increases acidification of the environment. The minimum (Min) and maximum (Max) fluxes reflected the ranges of the fluxes at the optimal growth and were obtained through flux variability analyses of iNJ661v and iNJ661 m. ΔNR represents the strain in which nitrite reductase (NR) was blocked. The unit of mmol/h/gDW represents mmol per hour per gram dry weight of M. tuberculosis.
In order to more comprehensively study acid adaptation/resistance we examined the role of NR in the presence of urease [75,76]. Because the iNJ661 (and the GSMN-TB) network does not include a complete urea synthesis pathway, we added a urea uptake in order to create a flux through the urease reaction. Table 5 shows the estimated ranges of the H+ exchange and the reaction fluxes for iNJ661v with urea uptake. Overall, H+ is consumed to relieve acid stress. In the wild type strain, the flux through the NR reaction was greater than zero, suggesting that NR still contributes to H+ consumption in the presence of urease. Removal of the NR reaction (ΔNR mutant) diminished H+ consumption, but did not abolish the overall H+ exchange. Importantly, we performed the same analysis for the in vitro iNJ661m network and found that the NR reaction was always inactive, suggesting that NR does not play a role in acid adaptation in the in vitro medium (Table 5, last two rows). In conclusion, NR contributes to the acid adaptation under in vivo conditions even in the presence of other acid adaptation mechanisms. The importance of NR in acid resistance might be experimentally tested by inactivating the NR reaction and examining cellular growth under in vivo conditions or in vitro low-pH environments with freely available nitrite or nitrate.
Persistence and slow growth are clinically important states of the M. tuberculosis pathogen. Metabolic network models can be used to study the metabolic states associated with these conditions under a variety of conditions that mimic slow growth. In the development of the GSMN-TB model, Beste and co-workers induced slow growth by limiting the uptake of glycerol and high-lighted the corresponding changes in reaction fluxes in the glyoxylate shunt pathway [16]. Considering that fatty acids are the major carbon sources for in-host M. tuberculosis [32], here we simulated nutrient limitation to probe slow in vivo growth by reducing fatty acid uptake. We performed FVA to estimate the ranges of the fluxes through the reactions in the TCA cycle and the glyoxylate shunt pathway under slow (reduced nutrient availability) and fast (normal nutrient availability) growth. We simulated the slow in vivo growth by constraining fatty acid uptake of iNJ661v until the growth rate was one third of its original value [16], and fast growth by keeping the constraints unchanged. For each reaction we calculated the ratio of the midpoint of the flux range for slow growth to that for fast growth, where each flux was normalized to the corresponding total growth rate. This ratio represents a relative value of the fluxes and can be used to compare the relative importance of specific reactions.
Figure 8 shows the relevant metabolites and enzymes and highlights the significantly decreased ratios in the glyoxylate shunt pathway and increased reaction fluxes in parts of the TCA cycle. The increased reaction fluxes in iNJ661v included the 2-oxoglutarate decarboxylase (OXGDC) and succinate-semialdehyde dehydrogenase (SSAL) reactions, suggesting that these reactions were likely to be important in fatty-acid-limited slow growth. The previously suggested increased flux and importance of isocitrate lyase (ICL) under slow-growth conditions is a direct consequence of the glycerol limitation [16]. In fatty-acid-limited slow growth, which is consistent with the in vivo metabolic state, the OXGDC and SSAL reactions took on a heightened function and importance in slow-growth maintenance. The suggested metabolic responses to fatty-acid-limited growth rate could be experimentally tested by measuring the activities of the enzymes in the TCA cycle of M. tuberculosis during slow and normal growth in host environment or in an in vitro condition infused with fatty acids as carbon sources.
Figure 8.

Metabolic responses of the iNJ661v network to fatty-acid-limited growth. Metabolite flow was characterized for enzymes in the tricarboxylic acid cycle and the glyoxylate shunt pathway. The numbers in the graph indicate ratios of normalized flux-range midpoints. These were calculated based on flux variability analysis for slow and fast growth conditions, where the fluxes were normalized by dividing by the corresponding total growth rates. This normalization removes artifacts introduced by the lower absolute reaction fluxes associated with induced slow growth [16]. CS, citrate synthase; ACONT, aconitase; ICDHy, isocitrate dehydrogenase; OXGDC, 2-oxoglutarate decarboxylase; SSAL, succinate-semialdehyde dehydrogenase; FRD, fumarate reductase; SUCD, succinate dehydrogenase; FUM, fumarase; MDH, malate dehydrogenase; MALS, malate synthase.
Given the ability of the metabolic network to provide different reaction fluxes under different metabolic conditions, we can explore combinations of mechanisms to inhibit multiple reactions to derive optimal in vivo growth-reduction strategies. Drug combinations that achieve optimal therapeutic response and avoid side effects caused by high doses of single drugs [79,80] can rapidly be examined using these modeling techniques. To illustrate this concept, we constructed an example to investigate double-reaction inhibition using metabolic network modeling. Given that the primary in vivo nutrients are lipids, we focused on two reactions that are required to process these metabolites, i.e., the glycerol-3-phosphate dehydrogenase (G3PD) reaction, which is necessary for the utilization of glycerol, and the ICL reaction, which is a known potential drug target and is required for the conversion of fatty acids into other metabolites, such as pyruvate [32]. To study the effect of this combined inhibition, we calculated growth rates under a set of upper limits of the fluxes through the ICL and G3PD reactions. Figure 9 shows the calculated growth rates under different upper limits for the two reactions for both the in vivo iNJ661v (panel A) and in vitro iNJ661m (panel B) networks.
Figure 9.

Predicted effects of a double-reaction inhibition on the in vivo growth of Mycobacterium tuberculosis. The two inhibited reactions were isocitrate lyase (ICL) and glycerol-3-phosphate dehydrogenase (G3PD). The growth rates (in units of h-1) were calculated based on flux balance analysis with different upper limits of the fluxes through the two reactions. The upper limits are in unit of mmol/h/gDW, i.e., mmol per hour per gram dry weight of M. tuberculosis. Panel A shows the results of the combinational inhibition using the iNJ661v network; panel B shows the in vitro iNJ661m results.
In these graphs, the lower left hand corner corresponds to the most stringent blockage of both reactions, i.e., where the fluxes for each reaction was constrained to be ≤10-3 mmol/h/gDW. Figure 9A, illustrating the in vivo results, shows that these flux limits effectively blocked growth of the organism as indicated by the blue color designating strongly retarded growth rates. One can also see that whereas the ICL reaction is essential, i.e., the organism cannot effectively grow if this reaction is sufficiently inhibited, single blockage of the G3PD reaction would not prevent growth if the ICL reaction was left unconstrained (top portion of Figure 9A). It was also clear that limiting the G3PD flux (i.e., going from right to left in Figure 9A) further decreased the growth rate at virtually all ICL flux values. This indicates that for a given desired growth-rate reduction, one could use a combination of ICL and G3PD inhibitions to achieve the same effect as those possible with a stringent single ICL inhibition. If these fluxes can be inhibited by drugs, reducing the dose of the most toxic drug to achieve the same therapeutic response would decrease risk of potential side effects. Moreover, we performed the same calculation for iNJ661m and observed no combinatorial effect of the inhibition. Figure 9B shows that when we constrained the fluxes through the ICL and G3PD reactions to zero, the growth rate was still close to that of unconstraint growth. It is clear that the iNJ661v network is instrumental in delineating combinatory inhibition strategies while the in vitro iNJ661m network is not.
Finally, we examined the results of the iNJ661v double deletion mutants with respect to cellular respiration during infection. Additional file 1, Table S2 shows that the genes corresponding to the cytochrome bd oxidase (cydB-cydD and appC) and the nitrate reductase (narG-narJ) enzymes were synthetically essential. Because these two enzymatic groups are associated with aerobic and anaerobic respiration, respectively, synthetic essentiality indicates that therapy targeting cellular respiration needs to simultaneously inhibit both aerobic and anaerobic respiration. This conclusion is not evident from gene expression data, which instead indicates that seven weeks post-infection the pathogen only employs nitrate reductase enzymes for anaerobic respiration [81]. However, gene essentiality data indicate that all genes corresponding to these enzymes (narG-narJ) are non-essential in mice, even after seven weeks [34], indicating that anaerobic respiration is not the only available option to the pathogen and that O2 is available to the bacterium in the host environment [31]. Therefore, dual inhibition of aerobic and anaerobic is necessary to fully arrest bacterial respiration. This hypothesis can be experimentally tested by simultaneously deleting both gene groups and testing for differential growth of M. tuberculosis under in vivo and in vivo conditions.
In summary, we used the developed iNJ661v network to explore metabolism-based M. tuberculosis acid adaptation mechanisms, study metabolic responses to in vivo slow growth, estimate the effects of different levels of inhibitions of multiple reactions, and gain insights into respiration-targeting therapy.
Discussion
Although the existing metabolic network of M. tuberculosis iNJ661 [15] reproduces experimentally observed growth rates in different media and predicts gene essentiality under in vitro conditions, it lacks predictive power for in vivo gene essentiality. We developed a set of automated procedures that systematically examined possible metabolic modifications to the original iNJ661 network and optimized predictions of experimental in vivo essentiality. By design, the newly developed in vivo network iNJ661v provided significantly better agreement (sensitivity increased from 0.31-0.44 to 0.81-0.86; Table 1) between predicted and experimental in vivo gene essentiality.
Indirectly, the systematic reconstruction of iNJ661v also provided a means to use high-throughput in vivo gene essentiality data to gain insights into the in vivo metabolism of M. tuberculosis. For example, we added fatty acids as inputs from the host environment and removed the ability of the network to take up glucose, indicating that M. tuberculosis uses lipids as the major carbon source for metabolism. This is compatible with the experimentally observed upregulation of genes involved in fatty acid catabolism [8,28,52-55]. Commensurate with the aerobic nature of the organism, our calculations indicated that O2 uptake must be retained under in vivo conditions [7,31,82]. Another example is our inclusion of two extracellular lipids, phthiocerol dimycocerosate A and phenol phthiocerol dimycocerosate, in the biomass objective function. This is appropriate since the two secreted lipids actually associate with the pathogen envelope to help the organism avoid host immune attacks [62] and are thus intimately associated with the organism/cell itself. In addition to providing experimentally confirmed insights, the iNJ661v network allowed us to predict a different and putative much larger set of synthetic double-gene deletion mutants than those obtained under in vitro conditions. Furthermore, using iNJ661v as a model for in vivo metabolism, we proposed that nitrite reductase might play an important role in the metabolic adaptation of M. tuberculosis to an acidic environment, we found specific enzymes in the TCA-cycle that might be important under the fatty-acid-limiting slow-growth condition prevailing in macrophages, we investigated combinatory inhibition of the ICL and G3PD reactions as an effective drug-combination strategy under in vivo nutrient conditions, and found that inhibition of both aerobic and anaerobic respiration were required to fully arrest cellular respiration of M. tuberculosis during infection.
The developed methodology can provide systematic corrections based primarily on discrepancies between predicted and experimental gene essentiality data, which can be used to fine-tune initial metabolic network reconstructions. Here, we built on and expanded the previously developed "GrowMatch" techniques of Kumar and Maranas [39] by extending and enhancing the possible correction steps. This was partly necessitated by the more incomplete state of the M. tuberculosis network compared with that of E. coli, as used by Kumar and Maranas, and the more extensive nature of the required corrections to switch from an in vitro to an in vivo metabolic environment. One major difference was that our procedures included an analysis of the combined modifications (Step III in Figure 1, with details shown in Figure 5) to systematically eliminate undesirable effects, e.g., very small growth rates or new incorrect predictions of gene essentiality.
Although the gene deletion mutant growth measurements used by Sassetti and Rubin [34] to experimentally determine gene essentiality provide time-specific information, the developed iNJ661v network did not include a time-dependent component. In the development of our network, a gene was considered experimentally essential as long as it was deemed to be essential at any time point during the entire eight-week time course spanned by the experiments [34]. We examined this approximation by comparing gene essentiality predictions at the reported time points of one, two, four, and eight weeks post-infection. Additional file 1, Table S3 shows a comparison of the predicted and experimental gene essentiality at different time points, basically showing that there was an overall small, non-time-specific difference between the MCC values for the individual time points and the time-independent value (0.47) shown in Table 1. The sparse nature of the experimental data did not warrant the additional complexity of constructing time-dependent in vivo metabolic networks. However, as both the pathogen and host dynamically change their responses during infection, future work using additional datasets and modeling methodologies will be required to adequately capture this aspect of the in vivo metabolism of M. tuberculosis.
The existence of inaccurate essentiality predictions based on iNJ661v (FN and FP; Table 1) indicate that there is room for further additions and corrections to the network to better capture in vivo metabolism. The modifications that we made to the original in vitro iNJ661 network were relatively minor, as iNJ661v only shows a slightly diminished capability to predict in vitro essentiality data compared with iNJ661 m. The development of the modified in vivo network iNJ661v was ultimately based on the growth of the bacterium under different in vitro conditions (iNJ661) and modifications to better model experimental in vivo gene essentiality. These conditions capture part of the pathogen's metabolic processes, but large knowledge gaps still exist. An analysis of the M. tuberculosis genome indicated that while 1,286 genes are directly associated with metabolic processes (C. Yu, personal communication), only 663 genes were explicitly included in the developed network. This highlights the need for further systematic theoretical analyses to improve the network description and, more importantly, the need for experimental data under a variety of different in vivo and in vitro growth conditions that could be used to guide and validate model development.
Higher fidelity in silico modeling of organisms provides the foundation for the eventual integration of metabolic information with gene regulation and signaling networks to model biological phenomena. Ultimately, the model development presented here can be extended to answer additional questions as they relate to the metabolic status of the pathogen population before, during, and after infection: What nutrients are present in different in vivo compartments, how do they change as infection progresses, and how do they relate to cellular growth rates and population sizes? What is the appropriate objective function to use for the persistent dormant phase of M. tuberculosis infection? What processes does M. tuberculosis use to handle nutrient deficiencies and antagonistic conditions found in macrophages? These are the questions that we can now begin to address using the developed iNJ661v as a more sophisticated in vivo representation of the metabolic network for M. tuberculosis.
Conclusion
M. tuberculosis, the causative agent of TB, continues to pose a major health threat worldwide, with nearly two million deaths annually. Modeling of and accounting for the varying metabolic requirements of M. tuberculosis during host infection can help identify the metabolic enzymes suitable for therapeutic intervention. To this end, we developed procedures to construct an in vivo metabolic network model of M. tuberculosis that maximizes the agreement between predicted and measured gene essentiality determined from infection experiments in the mouse. We verified the modifications obtained computationally by reviewing the available relevant literature. For example, lipids are major carbon sources for M. tuberculosis in the host environment. The network provided a metabolic description of the pathogen consistent with the generally hostile and nutrient-poor in vivo conditions in the host that can be exploited in evaluation, selection, and modeling of novel potential drug targets.
Authors' contributions
All authors contributed to the design and coordination of the study. XF performed the computational implementations, and XF and AW prepared the original draft, which was revised by JR. All authors read and approved the final manuscript.
Supplementary Material
Supplementary materials. It provides the detailed steps for constructing the iNJ661m and iNJ661v networks, and all supplemental tables and figure.
The iNJ661m metabolic network. It describes the iNJ661m metabolic network, using the Systems Biology Markup Language format.
The iNJ661m metabolic network. It describes the iNJ661m metabolic network, using Microsoft Excel 2003.
The iNJ661v metabolic network. It describes the iNJ661v metabolic network, using the Systems Biology Markup Language format.
The iNJ661v metabolic network. It describes the iNJ661v metabolic network, using Microsoft Excel 2003.
Contributor Information
Xin Fang, Email: xfang@bioanalysis.org.
Anders Wallqvist, Email: awallqvist@bioanalysis.org.
Jaques Reifman, Email: jaques.reifman@us.army.mil.
Acknowledgements
We thank Dr. Chenggang Yu for his providing comprehensive analysis on gene annotation of M. tuberculosis to obtain genes directly associated with metabolic processes. This project was funded in part by a competitive In-house Laboratory Independent Research (ILIR) grant by the U.S. Army Assistant Secretary of the Army for Acquisition, Logistics, and Technology (ASAALT). The opinions and assertions contained herein are the private views of the authors and are not to be construed as official or as reflecting the views of the U.S. Army or the U.S. Department of Defense. This paper has been approved for public release with unlimited distribution.
References
- Gillespie SH. Tuberculosis: evolution in millennia and minutes. Biochem Soc Trans. 2007;35:1317–1320. doi: 10.1042/BST0351317. [DOI] [PubMed] [Google Scholar]
- WHO. WHO Report 2008: Global tuberculosis control - surveillance, planning, financing. 2008.
- van den Boogaard J, Kibiki GS, Kisanga ER, Boeree MJ, Aarnoutse RE. New drugs against tuberculosis: problems, progress, and evaluation of agents in clinical development. Antimicrob Agents Chemother. 2009;53:849–862. doi: 10.1128/AAC.00749-08. [DOI] [PMC free article] [PubMed] [Google Scholar]
- Young DB, Perkins MD, Duncan K, Barry CE. Confronting the scientific obstacles to global control of tuberculosis. J Clin Invest. 2008;118:1255–1265. doi: 10.1172/JCI34614. [DOI] [PMC free article] [PubMed] [Google Scholar]
- Anishetty S, Pulimi M, Pennathur G. Potential drug targets in Mycobacterium tuberculosis through metabolic pathway analysis. Comput Biol Chem. 2005;29:368–378. doi: 10.1016/j.compbiolchem.2005.07.001. [DOI] [PubMed] [Google Scholar]
- Mdluli K, Spigelman M. Novel targets for tuberculosis drug discovery. Curr Opin Pharmacol. 2006;6:459–467. doi: 10.1016/j.coph.2006.06.004. [DOI] [PubMed] [Google Scholar]
- Boshoff HI, Barry CE. Tuberculosis - metabolism and respiration in the absence of growth. Nat Rev Microbiol. 2005;3:70–80. doi: 10.1038/nrmicro1065. [DOI] [PubMed] [Google Scholar]
- Munoz-Elias EJ, McKinney JD. Carbon metabolism of intracellular bacteria. Cell Microbiol. 2006;8:10–22. doi: 10.1111/j.1462-5822.2005.00648.x. [DOI] [PubMed] [Google Scholar]
- Scortti M, Lacharme-Lora L, Wagner M, Chico-Calero I, Losito P, Vazquez-Boland JA. Coexpression of virulence and fosfomycin susceptibility in Listeria: molecular basis of an antimicrobial in vitro-in vivo paradox. Nat Med. 2006;12:515–517. doi: 10.1038/nm1396. [DOI] [PubMed] [Google Scholar]
- Smith H. Questions about the behaviour of bacterial pathogens in vivo. Philos Trans R Soc Lond B Biol Sci. 2000;355:551–564. doi: 10.1098/rstb.2000.0597. [DOI] [PMC free article] [PubMed] [Google Scholar]
- Feist AM, Herrgard MJ, Thiele I, Reed JL, Palsson BO. Reconstruction of biochemical networks in microorganisms. Nat Rev Microbiol. 2009;7:129–143. doi: 10.1038/nrmicro1949. [DOI] [PMC free article] [PubMed] [Google Scholar]
- Breitling R, Vitkup D, Barrett MP. New surveyor tools for charting microbial metabolic maps. Nat Rev Microbiol. 2008;6:156–161. doi: 10.1038/nrmicro1797. [DOI] [PubMed] [Google Scholar]
- Feist AM, Henry CS, Reed JL, Krummenacker M, Joyce AR, Karp PD, Broadbelt LJ, Hatzimanikatis V, Palsson BO. A genome-scale metabolic reconstruction for Escherichia coli K-12 MG1655 that accounts for 1260 ORFs and thermodynamic information. Mol Syst Biol. 2007;3:121. doi: 10.1038/msb4100155. [DOI] [PMC free article] [PubMed] [Google Scholar]
- Thiele I, Vo TD, Price ND, Palsson BO. Expanded metabolic reconstruction of Helicobacter pylori (iIT341 GSM/GPR): an in silico genome-scale characterization of single- and double-deletion mutants. J Bacteriol. 2005;187:5818–5830. doi: 10.1128/JB.187.16.5818-5830.2005. [DOI] [PMC free article] [PubMed] [Google Scholar]
- Jamshidi N, Palsson BO. Investigating the metabolic capabilities of Mycobacterium tuberculosis H37Rv using the in silico strain iNJ661 and proposing alternative drug targets. BMC Syst Biol. 2007;1:26. doi: 10.1186/1752-0509-1-26. [DOI] [PMC free article] [PubMed] [Google Scholar]
- Beste DJ, Hooper T, Stewart G, Bonde B, Avignone-Rossa C, Bushell ME, Wheeler P, Klamt S, Kierzek AM, McFadden J. GSMN-TB: a web-based genome-scale network model of Mycobacterium tuberculosis metabolism. Genome Biol. 2007;8:R89. doi: 10.1186/gb-2007-8-5-r89. [DOI] [PMC free article] [PubMed] [Google Scholar]
- Duarte NC, Herrgard MJ, Palsson BO. Reconstruction and validation of Saccharomyces cerevisiae iND750, a fully compartmentalized genome-scale metabolic model. Genome Res. 2004;14:1298–1309. doi: 10.1101/gr.2250904. [DOI] [PMC free article] [PubMed] [Google Scholar]
- Yeh I, Hanekamp T, Tsoka S, Karp PD, Altman RB. Computational analysis of Plasmodium falciparum metabolism: organizing genomic information to facilitate drug discovery. Genome Res. 2004;14:917–924. doi: 10.1101/gr.2050304. [DOI] [PMC free article] [PubMed] [Google Scholar]
- Chavali AK, Whittemore JD, Eddy JA, Williams KT, Papin JA. Systems analysis of metabolism in the pathogenic trypanosomatid Leishmania major. Mol Syst Biol. 2008;4:177. doi: 10.1038/msb.2008.15. [DOI] [PMC free article] [PubMed] [Google Scholar]
- Sheikh K, Forster J, Nielsen LK. Modeling hybridoma cell metabolism using a generic genome-scale metabolic model of Mus musculus. Biotechnol Prog. 2005;21:112–121. doi: 10.1021/bp0498138. [DOI] [PubMed] [Google Scholar]
- Duarte NC, Becker SA, Jamshidi N, Thiele I, Mo ML, Vo TD, Srivas R, Palsson BO. Global reconstruction of the human metabolic network based on genomic and bibliomic data. Proc Natl Acad Sci USA. 2007;104:1777–1782. doi: 10.1073/pnas.0610772104. [DOI] [PMC free article] [PubMed] [Google Scholar]
- Systems Biology Research Group, University of California, San Diego. http://gcrg.ucsd.edu/In_Silico_Organisms/Other_Organisms
- Famili I, Forster J, Nielsen J, Palsson BO. Saccharomyces cerevisiae phenotypes can be predicted by using constraint-based analysis of a genome-scale reconstructed metabolic network. Proc Natl Acad Sci USA. 2003;100:13134–13139. doi: 10.1073/pnas.2235812100. [DOI] [PMC free article] [PubMed] [Google Scholar]
- Raghunathan A, Reed J, Shin S, Palsson B, Daefler S. Constraint-based analysis of metabolic capacity of Salmonella typhimurium during host-pathogen interaction. BMC Syst Biol. 2009;3:38. doi: 10.1186/1752-0509-3-38. [DOI] [PMC free article] [PubMed] [Google Scholar]
- Cole ST, Brosch R, Parkhill J, Garnier T, Churcher C, Harris D, Gordon SV, Eiglmeier K, Gas S, Barry CE. et al. Deciphering the biology of Mycobacterium tuberculosis from the complete genome sequence. Nature. 1998;393:537–544. doi: 10.1038/31159. [DOI] [PubMed] [Google Scholar]
- Fang X, Wallqvist A, Reifman J. A systems biology framework for modeling metabolic enzyme inhibition of Mycobacterium tuberculosis. BMC Syst Biol. 2009;3:92. doi: 10.1186/1752-0509-3-92. [DOI] [PMC free article] [PubMed] [Google Scholar]
- Boshoff HI, Barry CE. A low-carb diet for a high-octane pathogen. Nat Med. 2005;11:599–600. doi: 10.1038/nm0605-599. [DOI] [PubMed] [Google Scholar]
- Schnappinger D, Ehrt S, Voskuil MI, Liu Y, Mangan JA, Monahan IM, Dolganov G, Efron B, Butcher PD, Nathan C, Schoolnik GK. Transcriptional Adaptation of Mycobacterium tuberculosis within Macrophages: Insights into the Phagosomal Environment. J Exp Med. 2003;198:693–704. doi: 10.1084/jem.20030846. [DOI] [PMC free article] [PubMed] [Google Scholar]
- Talaat AM, Lyons R, Howard ST, Johnston SA. The temporal expression profile of Mycobacterium tuberculosis infection in mice. Proc Natl Acad Sci USA. 2004;101:4602–4607. doi: 10.1073/pnas.0306023101. [DOI] [PMC free article] [PubMed] [Google Scholar]
- Colijn C, Brandes A, Zucker J, Lun DS, Weiner B, Farhat MR, Cheng TY, Moody DB, Murray M, Galagan JE. Interpreting expression data with metabolic flux models: predicting Mycobacterium tuberculosis mycolic acid production. PLoS Comput Biol. 2009;5:e1000489. doi: 10.1371/journal.pcbi.1000489. [DOI] [PMC free article] [PubMed] [Google Scholar]
- Aly S, Wagner K, Keller C, Malm S, Malzan A, Brandau S, Bange FC, Ehlers S. Oxygen status of lung granulomas in Mycobacterium tuberculosis-infected mice. J Pathol. 2006;210:298–305. doi: 10.1002/path.2055. [DOI] [PubMed] [Google Scholar]
- Munoz-Elias EJ, McKinney JD. Mycobacterium tuberculosis isocitrate lyases 1 and 2 are jointly required for in vivo growth and virulence. Nat Med. 2005;11:638–644. doi: 10.1038/nm1252. [DOI] [PMC free article] [PubMed] [Google Scholar]
- Hingley-Wilson SM, Sambandamurthy VK, Jacobs WR Jr. Survival perspectives from the world's most successful pathogen, Mycobacterium tuberculosis. Nat Immunol. 2003;4:949–955. doi: 10.1038/ni981. [DOI] [PubMed] [Google Scholar]
- Sassetti CM, Rubin EJ. Genetic requirements for mycobacterial survival during infection. Proc Natl Acad Sci USA. 2003;100:12989–12994. doi: 10.1073/pnas.2134250100. [DOI] [PMC free article] [PubMed] [Google Scholar]
- Sassetti CM, Boyd DH, Rubin EJ. Genes required for mycobacterial growth defined by high density mutagenesis. Mol Microbiol. 2003;48:77–84. doi: 10.1046/j.1365-2958.2003.03425.x. [DOI] [PubMed] [Google Scholar]
- Murphy HN, Stewart GR, Mischenko VV, Apt AS, Harris R, McAlister MS, Driscoll PC, Young DB, Robertson BD. The OtsAB pathway is essential for trehalose biosynthesis in Mycobacterium tuberculosis. J Biol Chem. 2005;280:14524–14529. doi: 10.1074/jbc.M414232200. [DOI] [PubMed] [Google Scholar]
- Oh YK, Palsson BO, Park SM, Schilling CH, Mahadevan R. Genome-scale reconstruction of metabolic network in Bacillus subtilis based on high-throughput phenotyping and gene essentiality data. J Biol Chem. 2007;282:28791–28799. doi: 10.1074/jbc.M703759200. [DOI] [PubMed] [Google Scholar]
- Durot M, Le Fevre F, de Berardinis V, Kreimeyer A, Vallenet D, Combe C, Smidtas S, Salanoubat M, Weissenbach J, Schachter V. Iterative reconstruction of a global metabolic model of Acinetobacter baylyi ADP1 using high-throughput growth phenotype and gene essentiality data. BMC Syst Biol. 2008;2:85. doi: 10.1186/1752-0509-2-85. [DOI] [PMC free article] [PubMed] [Google Scholar]
- Kumar VS, Maranas CD. GrowMatch: an automated method for reconciling in silico/in vivo growth predictions. PLoS Comput Biol. 2009;5:e1000308. doi: 10.1371/journal.pcbi.1000308. [DOI] [PMC free article] [PubMed] [Google Scholar]
- Joyce AR, Palsson BO. Predicting gene essentiality using genome-scale in silico models. Methods Mol Biol. 2008;416:433–457. doi: 10.1007/978-1-59745-321-9_30. full_text. [DOI] [PubMed] [Google Scholar]
- Price ND, Papin JA, Schilling CH, Palsson BO. Genome-scale microbial in silico models: the constraints-based approach. Trends Biotechnol. 2003;21:162–169. doi: 10.1016/S0167-7799(03)00030-1. [DOI] [PubMed] [Google Scholar]
- Becker SA, Feist AM, Mo ML, Hannum G, Palsson BO, Herrgard MJ. Quantitative prediction of cellular metabolism with constraint-based models: the COBRA Toolbox. Nat Protoc. 2007;2:727–738. doi: 10.1038/nprot.2007.99. [DOI] [PubMed] [Google Scholar]
- Caspi R, Foerster H, Fulcher CA, Hopkinson R, Ingraham J, Kaipa P, Krummenacker M, Paley S, Pick J, Rhee SY. et al. MetaCyc: a multiorganism database of metabolic pathways and enzymes. Nucleic Acids Res. 2006;34:D511–516. doi: 10.1093/nar/gkj128. [DOI] [PMC free article] [PubMed] [Google Scholar]
- Kanehisa M, Goto S, Hattori M, Aoki-Kinoshita KF, Itoh M, Kawashima S, Katayama T, Araki M, Hirakawa M. From genomics to chemical genomics: new developments in KEGG. Nucleic Acids Res. 2006;34:D354–357. doi: 10.1093/nar/gkj102. [DOI] [PMC free article] [PubMed] [Google Scholar]
- Henry CS, Zinner JF, Cohoon MP, Stevens RL. iBsu1103: a new genome-scale metabolic model of Bacillus subtilis based on SEED annotations. Genome Biol. 2009;10:R69. doi: 10.1186/gb-2009-10-6-r69. [DOI] [PMC free article] [PubMed] [Google Scholar]
- Jones PA, Scott-Burden T. Activated macrophages digest the extracellular matrix proteins produced by cultured cells. Biochem Biophys Res Commun. 1979;86:71–77. doi: 10.1016/0006-291X(79)90383-8. [DOI] [PubMed] [Google Scholar]
- Marletta MA, Yoon PS, Iyengar R, Leaf CD, Wishnok JS. Macrophage oxidation of L-arginine to nitrite and nitrate: nitric oxide is an intermediate. Biochemistry. 1988;27:8706–8711. doi: 10.1021/bi00424a003. [DOI] [PubMed] [Google Scholar]
- Voskuil MI, Schnappinger D, Visconti KC, Harrell MI, Dolganov GM, Sherman DR, Schoolnik GK. Inhibition of respiration by nitric oxide induces a Mycobacterium tuberculosis dormancy program. J Exp Med. 2003;198:705–713. doi: 10.1084/jem.20030205. [DOI] [PMC free article] [PubMed] [Google Scholar]
- Baldi P, Brunak S, Chauvin Y, Andersen CA, Nielsen H. Assessing the accuracy of prediction algorithms for classification: an overview. Bioinformatics. 2000;16:412–424. doi: 10.1093/bioinformatics/16.5.412. [DOI] [PubMed] [Google Scholar]
- Zweig MH, Campbell G. Receiver-operating characteristic (ROC) plots: a fundamental evaluation tool in clinical medicine. Clin Chem. 1993;39:561–577. [PubMed] [Google Scholar]
- DeLong ER, DeLong DM, Clarke-Pearson DL. Comparing the areas under two or more correlated receiver operating characteristic curves: a nonparametric approach. Biometrics. 1988;44:837–845. doi: 10.2307/2531595. [DOI] [PubMed] [Google Scholar]
- Timm J, Post FA, Bekker LG, Walther GB, Wainwright HC, Manganelli R, Chan WT, Tsenova L, Gold B, Smith I. et al. Differential expression of iron-, carbon-, and oxygen-responsive mycobacterial genes in the lungs of chronically infected mice and tuberculosis patients. Proc Natl Acad Sci USA. 2003;100:14321–14326. doi: 10.1073/pnas.2436197100. [DOI] [PMC free article] [PubMed] [Google Scholar]
- Dubnau E, Chan J, Mohan VP, Smith I. responses of mycobacterium tuberculosis to growth in the mouse lung. Infect Immun. 2005;73:3754–3757. doi: 10.1128/IAI.73.6.3754-3757.2005. [DOI] [PMC free article] [PubMed] [Google Scholar]
- Kendall SL, Rison SC, Movahedzadeh F, Frita R, Stoker NG. What do microarrays really tell us about M. tuberculosis? Trends Microbiol. 2004;12:537–544. doi: 10.1016/j.tim.2004.10.005. [DOI] [PubMed] [Google Scholar]
- Jansen A, Yu J. Differential gene expression of pathogens inside infected hosts. Curr Opin Microbiol. 2006;9:138–142. doi: 10.1016/j.mib.2006.01.003. [DOI] [PubMed] [Google Scholar]
- Kondo E, Suzuki K, Kanai K, Yasuda T. Liposomes-mycobacteria incubation systems as a partial model of host-parasite interaction at cell membrane level. Jpn J Med Sci Biol. 1985;38:169–180. doi: 10.7883/yoken1952.38.169. [DOI] [PubMed] [Google Scholar]
- Brinster S, Lamberet G, Staels B, Trieu-Cuot P, Gruss A, Poyart C. Type II fatty acid synthesis is not a suitable antibiotic target for Gram-positive pathogens. Nature. 2009;458:83–86. doi: 10.1038/nature07772. [DOI] [PubMed] [Google Scholar]
- Morgunova E, Illarionov B, Sambaiah T, Haase I, Bacher A, Cushman M, Fischer M, Ladenstein R. Structural and thermodynamic insights into the binding mode of five novel inhibitors of lumazine synthase from Mycobacterium tuberculosis. FEBS J. 2006;273:4790–4804. doi: 10.1111/j.1742-4658.2006.05481.x. [DOI] [PubMed] [Google Scholar]
- Reche P, Perham RN. Structure and selectivity in post-translational modification: attaching the biotinyl-lysine and lipoyl-lysine swinging arms in multifunctional enzymes. EMBO J. 1999;18:2673–2682. doi: 10.1093/emboj/18.10.2673. [DOI] [PMC free article] [PubMed] [Google Scholar]
- De Clercq PJ. Biotin: a timeless challenge for total synthesis. Chem Rev. 1997;97:1755–1792. doi: 10.1021/cr950073e. [DOI] [PubMed] [Google Scholar]
- Awasthy D, Gaonkar S, Shandil RK, Yadav R, Bharath S, Marcel N, Subbulakshmi V, Sharma U. Inactivation of the ilvB1 gene in Mycobacterium tuberculosis leads to branched-chain amino acid auxotrophy and attenuation of virulence in mice. Microbiology. 2009;155:2978–2987. doi: 10.1099/mic.0.029884-0. [DOI] [PubMed] [Google Scholar]
- Rousseau C, Winter N, Pivert E, Bordat Y, Neyrolles O, Ave P, Huerre M, Gicquel B, Jackson M. Production of phthiocerol dimycocerosates protects Mycobacterium tuberculosis from the cidal activity of reactive nitrogen intermediates produced by macrophages and modulates the early immune response to infection. Cell Microbiol. 2004;6:277–287. doi: 10.1046/j.1462-5822.2004.00368.x. [DOI] [PubMed] [Google Scholar]
- Malm S, Tiffert Y, Micklinghoff J, Schultze S, Joost I, Weber I, Horst S, Ackermann B, Schmidt M, Wohlleben W. et al. The roles of the nitrate reductase NarGHJI, the nitrite reductase NirBD and the response regulator GlnR in nitrate assimilation of Mycobacterium tuberculosis. Microbiology. 2009;155:1332–1339. doi: 10.1099/mic.0.023275-0. [DOI] [PubMed] [Google Scholar]
- De Voss JJ, Rutter K, Schroeder BG, Su H, Zhu Y, Barry CE. The salicylate-derived mycobactin siderophores of Mycobacterium tuberculosis are essential for growth in macrophages. Proc Natl Acad Sci USA. 2000;97:1252–1257. doi: 10.1073/pnas.97.3.1252. [DOI] [PMC free article] [PubMed] [Google Scholar]
- Youmans GP, Youmans AS. Studies on the metabolism of Mycobacterium tuberculosis. I. The effect of carbohydrates and alcohols on the growth of Mycobacterium tuberculosis var. hominis. J Bacteriol. 1953;65:92–95. doi: 10.1128/jb.65.1.92-95.1953. [DOI] [PMC free article] [PubMed] [Google Scholar]
- Titgemeyer F, Amon J, Parche S, Mahfoud M, Bail J, Schlicht M, Rehm N, Hillmann D, Stephan J, Walter B. et al. A genomic view of sugar transport in Mycobacterium smegmatis and Mycobacterium tuberculosis. J Bacteriol. 2007;189:5903–5915. doi: 10.1128/JB.00257-07. [DOI] [PMC free article] [PubMed] [Google Scholar]
- Hu W, Sillaots S, Lemieux S, Davison J, Kauffman S, Breton A, Linteau A, Xin C, Bowman J, Becker J. et al. Essential gene identification and drug target prioritization in Aspergillus fumigatus. PLoS Pathog. 2007;3:e24. doi: 10.1371/journal.ppat.0030024. [DOI] [PMC free article] [PubMed] [Google Scholar]
- Harrison R, Papp B, Pal C, Oliver SG, Delneri D. Plasticity of genetic interactions in metabolic networks of yeast. Proc Natl Acad Sci USA. 2007;104:2307–2312. doi: 10.1073/pnas.0607153104. [DOI] [PMC free article] [PubMed] [Google Scholar]
- Deutscher D, Meilijson I, Kupiec M, Ruppin E. Multiple knockout analysis of genetic robustness in the yeast metabolic network. Nat Genet. 2006;38:993–998. doi: 10.1038/ng1856. [DOI] [PubMed] [Google Scholar]
- Le Meur N, Gentleman R. Modeling synthetic lethality. Genome Biol. 2008;9:R135. doi: 10.1186/gb-2008-9-9-r135. [DOI] [PMC free article] [PubMed] [Google Scholar]
- Suthers PF, Zomorrodi A, Maranas CD. Genome-scale gene/reaction essentiality and synthetic lethality analysis. Mol Syst Biol. 2009;5:301. doi: 10.1038/msb.2009.56. [DOI] [PMC free article] [PubMed] [Google Scholar]
- Sambandamurthy VK, Wang X, Chen B, Russell RG, Derrick S, Collins FM, Morris SL, Jacobs WR Jr. A pantothenate auxotroph of Mycobacterium tuberculosis is highly attenuated and protects mice against tuberculosis. Nat Med. 2002;8:1171–1174. doi: 10.1038/nm765. [DOI] [PubMed] [Google Scholar]
- MacMicking JD, Taylor GA, McKinney JD. Immune control of tuberculosis by IFN-gamma-inducible LRG-47. Science. 2003;302:654–659. doi: 10.1126/science.1088063. [DOI] [PubMed] [Google Scholar]
- Vandal OH, Nathan CF, Ehrt S. Acid resistance in Mycobacterium tuberculosis. J Bacteriol. 2009;191:4714–4721. doi: 10.1128/JB.00305-09. [DOI] [PMC free article] [PubMed] [Google Scholar]
- Reyrat JM, Berthet FX, Gicquel B. The urease locus of Mycobacterium tuberculosis and its utilization for the demonstration of allelic exchange in Mycobacterium bovis bacillus Calmette-Guerin. Proc Natl Acad Sci USA. 1995;92:8768–8772. doi: 10.1073/pnas.92.19.8768. [DOI] [PMC free article] [PubMed] [Google Scholar]
- Clemens DL, Lee BY, Horwitz MA. Purification, characterization, and genetic analysis of Mycobacterium tuberculosis urease, a potentially critical determinant of host-pathogen interaction. J Bacteriol. 1995;177:5644–5652. doi: 10.1128/jb.177.19.5644-5652.1995. [DOI] [PMC free article] [PubMed] [Google Scholar]
- Gordon AH, Hart PD, Young MR. Ammonia inhibits phagosome-lysosome fusion in macrophages. Nature. 1980;286:79–80. doi: 10.1038/286079a0. [DOI] [PubMed] [Google Scholar]
- Becker SA, Palsson BO. Genome-scale reconstruction of the metabolic network in Staphylococcus aureus N315: an initial draft to the two-dimensional annotation. BMC Microbiol. 2005;5:8. doi: 10.1186/1471-2180-5-8. [DOI] [PMC free article] [PubMed] [Google Scholar]
- Lehar J, Krueger AS, Avery W, Heilbut AM, Johansen LM, Price ER, Rickles RJ, Short GF, Staunton JE, Jin X. et al. Synergistic drug combinations tend to improve therapeutically relevant selectivity. Nat Biotechnol. 2009;27:659–666. doi: 10.1038/nbt.1549. [DOI] [PMC free article] [PubMed] [Google Scholar]
- Lehar J, Zimmermann GR, Krueger AS, Molnar RA, Ledell JT, Heilbut AM, Short GF, Giusti LC, Nolan GP, Magid OA. et al. Chemical combination effects predict connectivity in biological systems. Mol Syst Biol. 2007;3:80. doi: 10.1038/msb4100116. [DOI] [PMC free article] [PubMed] [Google Scholar]
- Shi L, Sohaskey CD, Kana BD, Dawes S, North RJ, Mizrahi V, Gennaro ML. Changes in energy metabolism of Mycobacterium tuberculosis in mouse lung and under in vitro conditions affecting aerobic respiration. Proc Natl Acad Sci USA. 2005;102:15629–15634. doi: 10.1073/pnas.0507850102. [DOI] [PMC free article] [PubMed] [Google Scholar]
- Wayne LG, Sohaskey CD. Nonreplicating persistence of mycobacterium tuberculosis. Annu Rev Microbiol. 2001;55:139–163. doi: 10.1146/annurev.micro.55.1.139. [DOI] [PubMed] [Google Scholar]
Associated Data
This section collects any data citations, data availability statements, or supplementary materials included in this article.
Supplementary Materials
Supplementary materials. It provides the detailed steps for constructing the iNJ661m and iNJ661v networks, and all supplemental tables and figure.
The iNJ661m metabolic network. It describes the iNJ661m metabolic network, using the Systems Biology Markup Language format.
The iNJ661m metabolic network. It describes the iNJ661m metabolic network, using Microsoft Excel 2003.
The iNJ661v metabolic network. It describes the iNJ661v metabolic network, using the Systems Biology Markup Language format.
The iNJ661v metabolic network. It describes the iNJ661v metabolic network, using Microsoft Excel 2003.