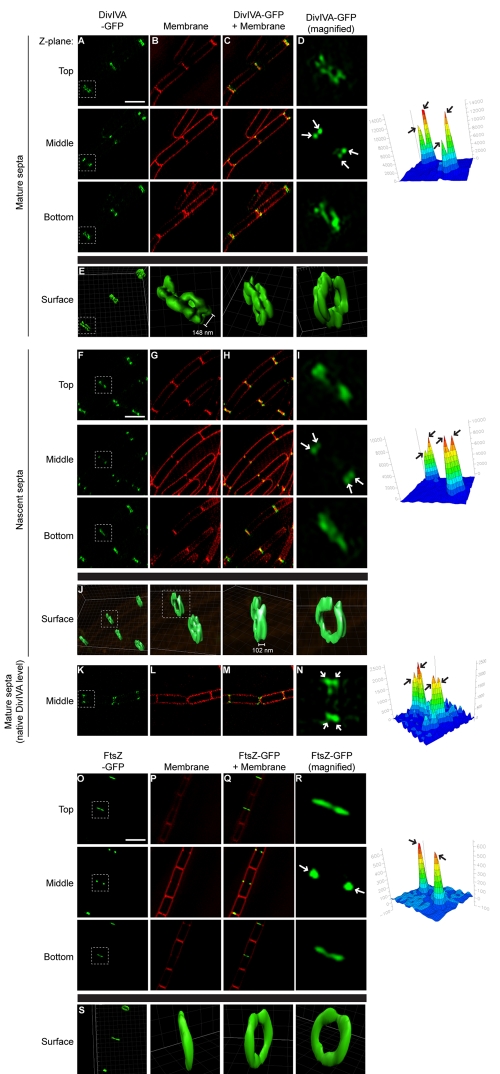
FIG 4 .
Adjacent A rings at division septa. DivIVA-GFP localization (strain KR541, produced under control of an IPTG-inducible promoter) at mature (A to E) or nascent (F to J) division septa, DivIVA-GFP localization (strain KR515, produced at native levels) at mature division septa (K to N), and FtsZ-GFP localization (strain AD3007) (O to S) viewed by 3D-SIM at three Z planes (indicated as “Top,” “Middle,” or “Bottom”). (B, G, L, and P) Membranes in panels A, F, K, and O, respectively, visualized using FM4-64. (C, H, M, and Q) Overlay of membrane stain and GFP fluorescence. (D, I, N, and R) Magnification of one septum (white box) in panels A, F, K, and O, respectively. (E, J, and S) GFP fluorescence for selected septa in panels A, F, and O, represented as a three-dimensional surface. Separation between A rings indicated is the average distance between regions of peak fluorescence (n = 24 for doublet A rings at mature septa, ±20 nm; n = 8 for doublet A rings at incomplete septa, ±14 nm). GFP fluorescence intensity for the selected septa in panels D, I, N, and R at the intermediate Z plane was quantified and is shown on the right to highlight the number of foci (arrows). Scale bars, 2 µm.

