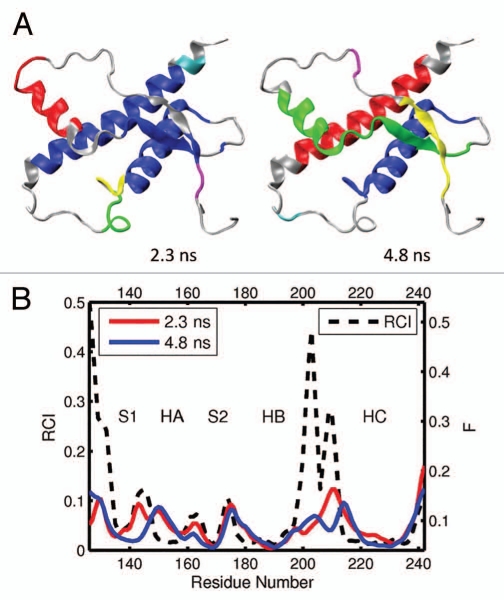
Figure 10.
(A) Dynamical domains for chicken prion protein (cPrP) identified from a MD trajectory at times indicated by the subscripts. The meaning of colors is as in Figure 3. (B) Flexibility profiles at times indicated in the legend box. The dashed curve shows the experimental RCI profile from 2(h). Further examples for chicken prion protein can be found in Figures S15 and S16.

