Abstract
Low temperature is one of the major abiotic stresses limiting the productivity and geographical distribution of many important crops. To identify proteins associated with chilling stress in Nicotiana tabacum cv. bright yellow-2 (BY-2) cell suspension culture, we utilized a proteomic approach with two-dimensional electrophoresis to compare proteins from samples of treated with or without chilling treatment at 4 °C. One protein specifically more abundant in chilling treated sample was identified and designated as NtLEA7-3. Rapid amplification of cDNA ends gave rise to a full-length NtLEA7-3 cDNA with a complete open reading frame of 1267 bp, encoding a 322 amino acid polypeptide. Homology search and sequence multi-alignment demonstrated that the deduced NtLEA7-3 protein sequence shared a high identity with LEA-like proteins from other plants. Subcellular localization analysis indicated that the NtLEA7-3 was localized exclusively in the nucleus. When the gene was overexpressed in bright yellow-2 cells, the transgenic bright yellow-2 cells show more resistant to chilling stress than the wild-type cells. In addition, transgenic Arabidopsis plants overexpressing the NtLEA7-3 are much more resistant to cold, drought, and salt stresses. Interestingly, the expression of NtLEA7-3 in tobacco was not tissue-specific and induced by chilling, drought and salt stresses. All of these, taken together, suggest that NtLEA7-3 is worthwhile to elucidate the contribution of the proteins to the tolerance mechanism to chilling stress, and can be considered as a potential target for crop genetic improvement in the future.
Low temperature is one of the critical environmental factors that limit the productivity and geographical distribution of many important crops (1, 2). Plants have evolved mechanisms, one of which is the regulation of gene expression, to tolerate these conditions through various physiological adaptations (3, 4). Cold-responsive proteins are likely to be involved in cold tolerance and hundreds of which have been identified using various methods, of which proteomic analysis may provide new dimensions to assess the changes in protein types and expression levels and has been applied to investigate stress-related proteins in plants (5–10). However, up to now, the main plant proteome studies focused on the organellar and whole plant and tissue level. The cell suspension culture Nicotiana tabacum cv. Bright Yellow-2 (BY-2)1 is a widely utilized model system for elucidation of intracellular events and key mechanisms in the regulation of the cell cycle and cell growth in plants (11). Although the proteome of tobacco BY-2 has been partially analyzed in earlier studies, to our knowledge, little proteomic information about the cellular tobacco BY-2 protein expression in response to chilling stress has been reported.
There are hundreds of cold-responsive genes documented, among which late embryogenesis-abundant (LEA) genes are an important gene family. LEA proteins were first identified and characterized in cotton (12), and are highly synthesized during in the later stages of embryogenesis in higher plants. There are many LEA proteins and their genes or cDNAs have been described in different plant species (13–18), and most of the proteins share common features such as high hydrophilicity, biased amino acid composition, and the predicted random coil structures (19). In addition to being accumulated in the embryo, some LEA proteins can also be induced in vegetative tissues by some environmental stress (20). The expression pattern of LEA proteins and structural characteristics suggest that they function in the protection of plant cells during dehydration or other stresses (21). Although extensive studies have been carried out documenting the responses of various types of LEA proteins to different abiotic conditions, the true biochemical functions of these proteins are not fully understood (22). Therefore, identification of novel LEA proteins, determination of their expression patterns and functions in stress responses will be of great benefit to the understanding for the molecular mechanisms of plant response to low temperature.
In order to study the molecular basis of the plant responses to chilling stress, we analyzed the changes in total proteins in Bright Yellow-2 cell suspension culture after chilling treatment. Interestingly, a LEA-like protein, designed as NtLEA7-3, was up-regulated in the chilling stressed samples. The overexpression of NtLEA7-3 in transgenic tobacco cells displays an increased tolerance toward chilling stress. Our findings provide insights into the molecular mechanisms of plant response to low temperature and the function of the NtLEA7-3.
EXPERIMENTAL PROCEDURES
Culture Conditions and Stress Treatment
The BY-2 cell culture was maintained as described by Laukens et al. (11). Exponential culture for stress treatment was obtained by transfer of 10 ml of 7-day-old stationary culture to 100 ml of medium, followed by 24 h of subculture in the dark (with shaking at 120 rpm, 26 °C). When the cell culture growth reached the logarithmic phase, chilling stress treatment was performed by moving the cell culture into an identical chamber kept at 4 °C for 12 h. The cell culture maintained at 26 °C served as controls. After chilling treatment, the culture samples were washed three times with ultra-pure water and collected on a Whatman filter paper (No. 1) (GE Healthcare), and then frozen in liquid nitrogen immediately. Samples were stored at −80 °C before use.
Protein Extraction and Two-dimensional Electrophoresis
Frozen BY-2 cells were ground to flour in a liquid nitrogen cooled mortar, and cell proteins were extracted as described by Ji et al. (23). Protein was purified using the two-dimensional clean-up kit, and then dispensed in rehydration buffer (8 m urea, 2% 3-[(3-cholamidopropyl)dimethylammonio]propanesulfonate, 15 mm dithiothreitol and 0.5% (v/v) IPG buffer pH 4–7,). The protein concentration was determined using the two-dimensional Quant kit. Samples were stored at −80 °C until electrophoresis.
Protein samples (1000 μg in 450 μl of IEF rehydration buffer) were used to rehydrate 24 cm IPG dry strips pH 4-7 and then focused using an Ettan™ IPGphor™ II IEF System (GE Healthcare). The electrophoresis was run at 20 °C with a gradually increasing voltage: 30 V for 12 h, 200 V for 1 h, 500 V for 1 h, 500–8000 V for 30 min, and finally 8000 V for 32,000 V·h. After the first-dimensional run, the IPG gel strips were equilibrated in equilibration buffer (6 m urea, 2% (w/v) SDS, 20% (v/v) glycerol and 50 mm Tris-HCl, pH 8.8) containing 2% (w/v) dithiothreitol, for 15 min followed by equilibration buffer containing 2.5% iodoacetamide for a further 15 min. The strips were then transferred onto vertical slab SDS-polyacrylamide gels (10% T, 2.6% C). The second dimension was performed using an Ettan DALTIIunit as described previously (24). We performed three biological replicate experiments for chilling stress and control treatments, respectively, and at least three technical replicates per biological experiment.
Image Analysis and Protein Identification
Two-dimensional electrophoresis (2-DE) gels were visualized by Coomassie staining and scanned by labscanTM (GE Healthcare). The stained 2-DE gels were analyzed using the ImageMasterTM two-dimensional platinum software version 5.0 (GE Healthcare). Protein spots were detected automatically, and manual spot editing was then performed to correct the mismatched and unmatched spots when necessary. Individual spot volumes were normalized against total spot volumes. Means and standard deviations were calculated and statistical significance assessed between chilling stress and control samples from three independent replicates. Statistical significance was inferred at p ≤ 0.05. A protein spot was designated as the significant differentially expressed spot if the % Vol varied more than twofold between chilling stress and control treatments and displaying reproducible change patterns.
Protein spots showing significant changes were excised, destained, and subjected to in-gel tryptic digestion, and identified with an Ultraflex matrix-assisted laser desorption ionization/time of flight (MALDI-TOF/TOF) tandem mass spectrometer (Bruker Daltonics, Germany) as described previously (23). All MALDI-TOF/TOF mass spectra were collected with an Ultraflex MALDI-TOF/TOF tandem mass spectrometer and analyzed by the peak list-generating FlexControlTM 2.2 software (Bruker Daltonics, Germany). MS/MS data were processed and database searching were set to the NCBI “EST others” database (18 Oct. 2006) (140695050 sequences; 26889187900 residues) using the Mascot search engine version 2.0 (http://www.matrixscience.com). The searching was performed taking viridiplantae (Green Plants) as taxonomy (56514774 sequences). The parameters for searching were enzyme of trypsin, 1 missed cleavage, fixed modifications of carbamidomethyl (C), variable modifications of oxidation (M), peptide mass tolerance: ± 0.5 Da, fragment mass tolerance: ± 0.5 Da, peptide charge of 1+ and monoisotopic. Only significant hits, as defined by the MASCOT probability analysis (p < 0.05), were accepted.
RNA Isolation and cDNA Synthesis
Frozen BY-2 cells were ground to flour in a liquid-nitrogen cooled mortar and RNA was extracted using the TRIzol® reagent as per manufacturer's recommendations (Invitrogen). The cDNA was synthesized using oligo (dT)18 primer (GACTCTAGACGACATCGA(T)15) and ReverTra Ace M-MLV RTase (TaKaRa, Dalian, China) according to the manufacture recommendation.
Quantitative Real-time RT-PCR
Quantitative real-time RT-PCR (qRT-PCR) was performed using gene-specific primers (GCTAACTCTTCCACTTGAGAA and TCTCCAACTTCAATCCTCATC) on CFX96TM Real-time System (Bio-Rad) using SYBR®PrimeScriptTM RT-PCR Kit (TaKaRa, China) under the following thermal cycling profile: 95 °C for 30 s, followed by 40 cycles of amplification (95 °C for 10 s, 55 °C for 20 s, and 72 °C for 15 s) and the melt cycle from 65 to 95 °C. All samples were prepared with at least two individuals and assayed in triplicate. The primers (CTGCTGCAACAAGATGGATGC and ACCATACCAGGCTTGAGGAC) were used to amplificated the reference gene EF1-α (Accession No. DQ785808). The relative gene expression was evaluated using comparative cycle threshold (Ct) method (25).
Obtaining the Full Length NtLEA7-3 Sequence
RACE-PCR was used to amplify the 3′-and 5′-end NtLEA7-3 cDNAs. For the 3′-RACE, specific primers (GCTAACTCTTCCACTTGAGAA and GACTCTAGACGACATCGA(T)18) were designed. For 5′-RACE, the first strand cDNA synthesized was further tailed poly (C) at the 3′-end with terminal deoxynucleotidyl transferase according to the manufacturer instructions, and the poly (C)-tailed cDNA was used as template and nested PCR was performed. The specific primers (GGCCACGCGTCGACTAGTAC(G)16 and CTCAAGATCAATATCTGGCTTGT) and (GGCCACGCGTCGACTAGTAC and TTCTCAAGTGGAAGAGTTAGC) were designed for the first and second round PCR, respectively. Based on the obtained sequence information, the specific primers (GAA TTCATGTCGTCTTCGGAAAAT and GTCGACATCCTCATCTTCATCATC) were designed to amplify the full-length cDNA of NtLEA7-3. Homology analysis was performed with BLASTP programs on NCBI (http://www.ncbi.nlm.nih.gov/BLAST). Multiple alignments of amino acid sequences of the Arabidopsis LEA gene family and NtLEA7-3 were constructed using ClustalX (26) and refined manually. Phylogenetic trees were constructed using the Neighbor-Joining (NJ) method (27) provided by the MEGA4.0 software under the Poisson correction amino acid substitution model. Bootstrapping was performed 1000 times to obtain support values for each branch.
Production of Transgenic Plant Lines and Determination of NtLEA7-3 Subcellular Localization
The NtLEA7-3 and green fluorescent protein (GFP) genes were cloned into the binary plasmid vector pBI121 under the control of the cauliflower mosaic virus (CaMV) 35S promoter to produce 35S::NtLEA7-3, 35S::NtLEA7-3-GFP (C-terminal fusion), and 35S::GFP, respectively. The pBI121 binary vector containing 35S::NtLEA7-3 or 35S::GFP or 35S::NtLEA7-3-GFP was introduced into Agrobacteriun tumefaciens strain GV3101 and the WT Arabidopsis plants were transformed by floral dipping. Transformation of BY-2 line was performed by the protocol introduced by (28). After transformation, the cells and sterilized T1 seeds were plated on kanamycin selection plates (MS media supplemented with 50 μg/ml kanamycin) to select transformed cells and plants. The expression of NtLEA7-3 was confirmed by RT-PCR. The level of GFP fluorescence was examined by a Bio-Rad MRC1024 confocal laser scanning.
RNA Gel Blotting
Total RNA was isolated from the sampled materials according to the same procedure described as above. Ten micrograms of RNA were fractionated in 1.2% formaldehyde denatured agarose gel, followed by blotting onto nylon Hybond N membrane. Prehybridization, hybridization, membrane washing, and detection followed the same procedure according to Liu et al. (29).
Chilling Tolerance of the Transgenic BY-2 Cells
Equivalent wild-type and 35S::NtLEA7-3 cells were sown on solid MS medium and grown at 26 °C for 1 week. Chilling stress treatment was performed by moving the cell culture into an identical chamber kept at 4 °C for 2 d. The cell culture maintained 26 °C served as controls. After chilling treatment, the cell culture was placed into a growth chamber at 26 °C for 1 week, and then was photographed.
Chilling tolerance of the transgenic BY-2 cells was characterized by measurements of the cell viability, cell death ratio, and packed cell volume (PCV). The cell viability was investigated by the 2, 3, 5-triphenyltetrazolium chloride (TTC) reduction method (30). Cell death was assayed by incubating the cell suspensions for 15 min with 0.05% (m/v) Evan's blue (Sigma). Unbound dye was removed by extensive washing, and dye bound to dead cells was solubilized in 50% (v/v) methanol with 1% (m/v) SDS for 30 min at 50 °C and quantified by absorbance at 600 nm. The data are expressed as a percentage of total killings calibrated by Evan's blue staining of equivalent cells treated with ethanol (31). For the cell growth assay, the PCV was determined (32). Five milliliters of treated culture samples were transferred to a centrifuge tube and centrifuged at 2700 × g for 10 min. PCV was calculated by measuring the volume of the supernatant. Means and standard deviations were calculated and statistical significance assessed between chilling stress and control samples from three independent replicates. Statistical significance was inferred at p ≤ 0.05.
Freezing, Drought, and Salt Stress Tolerance of the Transgenic Arabidopsis Plants
Arabidopsis plants were grown on a 1:1 mixture of perlite and vermiculite under short photoperiod (SD) (8 h light/16 h dark) or long photoperiod (LD) (16 h light/8 h dark) conditions at 22 °C. Six-week-old WT and transgenic plants grown under SD were exposed to freezing, salt, and drought stresses. Freezing stress was conducted by exposing the plants at 4 °C for 1 d and then subjected to a series of temperatures from 0 °C through −2 °C, −4 °C, −6 °C, and −8 °C to a final temperature of −10 °C. The plants were treated for 2 h at each temperature in the dark. After freezing shock, the plants were immediately placed at 4 °C for 1 d under LD condition and then into a growth chamber under normal conditions for 5 days. Drought stress was conducted by withholding water for 2 weeks. Salt stress was created by soaking plants in the nutrient solution supplemented with NaCl, incrementally increasing with each successive watering from 50 through 100, and 150 to a final concentration of 200 mm NaCl. The plants were treated for 4 d at each concentration, for a total of 16 d. After stress treatment, the numbers of plants that survived and continued to grow were counted, and the representative plants were chosen and photographed.
Expression Profile Analysis of NtLEA7-3
Tobacco BY-2 seeds surface sterilized were sown on nutrient solution (half-strength MS medium) in the chamber with a 14 h light/10 h dark cycle at 26 °C. The 3-week-old seedlings were prepared by growing plants in plastic trays filled with a 1:1 mixture of perlite and vermiculite in a growth room at 26 °C in 16:8 h (light:dark) photoperiod. One week later, the rooted plantlets were selected for the test. Roots, leaf discs, stem, flower petal, and seeds harvested at different developmental stages from the plants were used to investigate the expression of NtLEA7-3 in different tissues. Abiotic stress treatments were conducted as follows. For drought treatment, 2-week-old seedlings were subjected to dehydration by withholding water for 10 days, and control plants were grown in nutrient solution. For salinity treatment, seedlings were transferred to the nutrient solution supplemented with 100 mm NaCl for 24 h. Control plants continued to grow on regular nutrient solution with no NaCl. For low-temperature stress, seedlings were transferred to an incubator under 4 °C for 24 h. Control plants grow in a growth room at 26 °C. Quantitative real time RT-PCR was used as described above to examine the expression profile of the NtLEA7-3 transcripts in different tissues and treatments. Means and standard deviations were calculated and statistical significance assessed between different tissue and stressed samples from three independent replicates. Statistical significance was inferred at p ≤ 0.05.
RESULTS
Proteome Maps of Chilling Treated BY-2 Suspension Cells
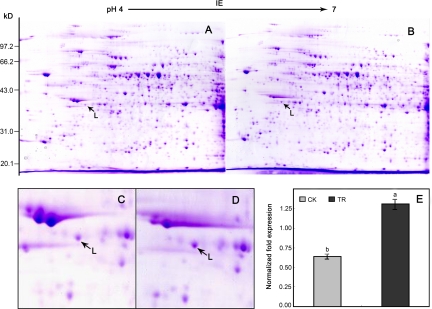
To investigate the effects of chilling stress on the protein profile, we carried out 2-DE to display and compare all extractable proteins from chilling treated and untreated BY-2 suspension cells. The 2-DE protein maps of untreated and chilling treated suspension cells are shown (Fig. 1A and 1B). The protein pattern was quite reproducible among technical replicates of the same sample and replicates from independent extractions. By comparison of chilling treated and controlled gels, one protein (spot L) showed significantly more abundant in chilling treated BY-2 suspension cells. The difference of the spot in normalized volume was greater than 2-fold between controlled and treated samples (Fig. 1C and 1D). The observed Mr and pI values of protein spot L was 35 kDa and 5.0, respectively.
Fig. 1.
Identification of proteins associated with chilling stress. Proteins were extracted from control treatment (A) and chilling stressed (B) BY-2 cell culture samples and separated using 2-DE. Representative gel images from control treatment cell culture (C) and chilling stressed cell culture (D) are shown. The protein spot L was up-regulated by chilling treatment. mRNA level of NtLEA7-3 gene was analyzed by qRT-PCR (E). The relative gene expression was evaluated using comparative Ct method taking EF1-α as the reference gene. The log2 values of the ratio of the gene expression of NtLEA7-3 to EF1-α in chilling stressed sample (TR) and the control treatment samples (CK) are plotted. Data are the average of four experiments for three test samles and analyzed using Student's t test (p ≤ 0.05). Error bars represent S.D. The lowercase letters indicate values, with “a” being the higher, and “b” being the lower value.
Identification of Protein Using MS/MS
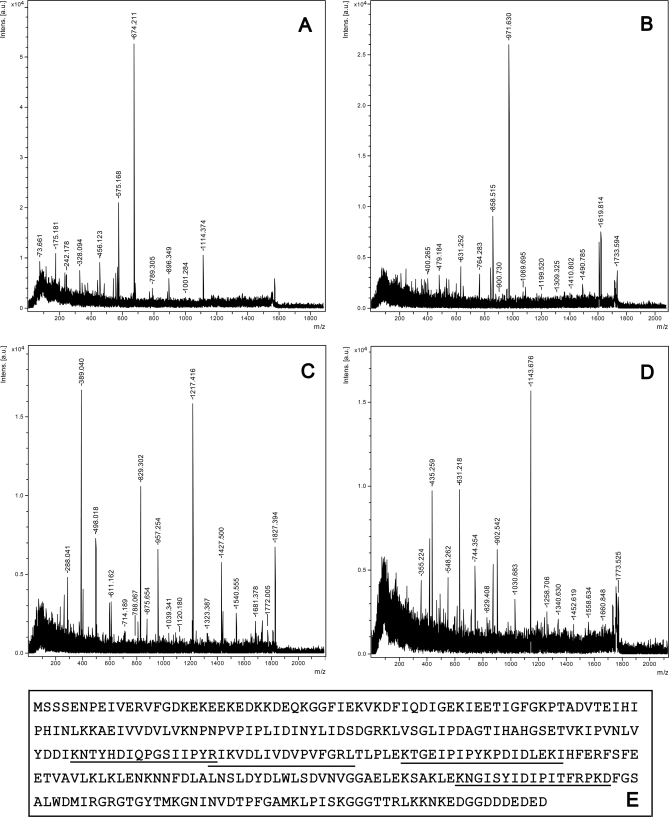
To identify the protein L up-regulated by chilling treatment, it was analyzed by MALDI-TOF-TOF and four peptide sequences were obtained (Fig. 2). Using the tblastn program (http://www.ncbi.nlm.nih.gov/BLAST/), all the peptides identified matched to a translated 794 bp UniGene sequence (gi 83420604), which did not contain an initiation codon. The four identified peptides matched to the full length cDNA clone isolated (Fig. 2E) giving total sequence coverage of 21.2%, and the gene isolated was designated NtLEA7-3. To investigate the gene expression at mRNA level under chilling treatment, qRT-PCR analysis was performed using the RNA extracted from the chilling treated and untreated BY-2 suspension cells (Fig. 1E). Expectedly, the gene expression at mRNA level was also significantly higher and could account for the increased abundance of the NtLEA7-3 protein in chilling treated suspension cells.
Fig. 2.
MS/MS analysis of the protein spot L and the amino acid sequence derived from the full length cDNA clone. The protein identified was excised from the gel and digested with trypsin then subjected to MS/MS analysis. Searching was performed using the http://www.matrixscience.com program. The search was performed taking green plants as the taxonomy. A, The spectra for the de novo sequences R.IKVDLIVDVPVFGR.L; B, The spectra for the de novo sequences K.NGISYIDIPITFRPK.D; C, The spectra for the de novo sequences K.TGEIPIPYKPDIDLEK.I; D, The spectra for the de novo sequences K.NTYHDIQPGSIIPYR.I. E, The entire coding region of the identified LEA protein was obtained using RACE. The derived amino acid sequence is shown with the peptides identified by MS/MS underlined.
Characterization of the Novel Chilling Induced NtLEA7-3 Protein
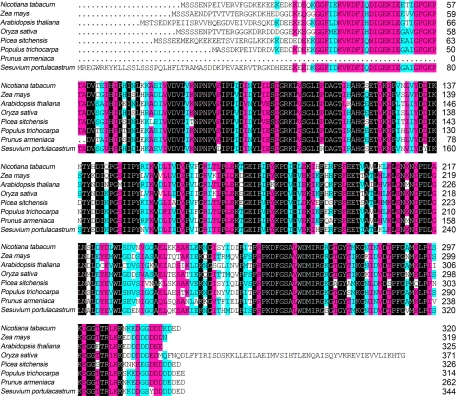
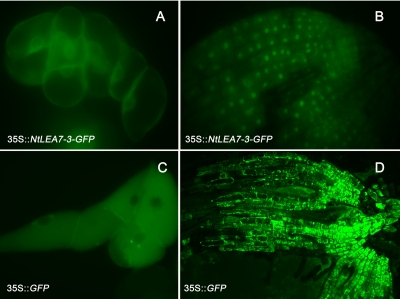
Using 3′RACE and 5′RACE, a full length cDNA clone of 1267 bp was obtained, which encoded a protein 322 aa residues in length with a predicted size of 35.7 kDa and pI of 4.867 (Fig. 2E, GenBank accession EF532409). The sequence comparisons as well as the multiple alignment analysis were carried out via blast search in GenBank database (http://www.ncbi.nlm.nih.gov/BLAST). The results revealed that the sequence was high homology to many LEA proteins in other plant species (Fig. 3). Moreover, the structure prediction (http://npsa-pbil.ibcp.fr/cgi-bin/npsa-automat.pl?page = /NPSA/npsa_preda.html) of NtLEA7-3 indicated that it contained little secondary structure (α-Helix or β-sheet), with as much as 65% of the protein behaving as random coil. Analysis of the hydropathy profile of the sequence showed that the N-terminal and C-terminal portion of NtLEA7-3 contained highly hydrophilic tail and the whole protein showed high hydrophilicity (http://www.ch.embnet.org/software/TMPRED_form.html). N-terminal extension prediction suggested that NtLEA7-3 contained no obvious signal peptide (http://www.cbs.dtu.dk/services/SignalP/). Analysis of the amino acid sequences of NtLEA7-3 revealed that it contained no obvious nuclear localization sequence (http://www.cbs.dtu.dk/services/targetP) and was not a transmembrane protein (http://www.cbs.dtu.dk/services/TMHMM/). To clarify its subcellular localization, the coding region of the NtLEA7-3 gene was fused inframe to the GFP gene, and the resulting construct was introduced into Arabidopsis plants and BY-2 suspension cells. As shown in Fig. 4A and 4B, the fluorescence of NtLEA7-3-GFP was localized exclusively in the nucleus, whereas the fluorescence of GFP alone was observed in the whole cell (Fig. 4C and 4D), indicating that NtLEA7-3 is a nuclear-localized protein.
Fig. 3.
Alignment of deduced amino acid sequence of NtLEA7-3 with representative reported LEA proteins using the DNAMAN program. Identical amino acids were black shaded and similar amino acids were gray shaded. The aligned sequences included those from Zea mays (ACG28322), Arabidopsis thaliana (NP_181934), Oryza sativa (EAY92540), Picea sitchensis (ABK25013), Populus trichocarpa (ABK95225), Prunus armeniaca (AAC24588), and Sesuvium portulacastrum (AAV71142).
Fig. 4.
Analysis of the subcellular localization of NtLEA7-3. Chimeric construct 35S::NtLEA7-3-GFP was expressed in BY-2 cells (A) and Arabidopsis thaliana root tip cells (B); Chimeric construct 35S::GFP was expressed in BY-2 cells (C) and Arabidopsis thaliana root tip cells (D).
Overexpression of NtLEA7-3 Improved Chilling Tolerance of BY-2 Cells
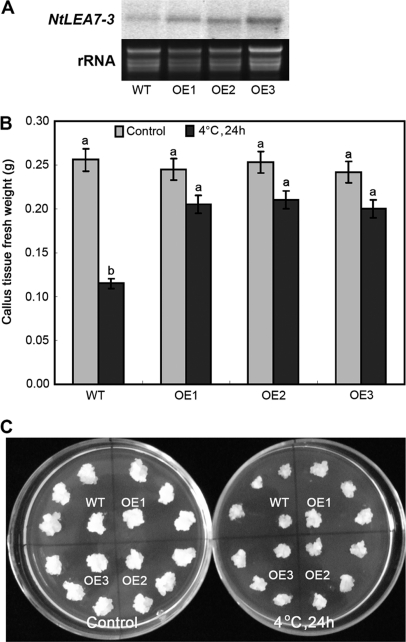
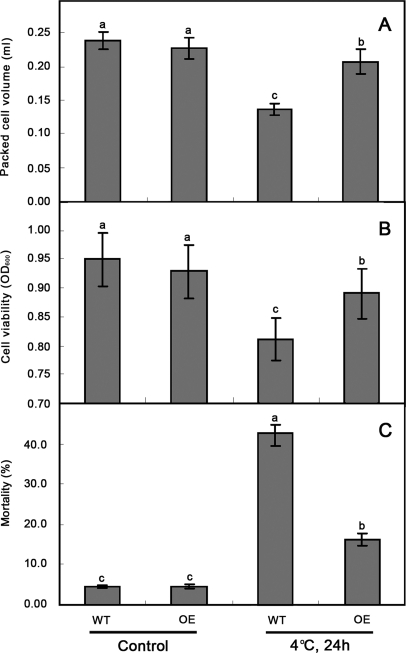
The RNA extracted from the transgenic lines and wild type BY-2 cells was analyzed by northern blotting and the results showed that the NtLEA7-3 transcript levels increased in transgenic BY-2 lines (Fig. 5A). In callus tissue held, no significant difference was observed in cell growth between the transgenic BY-2 lines and wild type cells when grown on solid MS medium at 26 °C. After treatment at 4 °C for 2 d and recovery at 26 °C for 1 week, the growth of wild type callus tissue was reduced compared with that of the transgenic ones (Fig. 5B and 5C). To determine whether transgenic line cells have elevated chilling tolerance, the cell growth characterized by PCV, and cell viability characterized by TTC reduction and mortality of suspension-cultured cells were measured (Fig. 6). The results showed that the growth and viability of wild type and transgenic line cells were reduced under chilling stress. From the results of measurement of PCV of chilling-treatment cells, the growth of transgenic line cells was much better than that of wild type ones (Fig. 6A). TTC-reduction test of chilling-treatment cells showed that the cell activity of transgenic cell lines was higher than that of wild type ones (Fig. 6B), and the mortality of transgenic cell lines was lower than that of wild type ones under chilling stress (Fig. 6C). These results might indicate that the overexpression of NtLEA7-3 is capable of increasing chilling tolerance in BY-2 suspension-cultured cells.
Fig. 5.
Northern blot analysis and chilling tolerance analysis of overexpression (OE) line and wild type (WT) cells. A, Northern blot analysis of NtLEA7-3 mRNA from independent transformants expressing the NtLEA7-3 gene. Lanes 1, wild type cells; Lanes 2–4, overexpression cell lines; B, Callus tissue fresh weight of wild type and overexpression cell lines under control (26 °C) and 24 h chilled (4 °C); C, Growth of wild type and overexpression cell lines under control (26 °C) and 24 h chilled (4 °C). Data are the average of four experiments for three test callus tissues and analyzed using Student's t test (p ≤ 0.05). Error bars represent S.D. The lowercase letters indicate values, with “a ” being the higher, and “b ” the lower value. The same letters within a column mean that no significant differences exist between the numbers.
Fig. 6.
Chilling tolerance of suspension-cultured cells estimated by the packed cell volume (PCV) (A), TTC reduction (B) and mortality (C). Two grams of cells (fresh weight) at late log phase was transferred to fresh medium and grown at 26 °C for 24 h before chilling exposure. Aliquots of 1 ml cell culture each containing about 30 mg cells (fresh weight) were sampled to determine chilling tolerance. WT: Wild type cells; OE1–3: Different transgenic cell lines. Each data are the means of four replicates and error bar represents the mean and standard deviation of four experiments. Data are the average of four experiments for three test samples and analyzed using Student's t test (p ≤ 0.05). Error bars represent S.D. The lowercase letters indicate values, with “a ” being the highest, and “c ” the lowest value. The same letters within a column mean that no significant differences exist between the numbers.
DISCUSSION
In an effort to identify the novel components involved in chilling tolerance in BY-2 suspension-cultured cells, we have identified one novel chilling-inducible gene for functional analysis. In this study, we report the characterization of a chilling-inducible gene, NtLEA7-3. The features of NtLEA7-3 are its high hydrophilicity and high content of Gly and small amino acids like Ala and Ser, and the structural elements exist principally as randomly coiled proteins, and are localized in nuclear region, suggesting that NtLEA7-3 might be a novel LEA protein. Though sequence alignment of the peptides with known protein sequences in the GenBank revealed homology with many other plant LEA proteins (Fig. 3), NtLEA7-3 lack significant signature motifs of any group according to the traditional criterion described by Dure et al. (12). Bies-Ethève looked for the presence of conserved repeated motifs in the sequences of the 50 LEA protein genes from Arabidopsis thaliana genome, and classified into nine groups (35). Among the classified groups, the group seven genes contain the same three domains in the same order, motif 1 (LDK-K-F-A-KL—IP-PE), motif 2 (V-V-NP——IP——–-S—R——G-IPD-G-L) and motif 3 (d-PVV—TIP——GEIKLP—D). Though sequence analysis showed that NtLEA7-3 only contains the first domain of group 7 genes, BLAST or FASTA algorithms showed that the best alignment of NtLEA7-3 was homolog to group 7 gene AT2G44060 (supplemental Fig. S1). Thus, the NtLEA7-3 should belong to a novel family of the atypical LEA like protein, and the function of it might diverge from those in Arabidopsis thaliana.
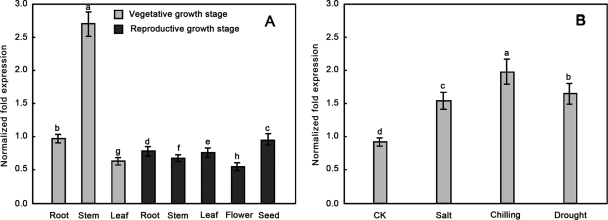
Because the NtLEA7-3 gene have not been reported, it was interesting to investigate its expression pattern. Using elongation factor EF1a gene as an internal standard, expression levels of the NtLEA7-3 gene in roots, stems, leaves, flowers, and seeds were investigated by qRT-PCR. Different with the initially characterized by LEA proteins expression in seeds, our experiments show that the NtLEA7-3 gene is strongest expressed in stems at the vegetative growth stage. Although its expression is also detected in seeds and all vegetative tissues and has no tissue-specific expression pattern at the reproductive growth stage. The expression levels show similar beside the lower expression in flowers (Fig. 7A). This might indicate that the function of it might diverge from those initially characterized LEA proteins. It was reported that many LEA genes are up-regulated expressed in vegetative tissues of several plant species under abiotic stress (35–37). qRT-PCR analysis was performed to investigate the expression of NtLEA7-3 in the seedling leaves of tobacco treated by cold, drought, and salt stresses (Fig. 7B). The results show that the transcript level of NtLEA7-3 was strongly induced by cold, drought, and salt stresses. These results indicated that the NtLEA7-3 gene was involved in the induction by environmental stresses.
Fig. 7.
Expression profile analysis of NtLEA7-3. The relative gene expression was evaluated using comparative Ct method taking EF1-α (Accession No. DQ785808) as the reference gene. A, The log2 values of the ratio of the gene expression of NtLEA7-3 to EF1-α in the leaf, stem, root, flower, and seed samples are plotted. B, The log2 values of the ratio of the gene expression of NtLEA7-3 to EF1-α in salt, chilling, drought stressed and control samples are plotted. Data are the average of four experiments for three test samles and analyzed using Student's t test (p ≤ 0.05). Error bars represent S.D. The lowercase letters indicate values, with “a” being the highest, “h” and “d” being the lowest value in Fig. 7A and 7B, respectively. The same letters within a column mean that no significant differences exist between the numbers.
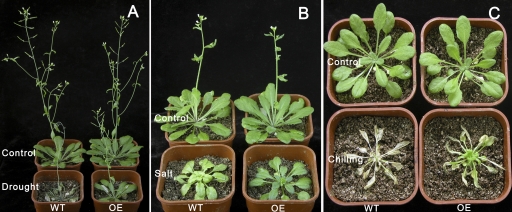
Both the pattern of expression and the structural features of NtLEA7-3 proteins might suggest a general protective role for plant under abiotic stress. Our results indicate that the overexpression of NtLEA7-3 is capable of increasing chilling tolerance in BY-2 suspension-cultured cells. To gain further insight into its function, we analyzed the tolerance of transgenic Arabidopsis thaliana overexpression of the NtLEA7-3 gene to some abiotic stress. Results showed that expression of the NtLEA7-3 cDNA under control of the 35S CaMV promoter in transgenic Arabidopsis thaliana gave enhanced tolerance to cold, drought and salt stress (Fig. 8). When the wild-type and transgenic plants were grown in pots with water withheld for 2 weeks nearly all the wild-type plants died within this period, whereas most of the transgenic plants survived this level of drought stress and continued to grow when watering resumed (Fig. 8A). Transgenic plants maintained higher growth rates than wild plants under salt-stress conditions. Appearance and development of the major damage symptoms caused by the salt stress conditions were delayed in transgenic plants (Fig. 8B). When plants grown in pots were exposed to chilling stress as described above, then returned to 22 °C and grown for 5 days, less than 10% of the wild-type plants survived, whereas 95% of the transgenic plants survived (Fig. 8C). When the stress conditions were removed, the transgenic plants showed better recovery than did the control plants. Therefore, the transgenic plants showed much better performance than wild plants under stress conditions. These results might indicate that the function of NtLEA7-3 gene positively influences resistance against abiotic stress. Such a protective role also suggests the potential usefulness of NtLEA7-3 gene as molecular tools for genetic engineering of stress tolerance.
Fig. 8.
Drought, salt, and freezing stress tolerance of wild type and NtLEA7-3-overexpressing transgenic Arabidopsis plants. The stress treatments were performed as follows: Control: 6-week-old plants growing under normal conditions; Drought stress (A): water withheld for 2 weeks; Salt stress (B): plants soaked in the nutrient solution was supplemented with NaCl with increasing concentration from 50 through 100, and 150 to a final 200 mm for 4 d at each concentration. Freezing stress (C): plants exposed to 4 °C for 1 d and then subjected to a series of temperature from 0 °C through −2 °C, −4 °C, −6 °C and −8 °C to a final temperature of −10 °C for 2 h at each temperature and returned to 22 °C for 5 days; WT: Wild type plants; OE: Transgenic plants.
In conclusion, Our study provides not only new insights into chilling stress responses but also a good starting point for further dissection of the functions of the response protein, a novel late embryogenesis abundant like protein NtLEA7-3. Further studies targeted at the molecular mechanisms underlying NtLEA7-3 activity in the abiotic stress.
Footnotes
* This work was funded by the National Natural Science Foundation (Grant No. 31070573), Science Foundation for the Excellent Youth Scholars of Shandong Province (Grant No. BS2010NY015) and the Genetically Modified Organisms Breeding Major Projects (Grant No. 2011ZX08009-003-002) in China.
 This article contains supplemental Fig. S1.
1 The abbreviations used are:
- BY-2
- Nicotiana tabacum cv. bright yellow-2
- LEA
- Late embryogenesis-abundant
- qRT-PCR
- Quantitative real-time RT-PCR
- GFP
- Green fluorescent protein
- PCV
- Packed cell volume
- TTC
- 2, 3, 5-triphenyltetrazolium chloride.
REFERENCES
- 1. Foolad M. R., Subbiah P., Kramer C., Hargrave G., Lin G. Y. (2003) Genetic relationships among cold, salt and drought tolerance during seed germination in an interspecific cross of tomato. Euphytica. 130, 199–206 [Google Scholar]
- 2. Shan D. P., Huang J. G., Yang Y. T., Guo Y. H., Wu C. A., Yang G. D., Gao Z., Zheng C. C. (2007) Cotton GhDREB1 increases plant tolerance to low temperature and is negatively regulated by gibberellic acid. New Phytol. 176, 70–81 [DOI] [PubMed] [Google Scholar]
- 3. Sharma P., Sharma N., Deswal R. (2005) The molecular biology of the low-temperature response in plants. Bioessays 27, 1048–1059 [DOI] [PubMed] [Google Scholar]
- 4. Mazzucotelli E., Mastrangelo A. M., Crosatti C., Guerra D., Stanca A. M., Cattivelli L. (2008) Abiotic stress response in plants: When post-transcriptional and post-translational regulations control transcription. Plant Sci. 174, 420–431 [Google Scholar]
- 5. Lee B. H., Henderson D. A., Zhu J. K. (2005) The Arabidopsis cold-responsive transcriptome and its regulation by ICE1. Plant Cell 17, 3155–3175 [DOI] [PMC free article] [PubMed] [Google Scholar]
- 6. Imin N., Kerim T., Weinman J. J., Rolfe B. G. (2006) Low temperature treatment at the young microspore stage induces protein changes in rice anthers. Mol. Cell. Proteomics 5, 274–292 [DOI] [PubMed] [Google Scholar]
- 7. Wan X. Y., Liu J. Y. (2008) Comparative proteomics analysis reveals an intimate protein network provoked by hydrogen peroxide stress in rice seedling leaves. Mol. Cell. Proteomics 7, 1469–1488 [DOI] [PMC free article] [PubMed] [Google Scholar]
- 8. Timperio A. M., Egidi M. G., Zolla L. (2008) Proteomics applied on plant abiotic stresses: role of heat shock proteins (HSP). J. Proteomics 71, 391–411 [DOI] [PubMed] [Google Scholar]
- 9. Qureshi M. I., Qadir S., Zolla L. (2007) Proteomics-based dissection of stress-responsive pathways in plants. J. Plant Physiol. 164, 1239–1260 [DOI] [PubMed] [Google Scholar]
- 10. Yan S. P., Zhang Q. Y., Tang Z. C., Su W. A., Sun W. N. (2006) Comparative proteomic analysis provides new insights into chilling stress responses in rice. Mol. Cell. Proteomics 5, 484–496 [DOI] [PubMed] [Google Scholar]
- 11. Laukens K., Deckers P., Esmans E., Van Onckelen H., Witters E. (2004) Construction of a two-dimensional gel electrophoresis protein database for the Nicotiana tabacum cv. Bright Yellow-2 cell suspension culture. Proteomics 4, 720–727 [DOI] [PubMed] [Google Scholar]
- 12. Dure L., Crouch M., Harada J., Ho T. D., Mundy J., Quatrano R., Thomas T., Sung Z. R. (1989) Common amino acid sequence domains among the LEA proteins of higher plants. Plant Mol. Biol. 12, 475–486 [DOI] [PubMed] [Google Scholar]
- 13. Silhavy D., Hutvágner G., Barta E., Bánfalvi Z. (1995) Isolation and characterization of a water-stress-inducible cDNA clone from Solanum chacoense. Plant Mol. Biol. 27, 587–595 [DOI] [PubMed] [Google Scholar]
- 14. Hara M., Terashima S., Kuboi T. (2001) Characterization and cryoprotective activity of cold-responsive dehydrin from Citrus unshiu. J. Plant Physiol. 158, 1333–1339 [Google Scholar]
- 15. Shih M. D., Lin S. C., Hsieh J. S., Tsou C. H., Chow T. Y., Lin T. P., Hsing Y. I. (2004) Gene cloning and characterization of a soybean (Glycine max L.) LEA protein, GmPM16. Plant Mol. Biol. 56, 689–703 [DOI] [PubMed] [Google Scholar]
- 16. Kim H. S., Lee J. H., Kim J. J., Kim C. H., Jun S. S., Hong Y. N. (2005) Molecular and functional characterization of CaLEA6, the gene for a hydrophobic LEA protein from Capsicum annuum. Gene 344, 115–123 [DOI] [PubMed] [Google Scholar]
- 17. Brini F., Hanin M., Lumbreras V., Irar S., Pagès M., Masmoudi K. (2007) Functional characterization of DHN-5, a dehydrin showing a differential phosphorylation pattern in two Tunisian durum wheat (Triticum durum Desf.) varieties with marked differences in salt and drought tolerance. Plant Sci. 172, 20–28 [Google Scholar]
- 18. March T. J., Able J. A., Schultz C. J., Able A. J. (2007) A novel late embryogenesis abundant protein and peroxidase associated with black point in barley grains. Proteomics 7, 3800–3808 [DOI] [PubMed] [Google Scholar]
- 19. Wise M. J., Tunnacliffe A. (2004) POPP the question: what do LEA proteins do? Trends Plant Sci. 9, 13–17 [DOI] [PubMed] [Google Scholar]
- 20. Hundertmark M., Hincha D. K. (2008) LEA (late embryogenesis abundant) proteins and their encoding genes in Arabidopsis thaliana. BMC Genomics 9, 118 [DOI] [PMC free article] [PubMed] [Google Scholar]
- 21. Rodrigo M. J., Bockel C., Blervacq A. S., Bartels D. (2004) The novel gene CpEdi-9 from the resurrection plant C. plantagineum encodes a hydrophilic protein and is expressed in mature seeds as well as in response to dehydration in leaf phloem tissues. Planta 219, 579–589 [DOI] [PubMed] [Google Scholar]
- 22. Singh S., Cornilescu C. C., Tyler R. C., Cornilescu G., Tonelli M., Lee M. S., Markley J. L. (2005) Solution structure of a late embryogenesis abundant protein (LEA14) from Arabidopsis thaliana, a cellular stress-related protein. Protein Sci. 14, 2601–2609 [DOI] [PMC free article] [PubMed] [Google Scholar]
- 23. Ji X., Gai Y., Zheng C., Mu Z. (2009) Comparative proteomic analysis provides new insights into mulberry dwarf responses in mulberry (Morus alba L.). Proteomics 9, 5328–5339 [DOI] [PubMed] [Google Scholar]
- 24. Gai Y. P., Li X. Z., Ji X. L., Wu C. A., Yang G. D., Zheng C. C. (2008) Chilling stress accelerates degradation of seed storage protein and photosynthetic protein during cotton seed germination. J. Agron. Crop Sci. 194, 278–288 [Google Scholar]
- 25. Livak K. J., Schmittgen T. D. (2001) Analysis of relative gene expression data using real-time quantitative RT-PCR and the 2−ΔΔCT method. Methods 25, 402–408 [DOI] [PubMed] [Google Scholar]
- 26. Thompson J. D., Gibson T. J., Plewniak F., Jeanmougin F., Higgins D. G. (1997) The CLUSTAL X windows interface: flexible strategies for multiple sequence alignment aided by quality analysis tools. Nucleic Acids Res. 25, 4876–4882 [DOI] [PMC free article] [PubMed] [Google Scholar]
- 27. Saitou N., Nei M. (1987) The neighbor-joining method: a new method for reconstructing phylogenetic trees. Mol. Biol. Evol. 4, 406–425 [DOI] [PubMed] [Google Scholar]
- 28. Nocarova E., Fischer L. (2009) Cloning of transgenic tobacco BY-2 cells; an efficient method to analyse and reduce high natural heterogeneity of transgene expression. BMC Plant Biol. 9, 44 [DOI] [PMC free article] [PubMed] [Google Scholar]
- 29. Liu J. H., Inoue H., Moriguchi T. (2008) Salt stress-mediated changes in free polyamine titers and expression of genes responsible for polyamine biosynthesis of apple in vitro shoots. Environ. Exp. Bot. 62, 28–35 [Google Scholar]
- 30. Xin Z., Li P. H. (1992) Abscisic acid-induced chilling tolerance in maize suspension-cultured cells. Plant Physiol. 99, 707–711 [DOI] [PMC free article] [PubMed] [Google Scholar]
- 31. Levine A., Pennell R. I., Alvarez M. E., Palmer R., Lamb C. (1996) Calcium mediated apoptosis in a plant hypersensitive disease resistance response. Curr. Biol. 6, 427–437 [DOI] [PubMed] [Google Scholar]
- 32. May M. J., Leaver C. J. (1993) Oxidative stimulation of clutathione synthesis in Arabidopsis thaliana suspension cultures. Plant Physiol. 103, 621–627 [DOI] [PMC free article] [PubMed] [Google Scholar]
- 33. Colmenero-Flores J. M., Campos F., Garciarrubio A., Covarrubias A. A. (1997) Characterization of Phaseolus vulgaris cDNA clones responsive to water deficit: identification of a novel late embryogenesis abundant-like protein. Plant Mol. Biol. 35, 393–405 [DOI] [PubMed] [Google Scholar]
- 34. Battaglia M., Olvera-Carrillo Y., Garciarrubio A., Campos F., Covarrubias A. A. (2008) The enigmatic LEA proteins and other hydrophilins. Plant Physiol. 148, 6–24 [DOI] [PMC free article] [PubMed] [Google Scholar]
- 35. Bies-Ethève N., Gaubier-Comella P., Debures A., Lasserre E., Jobet E., Raynal M., Cooke R., Delseny M. (2008) Inventory, evolution and expression profiling diversity of the LEA (late embryogenesis abundant) protein gene family in Arabidopsis thaliana. Plant Mol. Biol. 67, 107–124 [DOI] [PubMed] [Google Scholar]
- 36. Tunnacliffe A., Wise M. J. (2007) The continuing conundrum of LEA proteins. Naturwissenschaften 94, 791–812 [DOI] [PubMed] [Google Scholar]
- 37. Dalal M., Tayal D., Chinnusamy V., Bansal K. C. (2009) Abiotic stress and ABA-inducible group 4 LEA from Brassica napus plays a key role in salt and drought tolerance. J. Biotechnol. 139, 137–145 [DOI] [PubMed] [Google Scholar]


