

Abstract
Glutathione S-transferases (GSTs) are a superfamily of enzymes that conjugate glutathione to a wide variety of both exogenous and endogenous compounds for biotransformation and/or removal. Glutathione S-tranferase omega 1 (GSTO1) is highly expressed in human cancer cells, where it has been suggested to play a role in detoxification of chemotherapeutic agents. Selective inhibitors of GSTO1 are, however, required to test the role that this enzyme plays in cancer and other (patho)physiological processes. With this goal in mind, we performed a fluorescence polarization activity-based protein profiling (fluopol-ABPP) high-throughput screen (HTS) with GSTO1 and the Molecular Libraries Small Molecule Repository (MLSMR) 300K+ compound library. This screen identified a class of selective and irreversible α-chloroacetamide inhibitors of GSTO1, which were optimized to generate an agent KT53 that inactivates GSTO1 with excellent in vitro (IC50 = 21 nM) and in situ (IC50 = 35 nM) potency. Cancer cells treated with KT53 show heightened sensitivity to the cytotoxic effects of cisplatin, supporting a role for GSTO1 in the detoxification of chemo-therapeutic agents
INTRODUCTION
Glutathione S-transferases (GSTs) are a large and diverse class of enzymes that conjugate glutathione to a variety of both exogenous and endogenous compounds for biotransformation and/or removal.1 Using activity-based protein profiling (ABPP), we discovered that glutathione S-tranferase omega 1 (GSTO1) is overexpressed in human cancer cell lines that show enhanced aggressiveness,2 and other studies have implicated GSTO1 in chemotherapeutic resistance.3,4
Despite its potential role in cancer, few inhibitors have been described for GSTO1. In our original report of a fluorescence polarization (fluopol)-ABPP platform for high-throughput screening (HTS)5 we identified lead GSTO1 inhibitors from a 2000-compound library, but the potency, selectivity, and biological activity of these compounds were not extensively examined. More recently, Son et αl.6 reported that the commercially available fluorescent protein tag, CellTracker Green (5-chloromethylfluorescein diacetate, Invitrogen), inhibits GSTO1 with good potency (IC50 = 51 nM) and selectivity. While this probe may be useful for certain applications, it readily undergoes hydrolysis by endogenous esterases, rendering the compound membrane-impermeable. We therefore sought to develop an improved inhibitor that showed the requisite combination of potency, selectivity, and cellular activity for assessing the function of GSTO1 in cancer.
Among GSTs, GSTO1 is unusual in that, rather than having a catalytic serine or tyrosine in the active site, GSTO1 utilizes a hyperreactive catalytic cysteine nucleophile.7 As a consequence, enzymatic activity is sensitive to generic thiol-alkylating agents (e.g., N-ethylmaleimide),8 sulfonate esters (SEs),2 and halo-acetamides.9,10 A limited number of substrate assays have been developed, but these are not well-suited for HTS due to poor turnover rates and/or reliance on UV absorbance at short wavelengths (305 nm), where many small-molecules exhibit intrinsic absorbance.11 We previously showed, however, that GSTO1 activity could be assayed by fluopol-ABPP with a rhodamine-tagged SE activity-based probe.5 Fluopol-ABPP, when performed in a competitive format, is compatible with HTS of compound libraries, whereby enzyme inhibition is assessed by the ability of compounds to out-compete probe-labeling of the target enzyme (resulting in reduced fluopol signal). When used in the context of a complex proteome, competitive ABPP also offers a means to assess inhibitor selectivity against a wide range of probe-reactive enzymes. Here, we apply fluopol-ABPP to screen a 300K+ small-molecule library, made available through the NIH Molecular Libraries Probe Production Centers Network (MLPCN), for GSTO1 inhibitors. Lead hits were optimized using competitive ABPP in cancer cell proteomes, resulting in the generation of an agent KT53 that is a highly potent, selective, and cell-active inhibitor of GSTO1. KT53 sensitizes cancer cells to the cytotoxic effects of cisplatin, providing the first pharmacologic evidence that GSTO1 contributes to chemotherapy resistance in cancer.
MATERIALS AND METHODS
Materials
(phenyl) SE-Rh was synthesized as described previously12; the synthesis of CA-Rh is detailed in Supporting Information. All chemical reagents and solvents were obtained from Sigma-Aldrich or ThermoFisher unless otherwise indicated. All cell culture media and supplements were obtained from CellGro and Omega Scientific.
Recombinant protein expression and purification
GSTO1 (human isoform) was obtained as an expressed sequence tag from Invitrogen (Carlsbad, CA) and subconed into pTrcHisB (Invitrogen). Point mutants were generated using the Quik-change Site-Directed Mutagenesis Kit (Stratagene). The constructs were expressed in BL21(DE3) E. coli and purified as described.5
Fluopol-ABPP HTS Assay
The fluopol-ABPP assay was performed at the Scripps Research Institute Molecular Screening Center (SRIMSC) in Jupiter, FL using robotic handlers. Briefly, 4.0 µL of Assay Buffer (0.01% Pluronic detergent, 50 mM Tris HCl pH 8.0, 150 mM NaCl, 1 mM dithiothreitol) containing recombinant GSTO1 (1.25 µM) was dispensed into 1536 microtiter plates. Next, test compound (30 nL in DMSO) or DMSO alone (0.59% final concentration) was added to the appropriate wells, giving 5.96 µM final concentration, and incubated for 30 min at 25 °C. The assay was started by dispensing SE-Rh probe (1.0 µL of 375 nM in Assay Buffer) to all wells, giving a final concentration of 75 nM. Plates were centrifuged and incubated for 20 hr at 37 °C. Prior to reading, plates were equilibrated at room temperature for 10 min. Fluorescence polarization was read for 30 sec for each polarization plane (parallel and perpendicular) on a Viewlux microplate reader (PerkinElmer, Turku, Finland) using a BODIPY TMR FP filter set and a BODIPY dichroic mirror (excitation = 525 nm, emission = 598 nm). The well fluorescence polarization value (mP) was obtained via the PerkinElmer Viewlux software. Compounds that inhibited GSTO1 greater than 34.81% (mean + 3 × standard deviation) were considered active. Assay statistics: Z’ = 0.80 ± 0.05, S:N = 2.08 ± 0.21, hit rate = 1.06% (3,207 compounds). The top 2,374 available compounds were then re-tested in triplicate using the same HTS assay conditions and hit cutoff; assay statistics: Z’ = 0.84 ± 0.04, S:N = 3.19 ± 0.14, hit rate = 54% (1,286 compounds).
Competitive ABPP of recombinant GSTO1
Recombinant GSTO1 (250 nM in 50 µL of Dulbecco’s phosphate buffered saline [DPBS]) was incubated with 1 µM test compound (1 µL of a 50x stock in DMSO) for 30 min at 25 °C followed by reaction with 10 µM SE-Rh (1 µL of 50x stock in DMSO) for 1 hr at 25 °C. The reaction was quenched with 2x SDS-PAGE loading buffer, separated by SDS-PAGE and visualized by in-gel fluorescent scanning. The percentage activity remaining was determined by measuring the integrated optical density of the GSTO1 band relative to a DMSO-only (no compound) control. IC50 values (Table 1 cpds) were determined from dose-response curves from three trials at each inhibitor concentration (3 −3000 nM) using Prism software (GraphPad).
Table 1.
Top GSTO1 inhibitor leads following gel-based competitive ABPP screening.
 | ||||||||
|---|---|---|---|---|---|---|---|---|
| cpd | structure | IC50 (nM) |
% inhibition | off-targets | ||||
|
in vitro (nM) |
in situ (1 µM) |
|||||||
| 1000 | 100 | 1 hr | 12 hr | 5 µM | 10 µM | |||
| 1 | 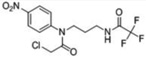 |
28 | 100 | ≥98 | 100 | 65 | 0 | 0 |
| 2 | 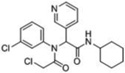 |
38 | 100 | ≥98 | 100 | 90 | 49kDa 38kDa 34kDa |
38kDa 34kDa |
| 3 | 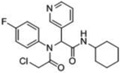 |
54 | 100 | 75 | 100 | 95 | 38kDa 34kDa |
38kDa 34kDa |
| 4 | 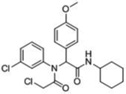 |
32 | 100 | ≥98 | 100 | 80 | 49kDa 38kDa |
49kDa 38kDa |
| 5 | 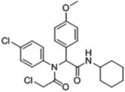 |
22 | 100 | 90 | 60 | -- | 0 | 0 |
| 6 | 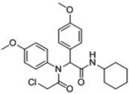 |
-- | 95 | 55 | 85 | -- | 0 | 52kDa 49 kDa |
| 7 | 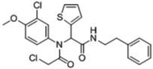 |
-- | 100 | 85 | 95 | -- | 34kDa | 52kDa 49kDa 38kDa 34kDa |
| 8 | 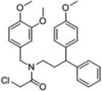 |
-- | 100 | 80 | -- | -- | -- | 55kDa* 49kDa 38kDa 34kDa 32kDa 15kDa |
| 9 | 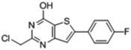 |
-- | 100 | 75 | -- | -- | -- | 70kDa 38kDa 34kDa 15kDa |
| 10 | 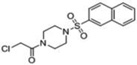 |
-- | 100 | 55 | -- | -- | -- | 55kDa* 38kDa |
observed off-target of both CA-Rh (inhibitor) and SE-Rh (activator); otherwise all off-targets listed here and in subsequent tables are off-target inhibition events observed by CA-Rh labeling competition.
Cell Culture and preparation of MDA-MB-435 soluble proteome
MDA-MB-435 cells were grown to 90% confluency in RPMI medium supplemented with 10% fetal calf serum (FCS) in a humidified, 5% CO2 incubator at 37 °C. Cells were washed 3x with DPBS and harvested in ice-cold DPBS by scraping. Cell pellets were isolated by centrifugation (1000 × g, 3 min), resuspended in ~4x (v/v) DPBS and lysed by sonicated with a probe sonicator (10 × 3 sec pulses, 50% power) on ice. The soluble fraction was isolated by centrifugation (100,000 × g; 45 min; supernatant = soluble). Protein concentration was assayed (DC Protein Bioassay Kit, Bio-Rad), adjusted to 1 mg/mL in DPBS, and aliquots were frozen at −80 °C until use.
Competitive ABPP in a complex proteome
MDA-MB-435 soluble proteome (1 mg/mL in DPBS) was incubated with 0.1 nM - 10 µM inhibitor (1 µL of a 50x stock in DMSO) for 30 min at 25 °C. The proteome was then labeled with either 10 µM SE-Rh or 5 µM CA-Rh (1 µL of a 50x stock in DMSO) for 1 hr at 25 °C. The reaction was quenched with 2x SDS-PAGE loading buffer, separated by SDS-PAGE and visualized by in-gel fluorescent scanning and analyzed as described for recombinant GSTO1 competitive ABPP. When available, data from multiple experiments were averaged (typical stdev = ±3%). IC50 values (KT53, KT59) were determined from dose-response curves from three trials at each inhibitor concentration (0.1 – 250 nM) using Prism software (GraphPad).
Competitive ABPP of GSTO1 in situ
MDA-MB-435 cells were grown to 90% confluency in RPMI medium (5 mL total volume; supplemented with 10% fetal calf serum [FCS]) and treated with 0.01 nM - 1 µM inhibitor (5 µL of a 1000× stock in DMSO) for 1 hr at 37 °C. Cells were harvested, washed 4 times with 10 mL DPBS, and homogenized by sonication in DPBS. The soluble fraction was isolated by centrifugation (100,000 × g, 45 min) and the protein concentration was adjusted to 1 mg/mL with DPBS. SE-Rh (1 µL of 50x stock in DMSO) was added to a final concentration of 10 µM in 50 µL total reaction volume. The reaction was incubated for 1 hr at 25 °C, quenched with 2x SDS-PAGE loading buffer, separated by SDS-PAGE and visualized by in-gel fluorescent scanning and analyzed as described for recombinant GSTO1 competitive ABPP. When available, data from multiple experiments were averaged (typical stdev = ±3%). IC50 values for KT53 and KT59 were determined from dose-response curves from three trials at each inhibitor concentration (0.01 – 1000 nM) using Prism software (GraphPad).
CC-ABPP of GSTO1 in vitro
MDA-MB-435 soluble proteome (1 mg/mL in DPBS) was treated with 1 nM - 10 µM KT59 (1 µL of 50x stock in DMSO) for 30 min at 25 °C. For competition with KT53, soluble proteome was first pre-incubated with KT53 (0.1 – 10 µM, 30 min) prior to addition of KT59 (equal molar concentration, 30 min). Each sample was reacted with rhodamine-azide (Rh-N3; 50 µM) under click chemistry reaction conditions [1 mM TCEP, 100 µM TBTA ligand, 1 mM Cu(II)sulfate].13 The reactions was incubated for 1 hr at 25 °C, quenched with 2x SDS-PAGE loading buffer, separated by SDS-PAGE, and visualized by in-gel fluorescent scanning. The percent labeling was determined by measuring the integrated optical density of the GSTO1 band relative to the integrated optical density of the GSTO1 band at the highest test compound dose (where saturated labeling is achieved).
CC-ABPP of GSTO1 in situ
MDA-MB-435 cells were grown to 90% confluency in RPMI medium (5 mL total volume; supplemented with 10% FCS) and treated with 16 – 1000 nM KT59 (1 µL of 1000x stock in DMSO) for 6 hr at 37 °C. Cells were harvested, washed 4 times with 10 mL DPBS, and homogenized by sonication in DPBS. The soluble fraction was isolated by centrifugation (100K × g, 45 min) and the protein concentration was adjusted to 1 mg/mL with DPBS. Each sample was reacted with Rh-N3 (50 µM) under CC reaction conditions and analyzed as described for CC-ABPP of GSTO1 in vitro.
Gel filtration analysis of inhibition mechanism
Recombinant GSTO1 (250 nM) in DPBS was incubated with DMSO or in-hibitor (1 µM) for 30 min at 25 ° C and each reaction was split into two fractions. One fraction was reacted directly with CARh, and the other was passaged over a Sephadex G-25M column (GE Healthcare) and then reacted with CA-Rh at a final concentration of 5 µM in 50 µL total reaction volume. The reaction was incubated for 1 hr at 25 °C, quenched with 2x SDS-PAGE loading buffer, separated by SDS-PAGE, visualized by in-gel fluorescent scanning, and analyzed as described for recombinant GSTO1 competitive ABPP. Following in-gel scanning, the gel was stained with Coomassie for protein load comparison.
LCMS/MS analysis of inhibition mechanism
See Supporting Information for full details. Briefly, purified GSTO1 (50 µM) was incubated with inhibitor 1 or 3 (10 µM) for 30 min, followed by reduction, alkylation, and trypsin digestion. A fraction of each sample was analyzed by microcaillary LC-MS/MS using a nanospray ESI14 source (Agilent HPLC, ThermoScientific Orbitrap Velos) in data-dependent acquisition mode. Results were searched using Sequest15 (Cys static mod +57.021, Cys variable mod +274.057 for 1 and +310.148 for 3) and assembled into protein identifications using DTASelect.16 Sequest results are summarized in Table S2. The area under the curve (AUC) for each modified peptide was calculated from the extracted ion chromatogram and normalized to the AUC for the corresponding unmodified peptide. Percentage for each modified peptide is reported as a percentage of the total modified species observed (sum of all normalized AUCs) in the sample. No modified peptides were observed in the DMSO-treated sample.
HPLC-MS analysis of compound stability
Test compound (0.1 mg/ml in DPBS containing 1% DMSO) was incubated at 37 °C for 24 hr. At the indicated time point (1, 3, 6, 12, and 24 hr), an aliquot (15 µL) was removed and subject to HPLC-MS analysis using an Agilent 1200 series HPLC interfaced with an Agilent MSD SL controlled by ChemStation (Agilent) software. Compounds were separated over a Prep-C18 scalar column (5 µm, 4.6 × 150 mm, Agilent) using a water-acetonitrile buffer system. (Buffer A: 100% water, Buffer B: 95% acetonitrile/5% water, each containing 0.1% trifluoroacetic acid). The run consisted of 5 min 70% Buffer A, followed by a linear, increasing gradient (30–80%) of Buffer B over 20 min. The eluate was monitored by UV (254 nm) and ESI-MS. The AUC for each species was calculated (ChemStation) as a percentage of the total species present in the UV trace.
Cytotoxicity analysis of inhibitor compounds
MDAMB-435 cells in RPMI medium (with or without 10% FCS) were dispensed into a 96-well plate (100 µL, 15E4 cells/well). Next, 0 −50 µM KT53 or KT59 (10 µL of 11x stock in medium containing 10% DMSO) was added to the appropriate wells. Cells were incubated for 48 hr at 37 °C and cell viability was determined by the WST-1 assay (Roche) according to manufacturer instructions. CC50 values were determined from dose-response curves from two biological replicates (n = 6 for each) at each inhibitor concentration using Prism software (GraphPad).
Cisplatin-induced cytotoxicity studies
MDAMB-435 cells in RPMI medium (containing 10% FCS) were dispensed into a 96-well plate (100 µL, 20E4 cells/well) and incubated overnight at 37 °C. When cells had reached 60–70% confluency, 0–1 µM KT53 (10 µL of an 11x stock in medium containing 1% DMSO) was added to the appropriate wells. Cells were incubated for 1 hr at 37 °C prior to addition of 0–250 µM cisplatin (10 µL of a 12x stock in media containing 7.5% DMSO). After a 12 hr (total) incubation, cells were re-dosed with 0–1 µM KT53, respectively (10 µL of a 13x stock in medium containing 1% DMSO) and incubated at 37 °C for a further 12 hr. Cell viability was determined by the WST-1 assay (Roche) according to manufacturer instructions. The analysis at 1 µM KT53 includes 7 biological replicates (n = 5 ea), at 0.5 µM includes 2 biological replicates (n = 5 ea), at 0.25 and 0.125 µM includes 3 biological replicates (n = 5 ea). Statistical analysis was carried out using an unpaired Student’s t-test using Prism Software (GraphPad); Data are presented as the mean ± SEM. For all statistical tests, significance was established at P < 0.05.
Chemical Synthesis
RESULTS AND DISCUSSION
1. Discovery of α-chloroacetamide (CA) inhibitors of GSTO1
Fluopol-ABPP evaluates test compounds for their ability to block enzyme reaction with a fluorescent activity-based probe. In the absence of a competitive agent, probe binding to the much larger target enzyme results in slower tumbling of the probe and a concomitant increase in fluorescence polarization (fluopol). As such, test compounds are monitored for their ability to block the increase in fluopol. The fluopol-ABPP technique has been applied to screen for inhibitors of numerous probe-reactive enzymes (http://pubchem.ncbi.nlm.nih.gov/). As described,5 we first verified that purified, recombinant wild-type GSTO1 (1 µM), but not a catalytically inactive mutant (C32A), was able to undergo labeling with a rhodamine-conjugated phenyl sulfonate ester (SE-Rh; 75 nM) activity-based probe. We then completed a pilot screen of 2,000 compounds from the Molecular Libraries Small Molecule Repository (MLSMR) validation set, which yielded 38 hit compounds (1.9% hit rate). 5 This screen was conducted under kinetically controlled conditions, where an assay time point (90 min SE-Rh incubation) prior to completion of the labeling reaction allowed for identification of both reversible and irreversible inhibitors of GSTO1.5 However, given the high hit rate from the pilot screen, we elected for the full deck screen (302,667 compounds), conducted at The Scripps Research Institute Molecular Screening Center (SRIMSC) branch of the MLPCN, to use an extended probe incubation time (20 hr), where complete inhibition of GSTO1 is achieved, to reduce the number of hits and select for compounds that had a high probability of fully inactivating GSTO1, likely by an irreversible mechanism. A total of 3,207 compounds (1.1%) were active, passing the set threshold of 34.81% GSTO1 inhibition. The raw data is accessible via PubChem (BioAssay AIDs 1974 and 2176). A representative subset of the primary screening data is depicted in Figure 1. The top 2,374 active compounds were then retested in triplicate, and 1,286 compounds (54%) were confirmed as active.
Figure 1.

Fluopol-ABPP HTS assay for GSTO1 inhibitor discovery. Screening data for a representative 20,000 compounds of the MLPCN small molecule library are shown. Compounds that reduced the SE-Rh fluorescence polarization signal by ≥ 34.81% (line) were designated as hits for GSTO1 (red circles).
Because the HTS assay conditions were designed to enrich for irreversible inhibitors, compounds with potentially reactive functionalities (e.g., α-chloroacetamides, epoxides, and α-aryl chlorides) featured prominently among the top hits. Initially, we cherry-picked 126 active compounds for secondary gel-based competitive ABPP screening: 33 epoxides, 30 α-aryl chlorides, and 63 sterically hindered α-chlorocetamides (CAs) (i.e., bearing tertiary nitrogens).
We first assessed whether or not test compounds could inhibit purified, recombinant GSTO1 (1 µM compound concentration) using a competitive ABPP assay with the SE-Rh probe (Figure S1 and Table S1). The majority of top hits belonged to the CA inhibitor class. Fifty-three of the top compounds (≥ 60% inhibition), along with an additional 24 cherry-picked HTS CA hits, were then evaluated for endogenous GSTO1 inhibition in the context of a complex proteome (1 µM compound concentration; Figure S2 and Table S1). For this assay, a soluble proteome preparation of the human melanoma cell line MDA-MB-435, which expresses high endogenous levels of GSTO1,12 was employed. Of the 77 compounds, 22 (2 epoxides, 3 α-aryl-chlorides, and 17 CAs) showed high (at least ~90%) inhibition of the target enzyme.
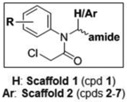
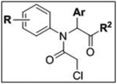
A third round of gel-based competitive ABPP secondary screening assessed potency at a lower (100 nM) compound concentration in the MDA-MB-435 soluble proteome (Figure S3). The top ten compounds, all CAs with the exception of α-aryl chloride 9, are shown in Table 1. The majority of the top compounds (1–7) exhibited highly similar structural features, which could be broken down into two sub-types: Scaffold 1 (compound 1) and Scaffold 2 (compounds 2–7; Table 1). Both structures feature an R-substituted N-phenyl and an adjacent amide moiety; Scaffold 1 is distinguished by having a hydrogen (H) alpha to the amide nitrogen, whereas Scaffold 2 has an aromatic/heteroaromatic (Ar) derivative at that location.
An assessment of selectivity (10 µM compound concentration) was conducted using both the SE-Rh and cysteine-reactive CARh17 activity-based probes to characterize potential off-target inhibition against the more than 30 ABPP probe-reactive proteins visible by gel-based analysis in the MDA-MB-435 soluble proteome (Figure S4). The results, summarized in Table 1, show that a few of the top leads (e.g., 1, 5) evinced considerable selectivity, having few off-targets (listed by molecular weight of off-target) at concentrations more than 300-fold above their IC50 values. Other inhibitors (e.g., 2–4, 6–10) exhibited some off-target reactivity. However, as a whole, the selectivity of the Scaffold 1 and 2 classes was deemed sufficient to allow for medicinal chemistry optimization to remove unwanted activities. Compounds 8–10 were deprioritized as potential leads due to their high off-target rate and reduced inhibition at 100 nM in the complex proteome. Thus, our attention focused on Scaffold 1 and Scaffold 2 compounds for further investigation
Before moving on to describe our medicinal chemistry efforts to improve GSTO1 inhibitor potency and selectivity, it is worth noting that compound 7 has previously been identified in a MLPCN campaign by Bittker et al.18 as a potent and selective cytotoxic agent, capable of inducing death in cells expressing the oncogenic RAS allele HRASV12, but not cell lines lacking HRASV12. As a cell-based assay was employed, no specific molecular target was implicated in the cytotoxic effects of 7. It therefore merits consideration whether one or more of the protein targets for this compound detected by competitive ABPP could be responsible for the observed phenotype.
2. Inhibition mechanism of lead compounds
While it was surmised that the identified compounds operated by a covalent mechanism to inactivate GSTO1, this was tested experimentally using both gel filtration and liquid chromatography-tandem mass spectrometry (LC-MS/MS). The blockade of ABPP-probe labeling of GSTO1 by two representative compounds, 1 and 3, was not reversed by gel filtration (Figure 2A), indicative of irreversible inhibition.
Figure 2.

GSTO1 inhibitors operate by irreversibly acylating the active site cysteine of GSTO1. A) Labeling of GSTO1 is not recovered following gel filtration to remove small molecules (top gel slice; fluorescent image shown in grey scale). Equal protein recovery shown in Coomassie-stained bottom gel slice. B) Proposed modification of GSTO1 by 1 and 3.
Further analysis by LC-MS/MS revealed that compounds 1 and 3 covalently label the active site cysteine nucleophile, Cys32,2 of GSTO1 (Table 2). Cys32 was the dominant site of labeling for compounds 1 and 3, with only a minor fraction (0–0.6%) of labeling being observed on non-active site cysteines. The observed mass shift of the active site peptide (see Sequest analysis, Table S2) indicates that the reaction occurs via cysteine nucleophilic attack to displace the chloride, as expected of this chemotype and depicted in Figure 2B.
Table 2.
Compounds 1 and 3 label the active site cysteine of GSTO1.
| Compound/Control | ||||
|---|---|---|---|---|
| Peptide | 1 | 3 | DMSO | |
| 100% | 99.4% | 0% | ||
| K.KNPFGLVPVLENSQGQLIYESAITC*EYLDEAYPGKK.L | 0% | 0.05% | 0% | |
| K.KLLPDDPYEKAC*QKMILELFSKVPSLVGSFIR.S | 0% | 0.6% | 0% | |
| R.LEAMKLNEC*VDHTPK.L | 0% | 0.02% | 0% | |
| total§ | 100% | 100% | 0% | |
indicates labeling observed on Cys; active site Cys highlighted in red;
total modified species observed in the sample as measured by area under the curve of extracted ion chromatograms normalized to corresponding unmodified peptide; Underlined K or R indicates peptide with missed cleavage at that site was also observed (see Table S2 for Sequest results).
3. In situ activity of lead GSTO1 inhibitors
We next sought to determine whether the lead inhibitors could inactivate GSTO1 in living cancer cells. Cultured MDA-MB-435 cells were treated with 1 µM compound for 1 hr in medium containing 10% serum, after which cells were harvested and their soluble proteomes analyzed by gel-based ABPP with SE-Rh (Figure S5). As summarized in Table 1, compounds 1–4 completely inhibited GSTO1 activity in cancer cells. For further characterization of in situ activity, we tested compounds 1 and 3 over an extended time course. The inhibitory activity of 1 was significantly decreased after 18 hr (Figure 3, 25% inhibition). In contrast, compound 3 showed a longer duration of activity, maintaining > 75% GSTO1 inhibition at 18 hr. However, 3 also exhibited moderate off-target reactivity and reduced potency as compared to 1 (Table 1), necessitating optimization of both scaffold types.
Figure 3.

Time course of inhibition of GSTO1 in cultured MDA MB-435 cells by competitive ABPP with SE-Rh. Compound 1 shows modest in situ inhibition of GSTO1 at 12 hr (65%) and 18 hr (25%) following a single 1 µM dose of compound in serum-containing medium. In comparison, compound 3 sustains more than 75% inhibition of GSTO1 for up to 18 hr. GSTO1 indicated with arrow; inhibition calculated relative to DMSO (no compound) control. Fluorescent image here, and for all subsequent ABPP figures, shown in grey scale.
4. Optimization of lead GSTO1 inhibitors
4.1 Structure-activity relationships (SAR) and chemistry
While compound 1 was the only representative member of Scaffold 1 in the screening library, there were a number of Scaffold 2 analogs, allowing a preliminary assessment of SAR. A halogen at the 3- or 4-position of the phenyl ring (R) conferred potency (e.g., 2–5, Table 1), but was not tolerated at the 2-position (M04, L08, Table S1). The aromatic position was amenable to a diversity of ring structures (3-pyridine for 2 and 3, 4-methoxyphenyl for 4–6, and thiophene for 7, Table 1). Likewise, the amide appeared to be a potentially structurally flexible position, allowing both cyclohexylamides (2–6) and phe-nylethylamides (7). With this information in mind, we next initiated an ABPP-guided medicinal chemistry program to improve the potency, selectivity, and in situ activity of lead CA inhibitors.
The synthesis of compounds investigated in this study is summarized in Schemes 1 and 2. Scheme 1 was utilized for synthesis of Scaffold 1 analogs, whereby fluoro- or iodo-nitrobenzenes A were reacted with diaminoalkanes B to afford amines C, which were subsequently acylated to give amides D. Alternatively, D intermediates were synthesized by alkylation of anilines E with bromides F. N-alkylation of D was accomplished upon incubation with chloroacetyl chloride to afford probes G. Synthesis of Scaffold 2 analogs (H) was accomplished by one-pot Ugi reaction as depicted in Scheme 2.
Scheme 1.

Scheme 2.

4.2 SAR studies of Scaffold 1 GSTO1 inhibitors
Consistent with the SAR determined from HTS library compounds, in vitro gel-based competitive ABPP of Scaffold 1 analogs (Table 3 and Figure 4A) revealed that a 3- or 4-substituted electron-withdrawing nitro group (KT48 and 1, respectively) conferred potency versus 2-substitution (KT49) at the R position of the N-phenyl. A halogen could be substituted for nitro at the 4-position (KT19) with preservation of potency, whereas 4-substituted methyl (KT16) and methoxymethyl (KT15) were not tolerated (Table 3 and Figure 4A). Replacing the trifluoro-acetamide group at R1 with other alkyl (KT8, KT45, KT3) or aromatic (KT9) amides lead to – in some cases dramatic – reduction in in vitro potency, as did replacement of the acetamide with a straight chain alkyl group (KT2; Table 3 and Figure 4A). KT2 also exhibited a higher number of off-targets (Table 3 and Figure 4B), possibly due to its increased hydrophobicity and/or decreased structural rigidity.
Table 3.
SAR of Scaffold 1 analogs.
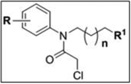 | ||||||
|---|---|---|---|---|---|---|
| cpd | R | n | R1 | % inhibition | off- targets 5 µM |
|
|
in vitro 100 nM |
in situ 12 hr, 1 µM |
|||||
| 1 | 4-NO2 | 1 | ≥98 | 65 | 0 | |
| KT48 | 3-NO2 | 1 | 35 | -- | 0 | |
| KT49 | 2-NO2 | 1 | 5 | -- | 0 | |
| KT19 | 4-Cl | 1 | 95 | 65 | 0 | |
| KT16 | 4-Me | 1 | 15 | -- | 0 | |
| KT15 | 4-OMe | 1 | 20 | -- | 0 | |
| KT8 | 4-NO2 | 1 | 15 | -- | 0 | |
| KT45 | 4-NO2 | 1 | 90 | 70 | 0 | |
| KT9 | 4-NO2 | 1 | 35 | -- | 38kDa | |
| KT2 | 4-NO2 | 1 | 60 | -- | 52kDa 49kDa 38kDa |
|
| KT3 | 4-NO2 | 1 | 60 | 80 | 0 | |
| KT28 | 4-NO2 | 2 | 90 | 80 | 0 | |
Figure 4.

Competitive ABPP of Scaffold 1 (A and B) and Scaffold 2 (C and D) analogs in vitro. A and C) Assessment of GSTO1 inhibition potency (100 nM compound) in MDAMB-435 soluble proteome with SE-Rh ABPP probe. B and D) Assessment of selectivity (5 µM compound) in MDAMB-435 soluble proteome with CARh ABPP probe. GSTO1 (black) and off-target bands (maroon) indicated with arrows. Gels imaged at 60% intensity with the following exceptions: top blue box (B and D): 50% intensity, bottom blue box (B and D): 70% intensity to enhance visualization of off-target bands. See Figure S6 for full gel images of A and C and 5 µM profile with SE-Rh.
Interestingly, it was noted that KT3 provided more sustained in situ inhibition versus 1 (80% versus 65%, respectively; Table 3 and Figure 5), despite its comparatively weak in vitro inhibition. We were able to improve the in vitro potency by adding a methylene to the alkyl linker connecting the CA with the amide (KT28; Table 3 and Figure 4A). The sustained in situ inhibition afforded by KT3 and KT28 indicates that the trifluoroacetamide moiety, while conferring potency in vitro, may limit cellular stability. As compared to starting compound 1, KT28 was the most optimized compound based on Scaffold 1, with somewhat diminished in vitro potency (90% versus ≥ 98% inhibition at 100 nM) but enhanced in situ potency (80% versus 65% inhibition, 1 µM compound concentration, sustained 12 hr) (Table 3).
Figure 5.

Inhibition of GSTO1 in cultured MDAMB-435 cells. Following a 12 hr in situ incubation (1 µM compound; medium containing 10% serum), cells were harvested and soluble proteome isolated and profiled by gel-based ABPP with SE-Rh. GSTO1 indicated with arrow.
4.3 SAR studies of Scaffold 2 GSTO1 inhibitors
Based on the SAR analysis of library compounds and Scaffold 1, for investigation of Scaffold 2, we initially chose to fix R as 4-fluoro for investigation of the aromatic and amide moieties (Table 4). In addition to the cyclohexylamide and phenylethyl-amide groups exhibited by several top-ten compounds at R2 (2–6 and 7, respectively), benzylamide (KT30) conferred similar potency but without improvement in selectivity (Table 4 and Figure 4C, D).
Table 4.
SAR of Scaffold 2 analogs.
 | ||||||
|---|---|---|---|---|---|---|
| cpd | R | Ar | R2 | % inhibition | off- targets 5 µM |
|
|
in vitro 100 nM |
in situ 12 hr, 1 µM |
|||||
| 3 | 4-F | 3-Py | 75 | 95 | 38kDa 34kDa |
|
| KT42 | 4-F | 3-Py | 0 | -- | 0 | |
| KT44 | 4-F | 3-Py | 0 | -- | 34kDa | |
| KT31 | 4-F | 3-Py | 0 | -- | 38kDa 34kDa |
|
| KT30 | 4-F | 3-Py | 90 | -- | 38kDa 34kDa |
|
| KT34 | 4-F | 5-thiazole | 50 | -- | 38kDa | |
| KT35 | 4-F | 2-furan | 70 | -- | 42kDa 38kDa |
|
| KT37 | 4-F | 4-Py | 95 | 95 | 38kDa | |
| KT33 | 4-F | 2-Py | 100 | 90 | 0 | |
| KT40 | 4-F | Ph | 85 | 75 | 38kDa | |
| KT53 | 3-F | 2-Py | 100 | 95 | 0 | |
| KT54 | 3.4-diF | 2-Py | 100 | 95 | 0 | |
| KT55 | 3-Cl | 2-Py | 100 | 85 | 0 | |
Other N-cyclic (KT42), alkoxy (KT44), and aromatic (KT31) amides were not tolerated, with GSTO1 inhibition at 100 nM dropping to zero (Table 3 and Figure 4C). Of all the analogous Ar derivatives tested: 5-thiazole (KT34), 2-furan (KT35), phenyl (KT40), 4-pyridine (KT37), 3-pyridine (3), and 2-pyridine (KT33), the most potent in vitro derivatives were the 2-and 4-pyridines (Table 4 and Figure 4C). The 2-pyridine analog (KT33) was the most selective, having no visible off-targets at 5 µM concentration in the MDA-MB-435 soluble proteome (Table 4 and Figure 4D). The 2- and 4-pyridine derivatives KT33 and KT37 also exhibited very good in situ potency, inhibiting GSTO1 activity by at least 90% after 12 hr (1 µM compound concentration; Table 4 and Figure 5).
With the aromatic and amide moieties thus optimized, we briefly revisited the question of N-phenyl substitution with compounds KT53-KT55. The 3-fluoro derivatives KT53 and KT54 offered the best in situ inhibition (Table 4 and Figure 5) and selectivity (Table 4 and Figure 4D), having no off-targets at 5 µM compound concentration in the MDA-MB-435 soluble proteome. Compounds KT53 and KT54 represent a significant optimization of the Scaffold 2 inhibitors, combining the best properties of the top HTS compounds (Table 1), including excellent potency at 100 nM compound concentration (100% inhibition; Figure 4C), sustained potency for 12 hr in situ (95%; Figure 5), and high selectivity, having no observed off-targets at 5 µM compound concentration (Figure 4D). KT53 and KT54 were also more potent and equally selective as compared to the optimized Scaffold 1 compound KT28; as such, we elected to proceed with in depth characterization of KT53.
5. Inhibitory profiles of KT53 against GSTO1
Dose response curves for in vitro and in situ inhibition of GSTO1 by KT53 (Figure 6A and B) gave IC50 values of 21 and 35 nM, respectively. Time course experiments revealed that KT53 potently inhibited more than 90% of GSTO1 activity for at least 18 hr (Figure 7), designating the compound as suitable for extended pharmacological studies of GSTO1 in cells.
Figure 6.

IC50 curves for GSTO1 inhibition by KT53 and KT59 in vitro (A, C) and in situ (B, D) generated by competitive ABPP with SE-Rh following a 6 hr in situ incubation. IC50 values were determined by fitting a three-parameter dose-response curve (GraphPad Prism); n = 3, error is ± SEM. Representative gel slice of GSTO1 band shown below each curve.
Figure 7.

Time course for in situ inhibiton of GSTO1 by KT53 (1 µM) analyzed by competitive ABPP with SE-Rh. KT53 completely inhibited GSTO1 activity for up to 6 hr, and showed at least 90% inhibition up to 18 hr. After two days, the compound still retained 60% inhibition of the target enzyme relative to DMSO (no compound) control.
6. Click Chemistry (CC)-ABPP Characterization of KT53
In addition to competitive ABPP assays for analysis of inhibitor selectivity, we also directly assessed inhibitor-reactive proteins using click chemistry (CC)-ABPP.13,19 In this approach, an alkyne analog is synthesized for the compound of interest and added to both proteomes and living cells, after which CC conjugation to a fluorescent azide reporter tag reveals inhibitor-labeled proteins. This strategy can reveal additional covalent targets for small-molecules that are either 1) not reactive with competitive ABPP probes or 2) labeled by the small-molecule to only a minor extent (and thus not visibly depleted in reactivity by competitive ABPP). We designed two alkyne analogs for KT53, KT59 and KT60, and synthesis was completed as outlined in Schemes 3 and 4, respectively. KT59, bearing an alkyne in place of fluorine at the meta position of the N-phenyl, was synthesized via 4-component Ugi reaction (Scheme 3) as described for other Scaffold 2 derivatives (Scheme 2). For KT60, an aliphatic alkyne was substituted for cyclohexyl as the right-hand amide substituent, and the compound was synthesized from ethyl 2-pyridylacetate (I) as outlined in Scheme 4. Briefly, following α-bromination of I and reaction with 3-fluoroaniline, the imine J was obtained in a mixture of unreacted 3-fluoroaniline reagent and brominated intermediate K. Conversion of K to J was achieved upon treatment of the mixture with acetic anhydride in pyridine. Reduction of J with sodium borohydride gave intermediate L, which was hydrolyzed and then condensed with 5-hexyn-1-amine to afford the alkynyated product M. Treatment of M with chloroacetyl chloride gave KT60.
Scheme 3.

Scheme 4.

Both analogs had similar selectivity profiles to KT53; however, when tested for GSTO1 inhibition at 100 nM compound concentration, the potency of KT59 (≥ 98%) more closely matched that of KT53 (100%), with KT60 providing only 80% inhibition of GSTO1 (Figure S7). Indeed, KT59 exhibited almost identical dose-response profiles in vitro and in situ as compared to KT53 (Figure 6C and D versus A and B). As such, KT59 was deemed a more appropriate analog for comparison to KT53 for selectivity analysis.
The full in vitro dose-response competitive ABPP experiment with the SE-Rh probe is shown in Figure 8A for KT53 (Panel 1) and KT59 (Panel 2). Again, both compounds are observed to have highly similar inhibition profiles. In the third panel of Figure 8A, instead of competition with SE-Rh, KT59-labeled proteins are visualized directly following CC conjugation with a rhodamine-azide (Rh-N3) reporter tag. At higher (300 nM - 10 µM) concentrations, some concentration-dependent, non-specific labeling by KT59 (not competed by pre-treatment with KT53, Figure 8B) of predominantly abundant (e.g., see Coomassie-stained gel,Figure S8) proteins is observed; however, at lower (< 300 nM) concentrations, GSTO1 is the principal target labeled by KT59. Importantly, the 30 nM compound concentration is sufficient to achieve near-complete inhibition of GSTO1 with negligible cross-reactivity with other proteins.
Figure 8.

In vitro competitive ABPP and CC-ABPP profiles of KT53 and KT59 in MDA-MB-435 soluble proteome. A) Competitive ABPP for KT53 (Panel 1) and KT59 (Panel 2) with the SE-Rh probe shows selective inhibition of GSTO1. To directly assess the degree of off-target reactivity, proteins labeled by KT59, which bears a terminal alkyne handle, are functionalized via CC with an azide-conjugated fluorescent reporter tag Rh-N3 (Panel 3). Near-complete inhibition of GSTO1 is observed at 30 nM or greater concentrations of KT59, while labeling of off-targets is minimal until higher inhibitor concentrations (300 nM or greater). B) Competitive CC-ABPP experiment where proteome is first incubated with KT53 followed by reaction with KT59 and CC conjugation with Rh-N3. Besides GSTO1, none of the KT59-labeled bands (e.g., 45–70 kDa region) are competed by pre-incubation with KT53, indicating that the latter are non-specific targets of KT59.
KT59 also inhibited GSTO1 in living cells with equivalent potency and selectivity as compared to KT53. The competitive ABPP (SE-Rh probe) and CC-ABPP profiles generated from in situ treatment of MDAMB-435 cells (6 hr time point) are shown in Figure 9 (Panels 1 and 2). Similar to the in vitro proteome labeling experiments (Figure 8), a concentration range of KT59 was identified (~63–250 nM) where near-complete inhibition of GSTO1 was achieved with negligible off-target reactivity (as assessed by CC-ABPP in Figure 9, Panel 3). Even at higher concentrations (0.5–1 µM), KT59 did not show substantial reactivity with other proteins as judged by both competitive ABPP and CC-ABPP (Figure 9, Panels 2 and 3). Given the highly similar structures, profiles, and potencies of KT59 and KT53, these data strongly suggest that KT53, like KT59, can inhibit GSTO1 to near-completion in cancer cells without showing substantial reactivity with other proteins.
Figure 9.

In situ competitive ABPP and CC-ABPP profiles of KT53 and KT59 in the MDAMB-435 soluble proteome. Competitive ABPP for KT53 (Panel 1) and KT59 (Panel 2) with the SE-Rh probe shows selective inhibition of GSTO1 following a 6 hr in situ incubation. To directly assess the degree of off-target reactivity, proteins labeled by KT59 are functioned via CC with the fluorescent reporter tag Rh-N3 (Panel 3). Near-complete inhibition of GSTO1 is observed at 63 nM or greater concentrations of KT53 and KT59, while labeling of off-targets is minimal until higher inhibitor concentrations (1 µM).
7. Stability of KT53
During the course of evaluating KT53, we observed that the compound was not stable if stored as a DMSO stock at room temperature. Analysis by HPLC revealed that KT53 (Figure 10A, retention time 16.8 min) readily transformed into an inactive compound (Figure 10A, retention time 9.1 min). Plotting a time course of inactivation under conditions relevant to in situ treatment (DPBS, 37 °C) reveals that the majority of active KT53 is converted quite rapidly, within six hr (Figure 10A, inset). The decomposition product was observed to have a unit mass of 368, which is consistent with intramolecular nucleophilic attack of the pyridyl nitrogen to displace the chloride, giving the pyridinium salt (Figure 10A). This phenomenon was observed for all 2-pyridyl derivatives, such as KT59 (Figure 10B), KT33, KT54, and KT55 (data not shown). In contrast, compound 3, which cannot adopt a conformation wherein the 3-pyridyl nitrogen is in position to attack the CA at the alpha position, was stable under the same conditions for up to 24 hr (Figure 10C).
Figure 10.

KT53 (A) and KT59 (B), but not compound 3 (C) are unstable in DPBS at 37 °C. A 24 hr timecourse monitored by HPLC-MS and UV show that KT53 and KT59 decompose to the corresponding pyridinium salt via intramolecular attack of the pyridine nitrogen on the CA. The conversion is over 50% complete at 3 hr, and ~85% complete at 6 hr. This phenomenon is only observed with compounds bearing a 2-substituted pyridine, where the nitrogen is aligned for nucleophilic attack of the alpha position of the CA (e.g., compound 3 is stable under the same conditions; C).
Although this property requires careful storage of KT53 (in DMSO solution, the compound remains active if stored at −80 °C for several months, data not shown), the ability of KT53 to self-inactivate may actually provide a fortuitous advantage in pharmacology experiments by decreasing off-target effects, as the compound could react rapidly with GSTO1 (within 1 hr, Figure 7) and then self-deactivate (~85% within 6 hr), thus limiting the opportunity for reaction with other proteins. Additionally, the comparatively rapid inactivation versus sustained GSTO1 inhibition (90% after 18 hr, Figure 7) suggests that the enzyme-inhibitor complex is highly stable.
8. Effect of GSTO1 inhibition on cisplatin-induced cytotoxicity
KT53 and KT59 showed minimal cytotoxicity in MDA-MB-435 cells, with CC50s > 25 µM (Figure S9) that are well above the dose required to inhibit GSTO1 in situ (Figure 9). These results suggest that inhibiting GSTO1 is not, on its own, deleterious to cancer cell survival. However, it has recently been reported that HeLa cells over-expressing GSTO1 show enhanced survival upon exposure to the cytotoxic agent cisplatin as compared to non-tranfected cells expressing endogenous levels of GSTO1 and cells transfected with GSTO1-siRNA.3 We therefore asked whether pharmacological inhibition of GSTO1 also impacted cancer cell viability in the presence of other cytotoxic agents.
Cultured MDA-MB-435 cells treated with or without KT53 (1 µM dosed at t = 0 and 12 hr) were exposed to cisplatin (0–250 µM, dosed at t = 1 hr) for 24 hr, and cell viability was determined using the WST-1 Reagent (Roche). KT53-treated cells were found to show significantly greater sensitivity to cisplatin-induced cytotoxicity compared to control (DMSO-treated) cells (Figure 11). The experiment was also repeated at lower doses of KT53 (0.5, 0.25, and 0.125 µM), with less dramatic, though still significant, increases in cell death observed relative to DMSO treated cells (Figure S10). It is possible that these lower concentrations of KT53 may not provide sufficient inhibition of GSTO1 over the extended 24 hr time course of the experiment (KT53 dosed twice, once at time zero and again at 12 hr, with a 12 hr in situ incubation providing 90%, 80%, and 70% inhibition at 0.5 µM 0.25 µM, and 0.125 µM, respectively, versus 95% for 1 µM; see Figure S11) to see as pronounced a response. These results thus provide the first pharmacologic evidence in support of the hypothesis that GSTO1 plays an important role in chemotherapy resistance in cancer cells.
Figure 11.

Effects of GSTO1 inhibition on cisplatin-induced cytotoxicity. Cultured MDAMB-435 cells were treated with KT53 (1 µM) or DMSO for 1 hr prior to administration of cisplatin (0–250 µM). After 12 hr, cells were re-administered KT53 (1 µM). After 24 hr total cisplatin incubation time, cell viability was determined using a WST-1 assay. Data shown are average ± SEM of 7 bioloical replicates (n = 5 ea); *** P < 0.0005; ** P < 0.005; * P < 0.05. Statistical analysis: unpaired Student’s t-test (GraphPad Prism).
CONCLUSION
GSTO1 belongs to an ancient class of GST enzymes that differ from other members of this superfamily in possessing an active site cysteine nucleophile. This residue grants GSTO1 a range of thioltransferase and reductase activities, although the physiologic substrates and functions of this enzyme remain enigmatic. GSTO1-knockdown or overexpression studies point to a role for this enzyme in chemotherapy resistance in cancer cells, where it appears to block cisplatin-induced apoptosis by stimulating pro-survival kinase pathways.3,4 The impact of pharmacologically inactivating GSTO1 on cancer cell survival has, however, not yet been examined due in large part to a lack of selective and cell-active inhibitors. Here, we report the development of a series of potent and selective α-chloroacetamide inhibitors of GSTO1, which irreversibly inactivate this enzyme by covalent modification of the enzyme’s active site cysteine. These inhibitors, which emerged from a fluopol-ABPP screen of the 300,000+ MLPCN small molecule library, inactivate GSTO1 in cancer cells with excellent potency (IC50 ~3040 nM), selectivity, and duration of action (> 12 hr). At higher concentrations in vitro (> 100 nM), the optimized alkyne inhibitor KT59 showed some evidence of modifying other proteins, but we should note that these modification events exhibited strong concentration-dependent increases in signal intensity, even at the highest inhibitor concentration tested (10 µM), which suggests that they reflect low-percentage labeling of abundant proteins (a premise that is also supported by our competitive ABPP experiments, where the labeling of these proteins by activity-based probes was not competed by KT53 at concentrations below 10 µM; see Figure 8). We therefore do not believe that these additional protein interactions will interfere with the use of KT59 (and its non-alkyne analogue KT53) as a selective probe of GSTO1 function in living systems. We should, however, point out that the apparent selectivity of KT59 as judged by click chemistry-ABPP applies only to mechanisms of covalent inhibition, and it remains possible that KT59 or metabolites of this compound also interact with additional proteins in a non-covalent manner. Additional studies will also be required to determine whether KT53 and/or KT59 can be used to inhibit GSTO1 in vivo.
Using the optimized inhibitor KT53, we found that inactivating GSTO1 sensitized cancer cells to cisplatin-induced cell death, thus supporting a role for this enzyme in chemotherapy resistance. This finding, coupled with previous discoveries that GSTO1 is overexpressed in cancer cells that show enhanced aggressiveness and chemotherapy resistance34 and that RNA-interference (RNAi) knockdown of GSTO1 sensitizes cancer cells to cisplatin cytotoxicity3 point to a function for this enzyme in cancer and drug resistance. Future studies will be required to more broadly evaluate this premise and include: 1) determining the metabolomic and proteomic effects of inhibiting GSTO1 on cancer cell biochemistry, 2) assessing the impact of GSTO1 inhibition and RNAi knockdown on cancer cell sensitivity to other chemotherapeutic agents both in vitro and in vivo, and 3) understanding the cellular mechanism for GSTO1-mediated pro-survival effects. If these studies continue to support a role for GSTO1 in cancer, suitably optimized inhibitors of this enzyme might one day find value as drugs to enhance the activity of conventional chemotherapies. We also note with interest that GSTO1 was recently identified as a target of the anti-cancer agent piperlongumine, which might indicate an additional role for this enzyme in modulating reactive-oxygen species in tumor cells.20 The output of our study, which reports a large-scale screen that yielded a very high hit rate for GSTO1 inhibitors (1.1% in primary screen), as well as the optimization of a subset of these compounds into selective agents with good cellular activity, provides both 1) excellent starting points for expanded efforts to develop additional classes of GSTO1 inhibitors, and 2) pharmacological probes suitable for exploring the function of this enzyme in cancer and other (patho)physiologic processes.
Supplementary Material
ACKNOWLEDGMENT
We thank Steven Brown, Jill Ferguson, and Kim Masuda for technical assistance. This work was supported by National Institutes of Health grants CA087660 (B.F.C.), MH084512 (H.R.); Dainippon Sumitomo Pharma (K.T); the National Science Foundation (pre-doctoral fellowship to D.A.B.); the California Breast Cancer Research Program (predoctoral fellowship to D.A.B.); and The Skaggs Institute for Chemical Biology.
Footnotes
ASSOCIATED CONTENT
Supporting Information. LC-MS/MS analysis of site of labeling protocol and results; synthetic protocols and analysis of 1, 3, and all KT-series compounds; structures and gel-based competitive ABPP analysis of HTS hit compounds; additional gel-based competitive ABPP analysis of Scaffold 1 and 2 compounds; CC50 dose-response curves for KT53 and KT59; complete Ref. 7. This material is available free of charge via the Internet at http://pubs.acs.org.
REFERENCES
- 1.Hayes JD, Flanagan JU, Jowsey IR. Annu. Rev.Pharmacol. Toxicol. 2005;45:51. doi: 10.1146/annurev.pharmtox.45.120403.095857. [DOI] [PubMed] [Google Scholar]
- 2.Adam GC, Burbaum J, Kozarich JW, Patricelli MP, Cravatt BF. J. Am. Chem.Soc. 2004;126:1363. doi: 10.1021/ja038441g. [DOI] [PubMed] [Google Scholar]
- 3.Piaggi S, Raggi C, Corti A, Pitzalis E, Mascherpa MC, Saviozzi M, Pompella A, Casini AF. Carcinogenesis. 2010;31:804. doi: 10.1093/carcin/bgq031. [DOI] [PubMed] [Google Scholar]
- 4.Yan XD, Pan LY, Yuan Y, Lang JH, Mao N. J.Proteome Res. 2007;6:772. doi: 10.1021/pr060402r. [DOI] [PubMed] [Google Scholar]
- 5.Bachovchin DA, Brown SJ, Rosen H, Cravatt BF. Nat.Biotechnol. 2009;27:387. doi: 10.1038/nbt.1531. [DOI] [PMC free article] [PubMed] [Google Scholar]
- 6.Son J, Lee JJ, Lee JS, Schuller A, Chang YT. ACS.Chem.Biol. 2010;5:449. doi: 10.1021/cb100007s. [DOI] [PubMed] [Google Scholar]
- 7.Board PG, et al. J.Biol Chem. 2000;275:24798. doi: 10.1074/jbc.M001706200. [DOI] [PubMed] [Google Scholar]
- 8.Whitbread AK, Masoumi A, Tetlow N, Schmuck E, Coggan M, Board PG. Methods Enzymol. 2005;401:78. doi: 10.1016/S0076-6879(05)01005-0. [DOI] [PubMed] [Google Scholar]
- 9.Weerapana E, Wang C, Simon GM, Richter F, Khare S, Dillon MB, Bachovchin DA, Mowen K, Baker D, Cravatt BF. Nature. 2010;468:790. doi: 10.1038/nature09472. [DOI] [PMC free article] [PubMed] [Google Scholar]
- 10.Weerapana E, Simon GM, Cravatt BF. Nat. Chem.Biol. 2008;4:405. doi: 10.1038/nchembio.91. [DOI] [PMC free article] [PubMed] [Google Scholar]
- 11.Board PG, Coggan M, Cappello J, Zhou H, Oakley AJ, Anders MW. Anal Biochem. 2008;374:25. doi: 10.1016/j.ab.2007.09.029. [DOI] [PubMed] [Google Scholar]
- 12.Adam GC, Sorensen EJ, Cravatt BF. Nat.Biotechnol. 2002;20:805. doi: 10.1038/nbt714. [DOI] [PubMed] [Google Scholar]
- 13.Speers AE, Cravatt BF. Chem.Biol. 2004;11:535. doi: 10.1016/j.chembiol.2004.03.012. [DOI] [PubMed] [Google Scholar]
- 14.Fenn JB, Mann M, Meng CK, Wong SF, Whitehouse CM. Science. 1989;246:64. doi: 10.1126/science.2675315. [DOI] [PubMed] [Google Scholar]
- 15.Eng J, McCormack AL, Yates JR. J. Am. Soc.Mass Spectrom. 1994;5:976. doi: 10.1016/1044-0305(94)80016-2. [DOI] [PubMed] [Google Scholar]
- 16.Tabb DL, McDonald WH, Yates JR., 3rd J.Proteome Res. 2002;1:21. doi: 10.1021/pr015504q. [DOI] [PMC free article] [PubMed] [Google Scholar]
- 17.Bachovchin DA, Zuhl AM, Speers AE, Wolfe MR, Weerapana E, Brown SJ, Rosen H, Cravatt BF. J. Med.Chem. 2011 doi: 10.1021/jm200502u. [DOI] [PMC free article] [PubMed] [Google Scholar]
- 18.Bittker JA, Weiwer M, Shimada K, Yang WS, MacPherson L, Dandapani S, Munoz B, Palmer M, Stockwell BR, Schreiber SL. Probe Reports from the NIH Molecular Libraries Program. 2010 [Google Scholar]
- 19.Speers AE, Adam GC, Cravatt BF. J. Am. Chem.Soc. 2003;125:4686. doi: 10.1021/ja034490h. [DOI] [PubMed] [Google Scholar]
- 20.Raj L, Ide T, Gurkar AU, Foley M, Schenone M, Li X, Tolliday NJ, Golub TR, Carr SA, Shamji AF, Stern AM, Mandinova A, Schreiber SL, Lee SW. Nature. 2011;475:231. doi: 10.1038/nature10167. [DOI] [PMC free article] [PubMed] [Google Scholar] [Retracted]
Associated Data
This section collects any data citations, data availability statements, or supplementary materials included in this article.